

Abstract
Hepatocellular carcinoma (HCC) is the fifth most common cancer worldwide. In this study, our objective was to identify differentially regulated proteins in HCC through a quantitative proteomic approach using iTRAQ. More than 600 proteins were quantitated of which 59 proteins were overexpressed and 92 proteins were underexpressed in HCC as compared to adjacent normal tissue. Several differentially expressed proteins were not implicated previously in HCC. A subset of these proteins (six each from upregulated and downregulated groups) was further validated using immunoblotting and immunohistochemical labeling. Some of the overexpressed proteins with no previous description in the context of HCC include fibroleukin, interferon induced 56 kDa protein, milk fat globule-EGF factor 8, and myeloidassociated differentiation marker. Interestingly, all the enzymes of urea metabolic pathway were dramatically downregulated. Immunohistochemical labeling confirmed differential expression of fibroleukin, myeloid associated differentiation marker and ornithine carbamoyl transferase in majority of HCC samples analyzed. Our results demonstrate quantitative proteomics as a robust discovery tool for the identification of differentially regulated proteins in cancers.
Keywords: fibroleukin, myeloid-associated differentiation marker, HCV, iTRAQ, liver, mass spectrometry, strong cation exchange chromatography, urea cycle
Introduction
Hepatocellular carcinoma (HCC) is the fifth most common primary malignancy of the liver. It is often diagnosed in advanced stages resulting in a very high mortality rate. In the United States alone, 17 000–20 000 new cases are reported every year, and there is evidence suggesting that the incidence is increasing.1–3 HCC is often seen in association with cirrhosis, and additional risk factors include hepatitis B (HBV) and hepatitis C (HCV), alcohol, aflatoxin, family history, and smoking.
Early diagnosis of HCC is known to improve the outcome. Improvements in imaging modalities have increased sensitivity, but at the cost of specificity. Currently available biomarkers, however, lack adequate sensitivity or specificity. Alpha-fetoprotein (AFP) is the most widely used biochemical blood test for HCC, which is elevated in less than 60% of patients.4 Increased levels of AFP are common in patients with chronic hepatitis decreasing the utility of this test for surveillance purposes. Other potential biomarkers have been identified, although the majority of them have not been validated prospectively for clinical purposes.5 Transcriptomic analyses of HCC suggest that it is a complex disease with numerous molecular alterations.2,6,7Thus, it is unlikely that a single biomarker will be adequate to monitor HCC and perhaps a panel of biomarkers is needed for early detection in high-risk population or when the imaging study is nonconfirmatory. Global profiling of HCC using quantitative proteomics would provide several potential markers differentially expressed in cancers. Although earlier studies have reported differentially expressed proteins in HCC, they have several limitations including lack of comprehensive and quantitative information.8–10
Isobaric tags for relative and absolute quantification (iTRAQ) is a set of amine-specific isobaric tags for multiplexed relative quantitation of proteins by mass spectrometry.11 iTRAQ based quantitative proteomics is a promising approach for global comparison of protein expression in relatively small amount of samples. iTRAQ method has been employed in many cancer biomarker studies such as analysis of saliva in breast cancer,12 human prostate cancer cell lines,13 and chronic myeloid leukemia14 and in breast cancer derived cells.15
In the current study, we have carried out global proteomic profiling of HCC and identified several differentially expressed proteins. Further, a subset of proteins showing greater than 3 fold difference in expression were validated by Western blotting and immunohistochemical labeling of tissue microarrays.
Materials and Methods
Tissue Samples
Liver tissue samples were procured after obtaining Institutional Review Board approval. Fresh tissues were collected at the time of surgery from patients with HCV associated HCC. Tumor and adjacent non-neoplastic tissues were determined by an experienced pathologist. Same sections of the tissue were formalin embedded and were used for both confirmation of tumor and nontumor regions and validation of iTRAQ data. Formalin fixed and paraffin embedded tissue microarrays (TMA) (thickness, 0.5 µM and diameter, 1.5 mm) were used for immunohistochemical labeling. Tissue microarrays obtained from Imgenex consisted of 13 metastatic tissues along with 46 poor to well differentiated hepatocellular carcinoma from patients in the age group of 40 to 72 years (Cat. No. IMH-318) and 59 noncancer tissues (Cat. No. IMH-342). The tissue microarrays from Creative Biolabs (Cat, No. CBL-TMA-070) consisted of 15 well differentiated, 29 moderately differentiated, and 12 poorly differentiated hepatocellular carcinoma from patients in the age group of 35–77 years and 20 noncancer tissues in triplicates (CBL-TMA-076).
iTRAQ Labeling and SCX Fractionation
Tumor and adjacent noncancerous liver tissue from HCC patient were used for iTRAQ labeling experiment. Ten milligrams of liver tissue lysates homogenized in 0.5% SDS and protease inhibitors (PMSF and EDTA) using Dounce homogenizer followed by sonication. Samples were normalized based on protein concentration. Trypsin digestion and iTRAQ (Applied Biosystems Cat. No. 4352135) labeling was carried out according to manufacturer’s protocol using the reagents provided unless otherwise mentioned. Briefly, 80 µg of each lysate was treated with 2 µL of reducing agent (tris(2-carboxyethyl) phosphine (TCEP)) at 60 °C for 1 h and alkylated with 1 µL of cysteine blocking reagent, methyl methanethiosulfonate (MMTS)) for 10 min at room temperature. Protein sample was digested using sequencing grade trypsin (Promega) (1:10) for 16 h at 37 °C.15 Peptides from each sample in a final volume of 40 µL were labeled with one of the four iTRAQ reagents at room temperature. After labeling tryptic digests from noncancerous or cancerous tissue samples, the peptides were mixed and fractionated on strong cation exchange chromatography on PolySULFOETHYL A column (PolyLC, Columbia, MD) (100 × 2.1 mm, 5 µm particles with 300 Å pores) using an LC Packing HPLC system connected to a Probot fraction collector. Thirtynine SCX fractions (0.5 mL) were collected from a 0–350 mM KCl gradient in the presence of 10 mM potassium phosphate buffer (pH 2.85), containing 25% acetonitrile for 70 min at a flow rate of 0.2 mL/min. Solvent A contained 10 mM potassium phosphate buffer, pH 2.85, 25% acetonitrile and solvent B contained 10 mM potassium phosphate buffer, 350 mM KCl, pH 2.85, 25% acetonitrile. The fractions were dried and reconstituted in 10 µL of 2% trifluoroacetic acid or stored at −80 °C until mass spectrometry analysis.
Mass Spectrometry and Protein Quantitation
LC-MS/MS analysis of the sample was carried out using reversed-phase liquid chromatography (RP-LC) interfaced with a quadrupole time-of-flight mass spectrometer (QSTAR/pulsar, Applied Biosystems). RP-LC system (Agilent 1100 system) consisted of a trap column (75 µm × 3 cm, C18 material 5–10 µm, 120 Å) and an analytical column (75 µm × 10 cm, C18 material 5 µm, 120Å) fitted with an emitter tip 8 µm (New Objective, Woburn, MA). LC-MS/MS data was acquired by online analysis of peptides eluted using 5–40% acetonitrile in 0.1% formic acid for 30 min with a flow rate of 300 nL/min. The MS spectra were acquired in a data dependent manner from m/z 350 to 1200 Da targeting three most abundant ions in the survey scan and those ions selected were excluded from MS/MS for 45s. Twenty percent higher collision energy was applied during MS/MS scan with a charge state dependent collision energy selection criteria. Proteinpilot software v2.0.1 (Applied Biosystems MDS SCIEX) was used for identification and quantitation of proteins. The data from 39 LC-MS/MS analyses on QStar was searched against NCBI RefSeq database version 26 containing human 39 380 protein entries. Peptide and protein identification was carried out according to the Molecular and Cellular Proteomics guidelines.16 Paragon algorithm in Proteinpilot was used for peptide identification and subsequently searched results were processed by Pro Group algorithm. Search parameters included iTRAQ labeling at N-terminus and lysine residues, cysteine modification by methyl methanethiosulfonate (MMTS), digestion by trypsin. Isoform specific identification and quantitation was carried out by selecting peptides distinct to each form and excluding all shared peptides from quantitation. Proteins identified with >95% confidence or Protscore >1.3 were used for further analysis.
Western Blotting
Tumor and normal tissues were homogenized in 0.5% SDS containing protease inhibitor mixture (Complete: Roche Applied Science). Eighty micrograms of protein from each tissue was transferred electrophoretically onto nitrocellulose membrane (Protran, Whatman). After the transfer of protein, nitrocellulose membrane was blocked with 5% BSA in phosphate-buffered saline with 0.1% Tween 20 (PBS-T) for 1 h at room temperature. The following antibodies were used: fibroleukin (1:2000, sc-30869, Santa Cruz Biotech.), vitamin-D binding protein (1:1000, sc-32899, Santa Cruz Biotech), filamin 1 (1:500, sc-17749, Santa Cruz Biotech), FHL1B (1:1000, 18-003-42516, Genway), fibrillin 2 (1:500, ab21619, Novus), talin 1 (1:500, ab11188, Abcam), cystatin B (1:1000, AF1408 R&D systems), ornithine carbamoyl transferase (1:500, HPA000243, Sigma), prostatic binding protein (1:500, 4742, Cell Signaling), fatty acid binding protein 1 (1: 500, sc-50380, Santa Cruz Biotech), carbamoyl phosphate synthetase 1 (1: 500, sc-30060, Santa Cruz Biotech), Arginase 1 (1:500, HPA003595, Sigma), and microsomal epoxide hydrolase (1:500, E93220, BD Biosciences). The membranes were probed with primary antibody followed by horseradish peroxidase-conjugated antibody and developed using enhanced chemiluminescence detection according to the manufacturer’s instructions (Amersham Biosciences).
Immunohistochemical Labeling
Immunohistochemical (IHC) labeling17 was also performed on liver tissues from the same patient’s sample used for the proteomic experiment. For the screening purposes liver cancer tissue microarrays containing large number of HCC and noncancer liver tissue samples were used. Novel candidates selected for immunohistochemistry analysis included fibroleukin, myeloid-associated differentiation marker (IMG-5908A, Imgenex), vitamin-D binding protein and ornithine carbamoyl transferase. Immunohistochemical labeling of fibroleukin and ornithine carbamoyl transferase was performed on IMH-318 and IMH-342 tissue microarrays. IHC for myeloid-associated differentiation marker was carried out using tissue microarrays from Creative Biolabs. The Envision kit (DAKO) was used according to the manufacturer’s instructions. In brief, formalin fixed paraffin embedded tissue sections were deparaffinized and antigen retrieval was performed for 20 min in 0.01 mol/L of sodium citrate buffer. Endogenous peroxidase was quenched using hydrogen peroxide. The sections were incubated with primary antibody (dilution 1:100). After rinsing with wash buffer, the slides were incubated with HRP conjugated appropriate secondary antibody. The signal was developed using Dako chromogen supplied for peroxidase. Tissue sections were observed using Nikon DS-Fi1, microscope operated using NIS-Elements F package. The immunohistochemical labeling was assessed by an experienced liver pathologist and staining intensity was scored as negative (0), weak (1+), moderate (2+), and strong (3+). The distribution of staining of cancer cells was scored as 0 (less than 5% of cells staining), 1+ (5–30% of cell staining), 2+ (31–60% of cells staining) and 3+ (greater than 60% of cells staining). The intensity and distribution scores were then summed for each case.
Results
iTRAQ Labeling and Protein Quantitation
Our goal was to identify differentially expressed proteins in hepatocellular carcinoma and to subsequently validate a subset of these potential biomarkers. For the discovery phase of our study, we selected the tumor and noncancerous liver tissue from the same patient diagnosed with HCV-related HCC. Lysates of tumor and noncancerous liver tissues were labeled with iTRAQ reagents as shown in Figure 1. Technical replicates were prepared by labeling noncancer tissue derived peptides with 114 and 115 and HCC derived peptides with 116 and 117 iTRAQ labels. The data from a total of 40 504 MS/MS spectra (nonempty) generated by LC-MS/MS analysis of 39 SCX fractions were searched against the human RefSeq database using Proteinpilot. Based on the identification and quantitation criteria set in Proteinpilot, a protein is reported if a quantitation ratio is obtained using at least two unique peptides with “unused” confidence cutoff (ProtScore) >1%. However, manual inspection of spectra was carried out wherever identification was supported by less than 70% confidence values. Using ProtScore >1.3 (95%) cutoff, 639 proteins were identified from 10 270 distinct peptides (20 833 MS/MS spectra). Using ProtScore >1.0 (Cutoff >90% confidence) we found 22 additional proteins, which were manually validated. The complete list of these proteins can be found in Supplementary Table 1 (Supporting Information). Bias correction was applied to account for normalization errors.
Figure 1.
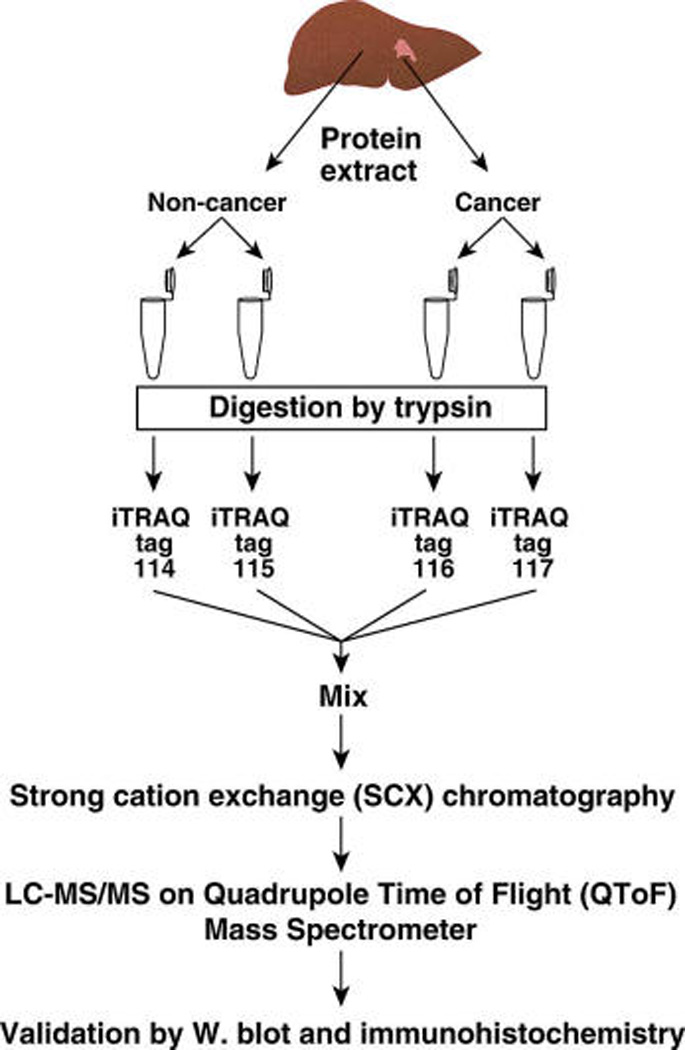
Quantitative proteomic analysis of hepatocellular carcinoma. Homogenates were prepared from the tumor and adjacent noncancerous liver tissues from a diagnosed case of HCC. The protein samples (80 µg from each sample) were digested using trypsin, and peptides were labeled with iTRAQ reagents. Labeled peptides were combined and fractionated by strong cation exchange chromatography. Thirty-nine fractions (0.5 mL) were obtained and analyzed by LC-MS/MS.
Representative peptide MS/MS spectra and reporter ions of 8 differentially expressed proteins are shown in Figure 2. The fold changes were calculated from the ratio of intensity of iTRAQ reporter ions obtained for tumor derived peptides to those derived from adjacent noncancerous tissue. Using 3-fold as a stringent cutoff to designate up or downregulated proteins, we observed that 59 proteins were upregulated and 92 proteins were downregulated in HCC (Table 1 and Table 2). To our knowledge, this is the first large-scale quantitative proteomics profiling of HCC tissue revealing several novel and known differentially regulated proteins. Importantly, we were able to identify many proteins that have been previously reported to be upregulated in HCC. Proteins and peptides identified in this study have also been deposited in Human Proteinpedia, a publicly available portal for sharing and integration of human proteomic data,18 where the MS/MS spectra of peptides from the proteins identified in this study can be visualized.
Figure 2.
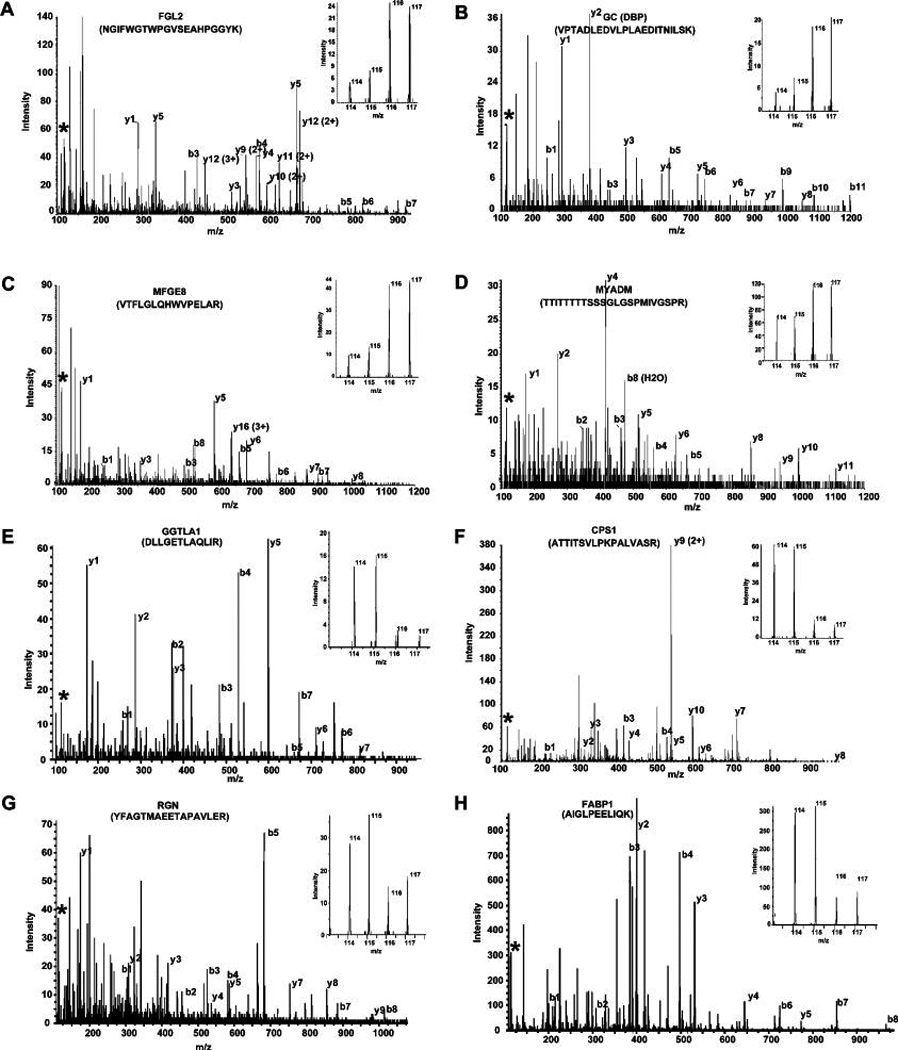
Quantitation by iTRAQ. (A–D) MS/MS spectra of representative peptides from upregulated proteins; fibroleukin (FGL2), vitamin-D binding protein (GC), milk fat globule-EGF factor 8 (MFGE8), and myeloid-associated differentiation marker (MYADM), respectively. (E–H) MS/MS spectra of gamma-glutamyltransferase-like activity 1 (GGTLA1), carbamoyl-phosphate synthetase 1, (CPS1), regucalcin (RGN), and fatty acid binding protein 1 (FABP1), respectively. (Insets) Relative intensity of reporter ions (m/z; normal 114, 115 and tumor 116, 117) from MS/MS fragmentation.
Table 1.
List of Upregulated Proteins Identified with No Previously Published Association with Hepatocellular Carcinoma
| no. | RefSeq accession # | Gene symbol | Protein name | iTRAQ ratio (tumor/nontumor |
|---|---|---|---|---|
| 1 | NP_001440.2 | FHL1 | Four and a half LIM domains 1 | 9.6 |
| 2 | NP_001001670.1 | FLJ46321 | Hypothetical protein LOC389763 | 9.4 |
| 3 | NP_001539.3 | IFIT1 | Interferon-induced protein with tetratricopeptide repeats 1 isoform 2 | 8.5 |
| 4 | NP_001990.2 | FBN2 | Fibrillin 2 | 8.4 |
| 5 | NP_006673.1 | FGL2 | Fibroleukin | 8.2 |
| 6 | NP_002209.2 | ITIH4 | Interalpha (globulin) inhibitor H4 | 6.6 |
| 7 | XP_001131713.1 | LOC730410 | PREDICTED: similar to HLA class I histocompatibility antigen, B-18 alpha chain | 6.5 |
| 8 | NP_001701.2 | CFB | Complement factor B | 6.1 |
| 9 | NP_000925.2 | SERPINF2 | Alpha-2-plasmin inhibitor | 6.1 |
| 10 | NP_001018657.1 | MYADM | Myeloid-associated differentiation marker | 5.6 |
| 11 | NP_001026862.1 | LRRC17 | Leucine rich repeat containing 17 isoform 1 | 5.6 |
| 12 | NP_001076.2 | SERPINA3 | Serpin peptidase inhibitor, clade A, member 3 | 5.0 |
| 13 | NP_000468.1 | ALB | Albumin | 4.5 |
| 14 | NP_005919.1 | MFGE8 | Milk fat globule-EGF factor 8 protein | 4.4 |
| 15 | NP_001634.1 | APOA2 | Apolipoprotein A-II | 4.4 |
| 16 | NP_004361.3 | COL12A1 | Collagen, type XII, alpha 1 long isoform | 4.1 |
| 17 | NP_036544.1 | H2AFV | H2A histone family, member V isoform 1 | 4.1 |
| 18 | NP_001210.1 | CALU | Calumenin | 4.0 |
| 19 | NP_000030.1 | APOA1 | Apolipoprotein A-I | 4.0 |
| 20 | NP_001918.3 | DES | Desmin | 3.9 |
| 21 | NP_000292.1 | PLG | Plasminogen | 3.8 |
| 22 | NP_001613.1 | AHSG | Alpha-2-HS-glycoprotein | 3.8 |
| 23 | NP_005264.2 | GNB2 | Guanine nucleotide-binding protein, beta-2 subunit | 3.8 |
| 24 | NP_004326.1 | BST2 | Bone marrow stromal cell antigen 2 | 3.7 |
| 25 | NP_068758.2 | FKBP10 | FK506 binding protein 10, 65 kda | 3.7 |
| 26 | NP_002499.2 | NID1 | Nidogen 1 | 3.7 |
| 27 | NP_055129.2 | DDX58 | DEAD/H (Asp-Glu-Ala-Asp/His) box RIG-I | 3.6 |
| 28 | NP_005132.2 | FGB | Fibrinogen, beta chain | 3.6 |
| 29 | NP_114437.2 | EMILIN2 | Elastin microfibril interfacer 2 | 3.5 |
| 30 | NP_997637.1 | PRKAR1A | Camp-dependent protein kinase, regulatory subunit alpha 1 | 3.4 |
| 31 | NP_000574.2 | GC | Vitamin D-binding protein | 3.4 |
| 32 | NP_000499.1 | FGA | Fibrinogen, alpha isoform alpha-E | 3.4 |
| 33 | NP_002207.2 | ITIH2 | Interalpha globulin inhibitor H2 | 3.4 |
| 34 | NP_002061.1 | GNAI2 | Guanine nucleotide binding protein (G protein) alpha inhibiting activity 2 | 3.3 |
| 35 | NP_005520.4 | HSPG2 | Heparan sulfate proteoglycan 2 | 3.3 |
| 36 | NP_001760.1 | CD9 | CD9 antigen | 3.3 |
| 37 | NP_001074419.1 | MYO1C | Myosin IC isoform b | 3.2 |
| 38 | NP_005134.1 | HP | Haptoglobin | 3.2 |
| 39 | NP_001002235.1 | SERPINA1 | Serine (or cysteine) proteinase inhibitor, clade A, member 1 | 3.2 |
| 40 | NP_068656.2 | FGG | Fibrinogen, gamma chain isoform gamma-B | 3.2 |
| 41 | NP_063940.1 | DIABLO | Diablo isoform 1 | 3.1 |
| 42 | NP_444253.3 | MYLK | Myosin light chain kinase isoform 1 | 3.1 |
| 43 | NP_005511.1 | HNRNPH1 | Heterogeneous nuclear ribonucleoprotein H1 | 3.1 |
| 44 | NP_001072990.1 | KTN1 | Kinectin 1 isoform b | 3.1 |
| 45 | NP_005794.1 | FLOT1 | Flotillin 1 | 3.1 |
| 46 | NP_068800.1 | PGM5 | Phosphoglucomutase 5 | 3.0 |
| 47 | NP_001728.1 | C9 | Complement component 9 | 3.0 |
| 48 | NP_002453.1 | MX1 | Myxovirus resistance protein | 3.0 |
Table 2.
List of Downregulated Proteins Identified in Hepatocellular Carcinoma
| no. | RefSeq accession # | Gene symbol | Protein name | iTRAQ ratio (tumor/non- tumor) |
ratio from published microarray studiesa |
|---|---|---|---|---|---|
| 1 | NP_000522.3 | OTC | Ornithine carbamoyltransferase | 0.1 | N/A |
| 2 | NP_004112.1 | GGTLA1 | gamma-glutamyltransferase-like activity 1 | 0.1 | Increased |
| 3 | NP_000932.2 | POR | Cytochrome P450 reductase | 0.1 | Decreased |
| 4 | NP_059488.2 | CYP3A4 | Cytochrome P450, subfamily IIIA, 4 | 0.2 | N/A |
| 5 | NP_000215.1 | KRT18 | Keratin 18 | 0.2 | Decreased |
| 6 | NP_001905.1 | CYB5A | Cytochrome b-5 isoform 2 | 0.2 | N/A |
| 7 | NP_000660.1 | ADH1C | Class I alcohol dehydrogenase, gamma subunit | 0.2 | N/A |
| 8 | NP_002890.1 | RBP1 | Retinol binding protein 1, cellular | 0.2 | Decreased |
| 9 | NP_000839.1 | GSTM2 | Glutathione S-transferase M2 | 0.2 | N/A |
| 10 | NP_005850.1 | PURA | Purine-rich element binding protein A | 0.2 | N/A |
| 11 | NP_057058.2 | CRYL1 | Lambda-Crystallin | 0.2 | N/A |
| 12 | NP_000182.2 | HMGCL | 3-hydroxymethyl–3-methylglutaryl- Coenzyme A lyase | 0.2 | Decreased |
| 13 | NP_001866.2 | CPS1 | Carbamoyl-phosphate synthetase 1, mitochondrial | 0.2 | Increased |
| 14 | NP_976059.1 | BDH1 | 3-hydroxybutyrate dehydrogenase | 0.2 | Decreased |
| 15 | NP_002970.2 | SCP2 | Sterol carrier protein 2 isoform 1 proprotein | 0.2 | Decreased |
| 16 | NP_001598.1 | ACAA1 | Acetyl-Coenzyme A acyltransferase 1 | 0.2 | N/A |
| 17 | NP_000661.2 | ADH4 | Class II alcohol dehydrogenase 4 pi | 0.2 | Decreased |
| 18 | NP_001434.1 | FABP1 | Fatty acid binding protein 1, liver | 0.2 | Decreased |
| 19 | NP_000041.2 | ASS1 | Argininosuccinate synthetase | 0.2 | Decreased |
| 20 | NP_056348.2 | DAK | Dihydroxyacetone kinase 2 | 0.2 | N/A |
| 21 | NP_995317.1 | AKR1C2 | Aldoketo reductase family 1, C2 | 0.2 | N/A |
| 22 | NP_001900.1 | CTSD | Cathepsin D | 0.2 | N/A |
| 23 | NP_002264.1 | KRT8 | Keratin 8 | 0.2 | Decreased |
| 24 | NP_000552.2 | GSTM1 | Glutathione S-transferase M1 isoform 1 | 0.2 | Decreased |
| 25 | NP_000657.1 | ACY1 | Aminoacylase 1 | 0.2 | N/A |
| 26 | NP_000036.2 | ARG1 | Arginase, type I | 0.2 | Decreased |
| 27 | NP_003555.1 | TAGLN2 | Transgelin 2 | 0.2 | Increased |
| 28 | NP_002558.1 | PEBP1 | Prostatic binding protein | 0.2 | Decreased |
| 29 | NP_003303.2 | TST | Thiosulfate sulfurtransferase | 0.2 | Decreased |
| 30 | NP_001020366.1 | CES1 | Carboxylesterase 1 isoform a | 0.2 | Decreased |
| 31 | NP_001743.1 | CAT | Catalase | 0.2 | Decreased |
| 32 | NP_005509.1 | HMGCS2 | 3-hydroxy-3-methylglutaryl-Coenzyme A synthase 2 | 0.2 | N/A |
| 33 | NP_064695.2 | AKR1B10 | Aldo-keto reductase family 1, member B10 | 0.2 | N/A |
| 34 | NP_000420.1 | MAT1A | Methionine adenosyltransferase I, alpha | 0.2 | N/A |
| 35 | NP_008825.4 | FMO3 | Flavin containing monooxygenase 3 isoform 1 | 0.2 | N/A |
| 36 | NP_000680.2 | ALDH1A1 | Aldehyde dehydrogenase 1A1 | 0.2 | N/A |
| 37 | NP_004554.2 | PCK2 | Mitochondrial phosphoenolpyruvate carboxykinase 2 isoform 1 | 0.2 | Decreased |
| 38 | NP_001986.2 | ACSL1 | Acyl-coa synthetase long-chain family member 1 | 0.2 | Decreased |
| 39 | NP_005023.2 | PLS3 | Plastin 3 | 0.2 | N/A |
| 40 | NP_002141.1 | HPD | 4-hydroxyphenylpyruvate dioxygenase | 0.2 | Decreased |
| 41 | NP_061833.1 | GNMT | Glycine N-methyltransferase | 0.2 | N/A |
| 42 | NP_000681.2 | ALDH2 | Mitochondrial aldehyde dehydrogenase 2 | 0.2 | N/A |
| 43 | NP_060084.2 | BHMT2 | Betaine-homocysteine methyltransferase 2 | 0.2 | Decreased |
| 44 | NP_001026976.1 | ALDH3A2 | Aldehyde dehydrogenase 3A2 isoform 1 | 0.2 | N/A |
| 45 | NP_004083.2 | ECHS1 | Mitochondrial short-chain enoyl-coenzyme A hydratase 1 | 0.2 | Decreased |
| 46 | NP_002070.1 | GOT1 | Aspartate aminotransferase 1 | 0.3 | Decreased |
| 47 | NP_004365.1 | COX6C | Cytochrome c oxidase subunit vic proprotein | 0.3 | Increased |
| 48 | NP_000498.2 | FBP1 | Fructose-1,6-bisphosphatase 1 | 0.3 | Decreased |
| 49 | NP_057370.1 | DCXR | Dicarbonyl/L-xylulose reductase | 0.3 | N/A |
| 50 | NP_001473.1 | GATM | l-arginine:glycine amidinotransferase | 0.3 | Decreased |
| 51 | NP_006420.1 | CCT7 | Chaperonin containing TCP1, subunit 7 isoform a | 0.3 | N/A |
| 52 | NP_001944.1 | TYMP | Endothelial cell growth factor 1 (platelet-derived) | 0.3 | N/A |
| 53 | NP_005887.2 | IDH1 | Isocitrate dehydrogenase 1 (NADP+), soluble | 0.3 | N/A |
| 54 | NP_061978.5 | TNXB | Tenascin XB isoform 1 | 0.3 | N/A |
| 55 | NP_001893.2 | CTH | Cystathionase isoform 1 | 0.3 | Decreased |
| 56 | NP_003725.1 | AOC3 | Amine oxidase, copper containing 3 | 0.3 | Decreased |
| 57 | NP_000454.1 | UGT1A1 | UDP glycosyltransferase 1 family, A1 | 0.3 | N/A |
| 58 | NP_000895.1 | NQO2 | NAD(P)H dehydrogenase, quinone 2 | 0.3 | N/A |
| 59 | NP_001065.1 | UGT2B7 | UDP glycosyltransferase 2 family, B7 | 0.3 | Decreased |
| 60 | NP_000659.2 | ADH1B | Alcohol dehydrogenase 1B (class I), beta | 0.3 | Decreased |
| 61 | NP_003281.1 | TPM4 | Tropomyosin 4 | 0.3 | N/A |
| 62 | NP_000089.1 | CPT2 | Carnitine palmitoyltransferase II | 0.3 | Decreased |
| 63 | NP_037523.2 | DMGDH | Dimethylglycine dehydrogenase | 0.3 | N/A |
| 64 | NP_001009186.1 | CCT6A | Chaperonin containing TCP1, subunit 6A isoform b | 0.3 | N/A |
| 65 | NP_001809.2 | AKR1C4 | Aldo-keto reductase family 1, member C4 | 0.3 | N/A |
| 66 | NP_000026.2 | ALDOB | Aldolase B | 0.3 | Decreased |
| 67 | NP_002957.1 | S100A10 | S100 calcium-binding protein A10 | 0.3 | Increased |
| 68 | NP_004036.1 | ATOX1 | Antioxidant protein 1 | 0.3 | Increased |
| 69 | NP_612402.1 | REEP6 | Polyposis locus protein 1-like 1 | 0.3 | Decreased |
| 70 | NP_002188.1 | ACO1 | Aconitase 1 | 0.3 | Decreased |
| 71 | NP_000021.1 | AGXT | Alanine-glyoxylate aminotransferase | 0.3 | Decreased |
| 72 | NP_005262.1 | GLUD1 | Glutamate dehydrogenase 1 | 0.3 | Decreased |
| 73 | NP_004674.1 | RGN | Regucalcin | 0.3 | Decreased |
| 74 | NP_005557.1 | LDHA | Lactate dehydrogenase A | 0.3 | Decreased |
| 75 | NP_001073332.1 | DBI | Diazepam binding inhibitor isoform 2 | 0.3 | N/A |
| 76 | NP_002328.1 | LRPAP1 | Low density lipoprotein receptor-related protein associated 1 | 0.3 | N/A |
| 77 | NP_036344.1 | PTGR1 | NADP-dependent leukotriene B4 12-hydroxydehydrogenase | 0.3 | N/A |
| 78 | NP_009193.2 | PARK7 | DJ-1 protein | 0.3 | N/A |
| 79 | NP_116139.1 | ABHD14B | Abhydrolase domain containing 14B | 0.3 | N/A |
| 80 | NP_006102.1 | ACAA2 | Acetyl-coenzyme A acyltransferase 2 | 0.3 | Decreased |
| 81 | NP_060015.1 | HAO1 | Hydroxyacid oxidase 1 | 0.3 | Decreased |
| 82 | NP_000356.1 | TPI1 | Triosephosphate isomerase 1 | 0.3 | N/A |
| 83 | NP_001748.1 | CBR1 | Carbonyl reductase 1 | 0.3 | Decreased |
| 84 | NP_000764.1 | CYP2E1 | Cytochrome P450, family 2, subfamily E, 1 | 0.3 | N/A |
| 85 | NP_665683.1 | GSTA1 | Glutathione S-transferase A1 | 0.3 | N/A |
| 86 | NP_001350.1 | DECR1 | 2,4-dienoyl coa reductase 1 | 0.3 | Decreased |
| 87 | NP_004823.1 | GSTO1 | Glutathione-S-transferase omega 1 | 0.3 | Decreased |
| 88 | NP_055066.1 | SLC25A13 | Solute carrier family 25, member 13 (citrin) | 0.3 | N/A |
| 89 | NP_001975.1 | ESD | Esterase D/formylglutathione hydrolase | 0.3 | Decreased |
| 90 | NP_005947.2 | MTHFD1 | Methylenetetrahydrofolate dehydrogenase 1 | 0.3 | Decreased |
| 91 | NP_660202.2 | NAPRT1 | Nicotinate phosphoribosyltransferase domain containing 1 | 0.3 | N/A |
| 92 | NP_000166.2 | GPI | Glucose phosphate isomerase | 0.3 | Increased |
| 93 | NP_000111.1 | EPHX1 | Epoxide hydrolase 1, microsomal | 0.4 | Decreased |
Oncomine.
Validation of Quantitative Proteomics Results
A large number of differentially expressed proteins identified in this study have not previously been described in HCC (See table 1 for a list of upregulated proteins). To validate our findings using Western blot analysis, we selected 6 upregulated proteins encoded by FGL2, GC, FLNA, FHL1, FBN2, and TLN1 genes and 6 downregulated proteins encoded by OTC, PEBP1, FABP1, CPS1, ARG1 and EPHX1 genes (Figure 3). The results from Western blot analysis were in accordance with iTRAQ results in case of both upregulated and downregulated proteins.
Figure 3.
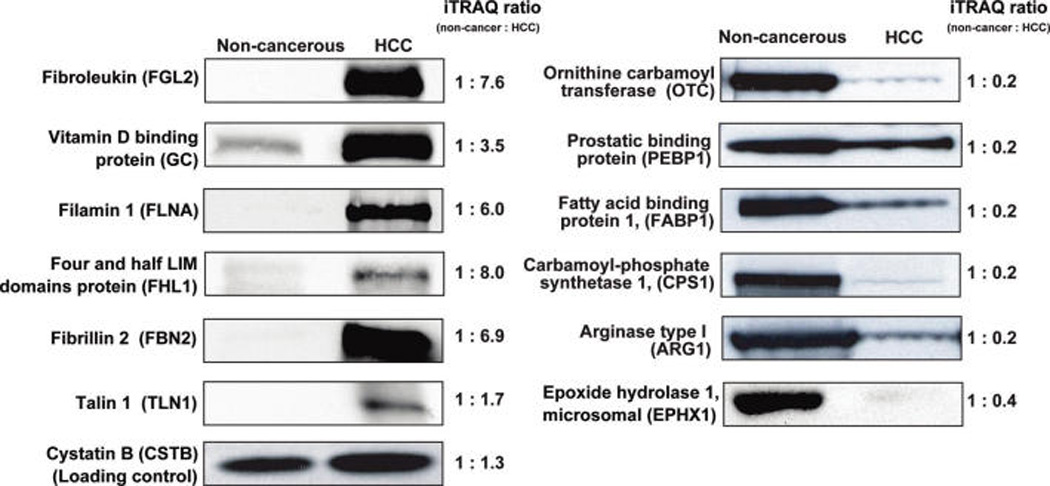
Validation of iTRAQ results by Western blotting. Liver homogenates used for the quantitative proteomic analysis were resolved by SDS-PAGE, subsequently electroblotted onto nitrocellulose membrane and probed with specific antibodies as indicated. The corresponding ratios from the iTRAQ labeling experiments are also shown for comparison.
The proteomics results were further validated in the same tissues by immunohistochemical labeling of three upregulated proteins (fibroleukin, myeloid-associated differentiation marker and vitamin-D binding protein) and one downregulated protein (ornithine carbamoyl transferase) (Figure 4). While fibroleukin showed a stromal staining pattern in cancer tissue, both myeloid-associated differentiation marker and vitamin-D binding protein showed a hepatocellular staining pattern. We observed loss of expression of ornithine carbamoyl transferase in cancer cells as compared to the corresponding normal.
Figure 4.
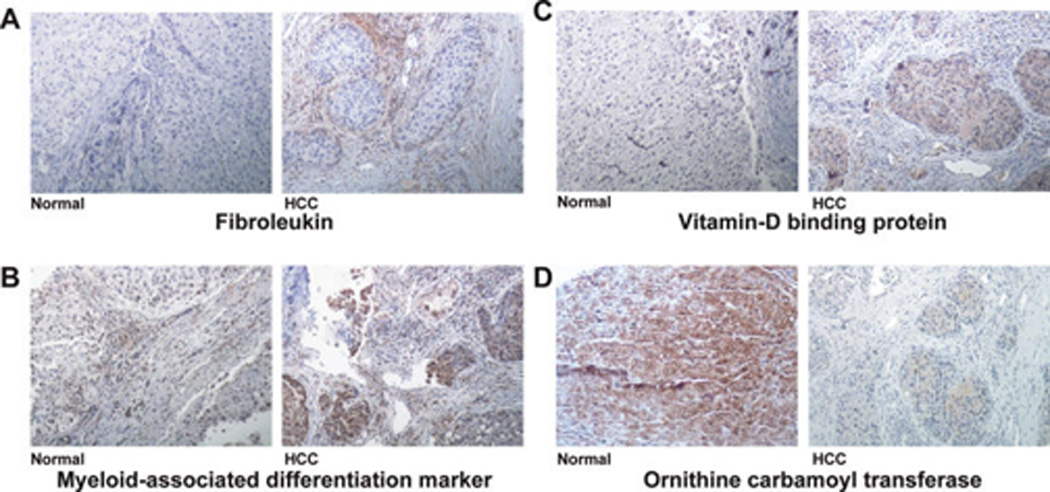
Confirmation of iTRAQ results using immunohistochemical labeling. Confirmation of upregulation of fibroleukin, myeloidassociated differentiation marker and vitamin D binding protein and downregulation of ornithine carbamoyl transferase in tissue samples used for iTRAQ analysis are shown. (A–D) Immunohistochemical labeling for fibroleukin, myeloid-associated differentiation marker, vitamin-D binding protein, and ornithine carbamoyl transferase, respectively (10× magnification).
Validation of Quantitative Proteomics Results Using Tissue Microarrays
Prevalence of overexpression of fibroleukin, myeloid-associated differentiation marker was determined by staining HCC tissue microarrays. Fibroleukin was overexpressed in 33/56 (59%) of HCC cases with the total score ranging from 2 to 5 whereas in 8/56 (14%) of non-HCC cases, the total score was 2 (Figure 5). Myeloid-associated differentiation marker protein showed distinct staining profile in cancers as compared to normal liver tissue. We identified myeloid-associated differentiation marker as a promising biomarker because antibodies against this protein stained 34 out of 53 HCC samples (64%) but in none of the noncancerous liver tissue (n = 20) (Figure 5). This protein showed 63% sensitivity and 100% specificity. Ornithine carbamoyl transferase (OTC), one of the underexpressed proteins in our proteomic screen was also screened using tissue microarrays. Expression of OTC was significantly decreased in 24/59 (42%) of HCC tissues, among them 15 cases showed negative staining, 8 sections showed less than 5% staining. Sixteen of remaining 25 HCC cases showed moderate decrease in expression of OTC. OTC expression was highly detectable (score >5) in all the normal cases analyzed (59/59).
Figure 5.
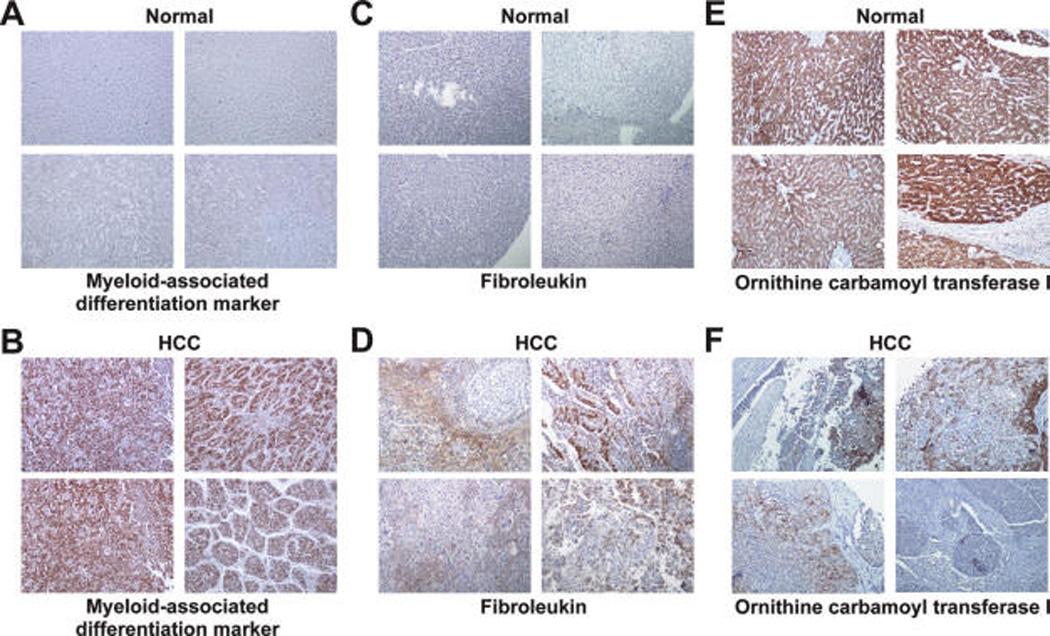
Validation of differential expression of myeloid-associated differentiation marker, fibroleukin, and ornithine carbamoyl transferase in HCC using tissue microarrays. IHC pictures (10× magnification) from four representative liver tissue sections, each of HCC and noncancerous tissues are shown. (A and B) IHC labeling for myeloid-associated differentiation marker in normal and HCC tissues, respectively. (C and D) IHC labeling for antifibroleukin in normal and HCC tissues, respectively. (E and F) IHC labeling for antiornithine carbamoyl transferase in normal and HCC tissues, respectively.
Discussion
Proteins Upregulated in HCC
This proteomics strategy was able to identify and quantitate differentially expressed proteins which are previously described in several HCC biomarker analysis studies. Among the proteins found to be upregulated in this study, eleven of them were previously shown to be associated with HCC (Table 3). SPARC like 1 (hevin) shares 60% sequence similarity with secreted protein acidic and rich in cysteine (SPARC) has been shown to be overexpressed in HCC.19 Although, SPARC like 1 is barely expressed in normal liver, significance of its overexpression in HCC is not well studied. Overexpression of tenascin C and type IV collagen induces a defective extracellular matrix pattern in hepatocellular cancer.20 Other major overexpressed proteins in HCC were vitronectin and fibronectin, which are involved in cell migration and adhesion in HCC along with other basement membrane proteins such as collagen IV and laminin.21–23
Table 3.
List of Identified Proteins That Were Previously Reported to Be Upregulated in Hepatocellular Carcinoma
| Gene symbol | Protein name | Reference | iTRAQ ratio in this study (tumor/nontumor) |
|
|---|---|---|---|---|
| 1. | SPARCL1 | SPARC-like 1 | Lau CP, et al.19 | 9.9 |
| 2. | FN1 | Fibronectin | Jagirdar, J et al.37 | 4.9 |
| 3. | VTN | Vitronectin | Kondoh N et al.38 | 4.5 |
| 4. | TNC | Tenascin C (Hexabrachion) | Zhao M, et al.20 | 4.3 |
| 5. | CAV1 | Caveolin 1 | Yerian LM, et al.39 | 4.2 |
| 6. | SOD3 | Superoxide dismutase 3,extracellular | Takashima M et al.40 | 4.2 |
| 7. | TF | Transferrin | Suzuki Y et al.41 | 3.9 |
| 8. | LAMC1 | Laminin gamma | Nakamura S et al.42 | 3.6 |
| 9. | HPX | Hemopexin | Darabi A et al.43 | 3.3 |
| 10. | C3 | Complement component 3 | Lee, IN et al.44 | 3.0 |
| 11. | COL6A1 | Collagen, type VI, alpha 1 | Zhao M, et al.20 | 3.2 |
The present study reveals many novel HCC associated proteins. Fibroleukin (also known as fibrinogen-like protein 2), a secreted protein similar to fibrinogen beta and gamma with procoagulant activity,24 was elevated 8-fold in HCC. Fibroleukin is associated with fibrin deposition and liver necrosis especially in human viral hepatitis.25 It is also implicated in allograft rejection and adjunctive therapy to treat allograft rejection.26 Vitamin D binding protein is involved in binding and transport of vitamin D and metabolites to target tissues and is found in blood, ascitic fluid, cerebrospinal fluid and bound to the cell surface. We found it to be upregulated 3.4-fold in HCC. Four and a half LIM domains 1 protein is a transcription factor and was upregulated 9.6 fold in HCC. It is widely expressed in skeletal muscle, liver and pancreas and has been implicated in differentiation, spreading and migration of muscle cells. To date, it has not been associated with any malignancy. Myeloidassociated differentiation marker is a protein with multiple transmembrane domains that was initially identified based on its high expression in myeloid progenitor cell lines. This protein has been shown to be upregulated during differentiation of hematopoietic cells or acute promyelocytic leukemia cells.27 In our study, this protein was overexpressed 5.6-fold. Milk fat globule EGF factor 8 (MFGE8), a known marker of breast cancer, is secreted from activated macrophages and specifically binds to apoptotic cells enhancing the engulfment of apoptotic cells by phagocytes. In our study this protein was upregulated 4.4-fold. Interferon-induced protein with tetratricopeptide repeats 1 (IFIT1) is an interferon-induced protein. Increase in IFIT1 levels have been reported following adenovirus infection.28 Moreover, IFIT1 is overexpressed in superficial basal cell carcinomas and cutaneous T-cell lymphomas.29 In our study, this protein was upregulated 8.0-fold.
Proteins Downregulated in HCC
With a stringent cutoff of 3-fold downregulation (i.e., <0.3 ratio in tumor versus nontumor), we found that 92 proteins were downregulated in tumor tissue compared to noncancerous tissue. The functional implication of these proteins in the aggravation of the disease processes can be inferred by the classification of these proteins into groups involved in important molecular and biological processes. More than 90% of the proteins are involved in metabolic processes and a majority of them have catalytic activity. A significant number of proteins (30%) were involved in transporter activity. A list of downregulated proteins is shown in Table 2 and Supplementary Table 1 (Supporting Information). Major downregulated proteins included cathepsin D (0.2 fold), lysosomal aspartyl protease (0.2 fold), fatty acid binding protein 1 (0.2 fold), an important intracellular liver protein involved in lipid transport, and calponin homology domain protein (0.2 fold), which has not been well studied. Many calcium binding proteins such as S100 calcium-binding protein A10, calreticulin, regucalcin, and calpain were also found to be downregulated in HCC. Changes in calcium binding proteins have been studied in diverse pathological conditions including cancer.30,31 Prostatic binding protein (5-fold decrease in HCC) is a raf kinase inhibitor protein; an earlier study showed that expression of this protein is decreased in both cirrhotic liver and HCC as compared to normal liver.32 Loss of raf kinase inhibitor protein expression was also found to be a key molecular event in colorectal cancer.33 Although the significance of these findings remains currently unclear, these results demonstrate that proteomic approaches could also provide an insight into global derangements in important metabolic processes that occur in HCC.
Investigation of our large set of downregulated proteins showed that all five enzymes of urea cycle were significantly downregulated in HCC (Figure 6). Urea cycle is an essential metabolic pathway of liver for detoxification of ammonia that is metabolized by 5 enzymes. The status of all five enzymes in the urea metabolic pathway, reconstructed from KEGG database (http://www.genome.jp/kegg/)34 is shown in Figure 6. Carbamoyl phosphate synthase (CPS1) and ornithine carbamoyl transferase are compartmentalized to mitochondria with CPS1 being the rate limiting enzyme in urea cycle. Overall, the expression level of carbamoyl phosphate synthase, ornithine carbamoyltransferase, argininosuccinate synthase, argininosuccinate lyase, and arginase were found to be dramatically reduced. An earlier study reported downregulation of CPS1 mRNA in HCC.35 To our knowledge, however, this is the first study describing the status of all the enzymes of urea metabolic pathway using a proteomics approach. Three of the enzymes in intermediary metabolism, associated with urea cycle: cytosolic malate dehydrogenase (0.7 fold), aspartate amino transferase (0.3 fold), and fumarase (0.8 fold) were also downregulated in HCC. Analysis of downregulated proteins in Oncomine36 (a cancer profiling database) shows a similar downregulation at the mRNA level in cancer versus noncancer (Table 2). Western blot analysis of CPS1, OTC, and arginase correlated with iTRAQ data. The immunohistochemical analysis of one of the urea cycle enzyme, ornithine carbamoyl transferase indicates the urea cycle enzymes are substantially downregulated across HCC samples. We have also observed similar results in gene expression studies using microarrays from the public repositories. This may be of significant interest, however further studies are needed to address the role of downregulation of urea cycle in HCC.
Figure 6.
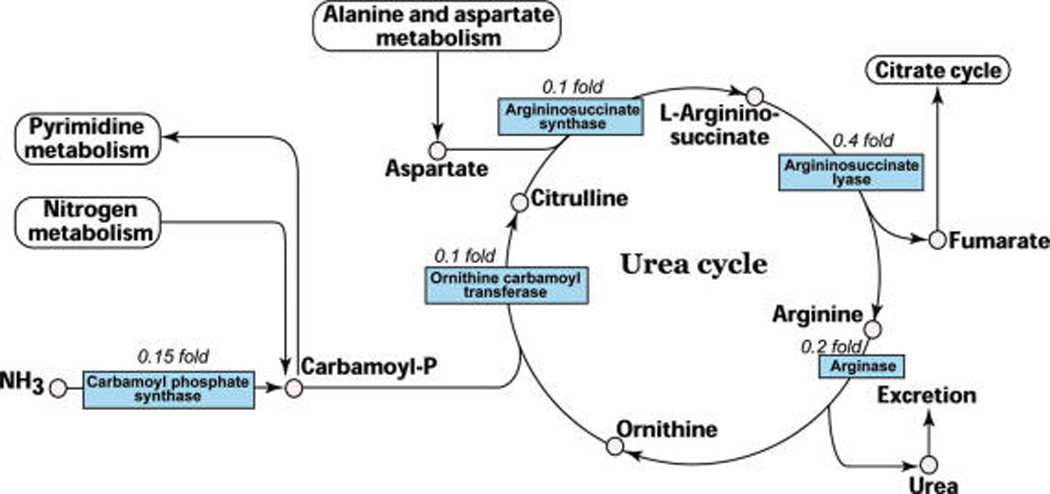
Downregulation of urea cycle enzymes in HCC. The five enzymes of urea cycle were found to be downregulated in the current study. The fold changes observed in iTRAQ experiment are indicated. The urea cycle pathway was redrawn from KEGG database.34
Early diagnosis of HCC improves prognosis, but currently available biochemical markers or imaging modalities either lack adequate sensitivity or specificity, especially in the presence of cirrhosis. Due to the complexity of the disease, a single, reliable biomarker is unlikely to be identified for sensitive and specific diagnosis of HCC. Quantitative proteomic profiling experiments offer an effective alternative for identifying differentially expressed proteins as potential biomarkers. In this study, we have identified many upregulated and downregulated proteins in HCC that may have pathological relevance as well as diagnostic potential. Studies are in progress to identify these proteins in the sera of patients with HCC. To our knowledge, this is the first large-scale quantitative proteomic profiling of HCC tissue revealing several novel and known upregulated proteins. Importantly, we were able to identify many of the proteins that have been previously reported to be upregulated in HCC, corroborating earlier findings of differentially expressed proteins. Overall, this study emphasizes that quantitative proteomics technology may help us to identify novel markers for early diagnosis of HCC as well as elucidate molecular mechanisms of HCC pathogenesis.
Supplementary Material
Footnotes
Supporting Information Available: Supplemental Table 1. This material is available free of charge via the Internet at http://pubs.acs.org.
References
- 1.El-Serag HB. Gastroenterology. 2004;127(5) Suppl 1:S27–S34. doi: 10.1053/j.gastro.2004.09.013. [DOI] [PubMed] [Google Scholar]
- 2.Roberts LR, Gores GJ. Expert Opin. Emerg. Drugs. 2006;11(3):469–487. doi: 10.1517/14728214.11.3.469. [DOI] [PubMed] [Google Scholar]
- 3.Jemal A, Murray T, Ward E, Samuels A, Tiwari RC, Ghafoor A, Feuer EJ, Thun MJ. CA Cancer J. Clin. 2005;55(1):10–30. doi: 10.3322/canjclin.55.1.10. [DOI] [PubMed] [Google Scholar]
- 4.Sterling RK, Jeffers L, Gordon F, Sherman M, Venook AP, Reddy KR, Satomura S, Schwartz ME. Am. J. Gastroenterol. 2007;102(10):2196–2205. doi: 10.1111/j.1572-0241.2007.01405.x. [DOI] [PubMed] [Google Scholar]
- 5.Fujiyama S, Morishita T, Hashiguchi O, Sato T. Cancer. 1988;61(8):1621–1628. doi: 10.1002/1097-0142(19880415)61:8<1621::aid-cncr2820610820>3.0.co;2-c. [DOI] [PubMed] [Google Scholar]
- 6.Lemmer ER, Friedman SL, Llovet JM. Semin. Liver Dis. 2006;26(4):373–384. doi: 10.1055/s-2006-951604. [DOI] [PubMed] [Google Scholar]
- 7.Chignard N, Shang S, Wang H, Marrero J, Brechot C, Hanash S, Beretta L. Gastroenterology. 2006;130(7):2010–2022. doi: 10.1053/j.gastro.2006.02.058. [DOI] [PubMed] [Google Scholar]
- 8.Ward DG, Cheng Y, N’Kontchou G, Thar TT, Barget N, Wei W, Martin A, Beaugrand M, Johnson PJ. Br. J. Cancer. 2006;95(10):1379–1383. doi: 10.1038/sj.bjc.6603429. [DOI] [PMC free article] [PubMed] [Google Scholar]
- 9.Schwegler EE, Cazares L, Steel LF, Adam BL, Johnson DA, Semmes OJ, Block TM, Marrero JA, Drake RR. Hepatology. 2005;41(3):634–642. doi: 10.1002/hep.20577. [DOI] [PubMed] [Google Scholar]
- 10.Paradis V, Degos F, Dargere D, Pham N, Belghiti J, Degott C, Janeau JL, Bezeaud A, Delforge D, Cubizolles M, Laurendeau I, Bedossa P. Hepatology. 2005;41(1):40–47. doi: 10.1002/hep.20505. [DOI] [PubMed] [Google Scholar]
- 11.Melanson JE, Avery SL, Pinto DM. Proteomics. 2006;6(16):4466–4474. doi: 10.1002/pmic.200600112. [DOI] [PubMed] [Google Scholar]
- 12.Streckfus CF, Mayorga-Wark O, Arreola D, Edwards C, Bigler L, Dubinsky WP. Cancer Invest. 2008;26(2):159–167. doi: 10.1080/07357900701783883. [DOI] [PubMed] [Google Scholar]
- 13.Glen A, Gan CS, Hamdy FC, Eaton CL, Cross SS, Catto JW, Wright PC, Rehman I. J. Proteome Res. 2008;7(3):897–907. doi: 10.1021/pr070378x. [DOI] [PubMed] [Google Scholar]
- 14.Griffiths SD, Burthem J, Unwin RD, Holyoake TL, Melo JV, Lucas GS, Whetton AD. Mol Biotechnol. 2007;36(2):81–89. doi: 10.1007/s12033-007-0005-5. [DOI] [PubMed] [Google Scholar]
- 15.Chen Y, Choong LY, Lin Q, Philp R, Wong CH, Ang BK, Tan YL, Loh MC, Hew CL, Shah N, Druker BJ, Chong PK, Lim YP. Mol. Cell. Proteomics. 2007;6(12):2072–2087. doi: 10.1074/mcp.M700395-MCP200. [DOI] [PubMed] [Google Scholar]
- 16.Carr S, Aebersold R, Baldwin M, Burlingame A, Clauser K, Nesvizhskii A. Mol. Cell. Proteomics. 2004;3(6):531–533. doi: 10.1074/mcp.T400006-MCP200. [DOI] [PubMed] [Google Scholar]
- 17.Kannangai R, Sahin F, Adegbola O, Ashfaq R, Su GH, Torbenson M. Mod. Pathol. 2004;17(6):653–659. doi: 10.1038/modpathol.3800102. [DOI] [PubMed] [Google Scholar]
- 18.Mathivanan S, Ahmed M, Ahn NG, et al. Nat. Biotechnol. 2008;26(2):164–167. doi: 10.1038/nbt0208-164. [DOI] [PubMed] [Google Scholar]
- 19.Lau CP, Poon RT, Cheung ST, Yu WC, Fan ST. J. Pathol. 2006;210(4):459–468. doi: 10.1002/path.2068. [DOI] [PubMed] [Google Scholar]
- 20.Zhao M, Laissue JA, Zimmermann A. Histol. Histopatho.l. 1996;11(2):323–333. [PubMed] [Google Scholar]
- 21.Tian B, Li Y, Ji XN, Chen J, Xue Q, Ye SL, Liu YK, Tang ZY. J. Cancer Res. Clin. Oncol. 2005;131(2):80–86. doi: 10.1007/s00432-004-0614-3. [DOI] [PubMed] [Google Scholar]
- 22.Torbenson M, Wang J, Choti M, Ashfaq R, Maitra A, Wilentz RE, Boitnott J. Mod. Pathol. 2002;15(8):826–830. doi: 10.1097/01.MP.0000024257.83046.7C. [DOI] [PubMed] [Google Scholar]
- 23.Bilbao R, Bustos M, Alzuguren P, Pajares MJ, Drozdzik M, Qian C, Prieto J. Gene Ther. 2000;7(21):1824–1832. doi: 10.1038/sj.gt.3301312. [DOI] [PubMed] [Google Scholar]
- 24.Yuwaraj S, Ding J, Liu M, Marsden PA, Levy GA. Genomics. 2001;71(3):330–338. doi: 10.1006/geno.2000.6444. [DOI] [PubMed] [Google Scholar]
- 25.Marsden PA, Ning Q, Fung LS, Luo X, Chen Y, Mendicino M, Ghanekar A, Scott JA, Miller T, Chan CW, Chan MW, He W, Gorczynski RM, Grant DR, Clark DA, Phillips MJ, Levy GA. J. Clin. Invest. 2003;112(1):58–66. doi: 10.1172/JCI18114. [DOI] [PMC free article] [PubMed] [Google Scholar]
- 26.Ning Q, Sun Y, Han M, Zhang L, Zhu C, Zhang W, Guo H, Li J, Yan W, Gong F, Chen Z, He W, Koscik C, Smith R, Gorczynski R, Levy G, Luo X. J. Immunol. 2005;174(11):7403–7411. doi: 10.4049/jimmunol.174.11.7403. [DOI] [PubMed] [Google Scholar]
- 27.Cui W, Yu L, He H, Chu Y, Gao J, Wan B, Tang L, Zhao S. Mol. Biol. Rep. 2001;28(3):123–138. doi: 10.1023/a:1015288412047. [DOI] [PubMed] [Google Scholar]
- 28.Dorn A, Zhao H, Granberg F, Hosel M, Webb D, Svensson C, Pettersson U, Doerfler W. J. Virol. 2005;79(4):2404–2412. doi: 10.1128/JVI.79.4.2404-2412.2005. [DOI] [PMC free article] [PubMed] [Google Scholar]
- 29.Urosevic M, Dummer R, Conrad C, Beyeler M, Laine E, Burg G, Gilliet M. J. Natl. Cancer Inst. 2005;97(15):1143–1153. doi: 10.1093/jnci/dji207. [DOI] [PubMed] [Google Scholar]
- 30.Emberley ED, Murphy LC, Watson PH. Biochem. Cell Biol. 2004;82(4):508–515. doi: 10.1139/o04-052. [DOI] [PubMed] [Google Scholar]
- 31.Makino R, Yamaguchi M. Mol. Cell. Biochem. 1996;155(1):85–90. doi: 10.1007/BF00714337. [DOI] [PubMed] [Google Scholar]
- 32.Schuierer MM, Bataille F, Weiss TS, Hellerbrand C, Bosserhoff AK. Oncol. Rep. 2006;16(3):451–456. [PubMed] [Google Scholar]
- 33.Al-Mulla F, Hagan S, Behbehani AI, Bitar MS, George SS, Going JJ, Garcia JJ, Scott L, Fyfe N, Murray GI, Kolch W. J Clin. Oncol. 2006;24(36):5672–5679. doi: 10.1200/JCO.2006.07.5499. [DOI] [PubMed] [Google Scholar]
- 34.Kanehisa M, Goto S, Hattori M, Aoki-Kinoshita KF, Itoh M, Kawashima S, Katayama T, Araki M, Hirakawa M. Nucleic Acids Res. 2006;34:D354–D357. doi: 10.1093/nar/gkj102. [DOI] [PMC free article] [PubMed] [Google Scholar]
- 35.Kinoshita M, Miyata M. Hepatoloev. 2002;36(2):433–438. doi: 10.1053/jhep.2002.34851. [DOI] [PubMed] [Google Scholar]
- 36.Rhodes DR, Kalyana-Sundaram S, Mahavisno V, Varambally R, Yu J, Briggs BB, Barrette TR, Anstet MJ, Kincead-Beal C, Kulkarni P, Varambally S, Ghosh D, Chinnaiyan AM. Neoplasia. 2007;9(2):166–180. doi: 10.1593/neo.07112. [DOI] [PMC free article] [PubMed] [Google Scholar]
- 37.Jagirdar J, Ishak KG, Colombo M, Brambilla C, Paronetto F. Cancer. 1985;56(7):1643–1648. doi: 10.1002/1097-0142(19851001)56:7<1643::aid-cncr2820560730>3.0.co;2-o. [DOI] [PubMed] [Google Scholar]
- 38.Kondoh N, Wakatsuki T, Ryo A, Hada A, Aihara T, Horiuchi S, Goseki N, Matsubara O, Takenaka K, Shichita M, Tanaka K, Shuda M, Yamamoto M. Cancer Res. 1999;59(19):4990–4996. [PubMed] [Google Scholar]
- 39.Yerian LM, Anders RA, Tretiakova M, Hart J. Am. J. Surg. Pathol. 2004;28(3):357–364. doi: 10.1097/00000478-200403000-00008. [DOI] [PubMed] [Google Scholar]
- 40.Takashima M, Kuramitsu Y, Yokoyama Y, Iizuka N, Harada T, Fujimoto M, Sakaida I, Okita K, Oka M, Nakamura K. Proteomics. 2006;6(13):3894–3900. doi: 10.1002/pmic.200500346. [DOI] [PubMed] [Google Scholar]
- 41.Suzuki Y, Aoyagi Y, Mori S, Suda T, Naitoh A, Isokawa O, Yanagi M, Igarashi H, Asakura H. J. Gastroenterol. Hepatol. 1996;11(4):358–365. doi: 10.1111/j.1440-1746.1996.tb01384.x. [DOI] [PubMed] [Google Scholar]
- 42.Nakamura S, Muro H, Suzuki S, Sakaguchi T, Konno H, Baba S, Syed AS. Hepatology. 1997;26(2):407–415. doi: 10.1002/hep.510260222. [DOI] [PubMed] [Google Scholar]
- 43.Darabi A, Gross S, Watabe M, Malafa M, Watabe K. Cancer Lett. 1995;95(1–2):153–159. doi: 10.1016/0304-3835(95)03881-v. [DOI] [PubMed] [Google Scholar]
- 44.Lee IN, Chen CH, Sheu JC, Lee HS, Huang GT, Chen DS, Yu CY, Wen CL, Lu FJ, Chow LP. Proteomics. 2006;6(9):2865–2873. doi: 10.1002/pmic.200500488. [DOI] [PubMed] [Google Scholar]
Associated Data
This section collects any data citations, data availability statements, or supplementary materials included in this article.