

Abstract
Aromatase inhibitors, such as letrozole, have become the first-line treatment for postmenopausal women with estrogen-dependent breast cancer. However, acquired resistance remains a major clinical obstacle. Previous studies demonstrated constitutive activation of the MAPK signaling, overexpression of HER2, and down-regulation of aromatase and ERα in letrozole-resistant breast cancer cells. Given the complex signaling network involved in letrozole-refractory breast cancer and the lack of effective treatment for hormone resistance, further investigation of aromatase inhibitor resistance by a novel systems biology approach may reveal previously unconsidered molecular changes that could be utilized as therapeutic targets. This study was undertaken to characterize for the first time global proteomic alterations occurring in a letrozole-resistant cell line. A quantitative proteomic analysis of the whole cell lysates of LTLT-Ca (resistant) versus AC-1 cells (sensitive) was performed to identify significant protein expression changes. A total of 1743 proteins were identified and quantified, of which 411 were significantly up-regulated and 452 significantly down-regulated (p < 0.05, fold change > 1.20). Bioinformatics analysis revealed that acquired letrozole resistance is associated with a hormone-independent, more aggressive phenotype. LTLT-Ca cells exhibited 84% and 138% increase in migration and invasion compared with the control cells. The ROCK inhibitor partially abrogated the enhanced migration and invasion of the letrozole-resistant cells. Flow cytometric analyses also demonstrated an increase in vimentin and twist expression in letrozole-resistance cells, suggesting an onset of epithelial to mesenchymal transition (EMT). Moreover, targeted gene expression arrays confirmed a 28-fold and sixfold up-regulation of EGFR and HER2, respectively, whereas ERα and pS2 were dramatically reduced by 28-fold and 1100-fold, respectively. Taken together, our study revealed global proteomic signatures of a letrozole-resistant cell line associated with hormone independence, enhanced cell motility, EMT and the potential values of several altered proteins as novel prognostic markers or therapeutic targets for letrozole resistant breast cancer.
Aromatase inhibitors (AIs)1 have increasingly been used to treat ER positive breast cancer in postmenopausal women as adjuvant or neoadjuvant therapy (1, 2). AIs block estrogen production by inhibiting the aromatization reaction that converts androgens to estrogens, resulting in the remission of estrogen dependent breast tumors. However, acquired resistance occurs in the majority of patients after several years of AI treatment, and this may ultimately lead to eventual relapse of the disease (3, 4). Therefore it is necessary to better understand the resistance mechanisms to abrogate or delay the onset of AI resistance. Numerous studies have used in vitro and in vivo models to dissect the adaptive signaling events in the development of AI resistance in breast cancer (5, 6). The in vitro long term estrogen deprivation (LTED) model has been proposed to represent AI resistance in breast cancer that also showed cross-resistance to other hormonal treatment (7). However, the LTEDaro lines did not cluster with the AI-resistant lines (8). Alternatively, in vivo models using cells derived from mouse xenografts have been widely used to study the mechanism of AI resistance and potential therapeutic strategies (3, 9–11). Notably, ER expression levels were up-regulated in the LTED model (7) but down-regulated in the letrozole resistant breast cancer cells (12, 13).
In in vitro experiments, it has been found that although MCF-7 and T47D (both ER+ breast cancer cell lines) express detectable levels of aromatase, the enzymatic activity is rather low for experimental studies of the action of aromatase inhibitors and subsequent resistance to AIs. It is recognized that the aromatase activity in MCF-7aro cells is significantly higher than that in typical breast cancer and surrounding adipose stromal cells. However, the aromatase activity in breast tumors can be elevated in situ by cytokines, cAMP, and cancer-promoting agents which stimulate protein kinase C activity (14–17). Thus these MCF-7 and AC1 cell lines are appropriate models for studying the balance between the androgenic and estrogenic effect in breast cancer as they express significant levels of AR and ER. Clinically, it has been observed that ∼66% of breast carcinomas contain aromatase (the rate-limiting enzyme responsible for estrogen biosynthesis), and the estrogen synthesized in situ has a role in stimulating the tumor (18, 19). In breast, ovarian, uterine, and prostate cancer, activation of PI.3/II leads to the overexpression of aromatase within the tissues themselves, and this has been associated with an increase in tumor growth (20, 21).
In the mouse xenograft model established in Brodie's laboratory, MCF-7 cells were stably transfected with the human aromatase gene and grown in ovariectomized female nude mice treated with letrozole for over 56 weeks (12, 22). Subsequent studies of these long-term letrozole treated (LTLT-Ca) cells isolated from these tumors confirmed the up-regulation of Her2/MAPK signaling cascade and the p160 coactivator, amplified in breast cancer 1 (AIB1), as an adaptive survival pathway (5, 12, 13, 23). Inhibition of MAPK led to reduced cell proliferation and restoration of ER expression, implicating the occurrence of crosstalk between ER and growth factor receptor signaling. Moreover, inhibition of Her2 restored the sensitivity of LTLT-Ca cells to letrozole (10, 23). In the genome-wide analysis of several hormone resistant cell lines, elevated DNA replication, recombination, repair function, cell cycle control, and the pyrimidine metabolism pathway were also found as an enhanced survival mechanism in the resistant cells (6, 7). Given the complex signaling network involved in AI refractory breast cancer and the lack of effective treatment for hormone resistance, further investigation of AI resistance by a global proteomics-based systems biology approach may reveal previously unconsidered molecular changes that could be used as therapeutic targets. Therefore, the objective of this study is to characterize global proteomic alterations occurring in the letrozole resistant cell line, originating from the Brodie laboratory (12).
Here we have performed a quantitative proteomic analysis of the whole cell lysis samples of LTLT-Ca against the letrozole sensitive control cell line, AC-1, using a gel-free approach. To achieve relative quantitation of proteins we used a tandem mass tag labeling technique where each sample is triply labeled for analytical precision. Fractionation and nanoflow reverse phase HPLC were employed in combination with a high-resolution tandem mass spectrometer for peptide separation and identification. Identified protein markers were then analyzed by bioinformatics tools to gain insight into global adaptive signaling modulations as a result of acquired resistance to letrozole.
MATERIALS AND METHODS
Cell Culture
Human AC-1 breast cancer cells (MCF-7 cells stably transfected with the human aromatase gene) were kindly provided by Dr. Angela Brodie and were cultured in 75-cm2 flasks in DMEM (Invitrogen) supplemented with 5% fetal bovine serum (FBS), penicillin-streptomycin, antimycotic-antibiotic (10,000 U/ml penicillin G sodium; 10,000 μg/ml streptomycin sulfate; and 25 μg/ml amphotericin B (Fungizone), and 7.5 μg/ml geneticin (Invitrogen, Carlsbad, CA). Human LTLT-Ca cells (long-term letrozole treated AC-1 cells) were generously provided by Dr. Angela Brodie and were cultured in 75-cm2 flasks in phenol red-free IMEM (Invitrogen) supplemented with 5% charcoal-stripped fetal bovine serum (CS-FBS), penicillin-streptomycin, antimycotic-antibiotic (10,000 U/ml penicillin G sodium; 10,000 μg/ml streptomycin sulfate; and 25 μg/ml amphotericin B (Fungizone), 7.5 μg/ml geneticin (Invitrogen) and 1 μm letrozole (Sigma). The culture flasks were maintained in a tissue culture incubator in a humidified atmosphere of 5% CO2 and 95% air at 37 °C. The LTLT-Ca cells were isolated from tumors of aromatase transfected MCF-7 cells grown in ovariectomized nude mice following 56 weeks of treatment with letrozole. After long-term letrozole treatment, the tumors acquired the ability to proliferate in the presence of the drug. Tumors were then removed and grown in culture in the presence of letrozole (12).
Gene Superarrays
AC-1 cells were seeded into 75-cm2 flasks in DMEM supplemented with 5% FBS and LTLT-Ca cells were seeded into 75-cm2 flasks in phenol red-free IMEM supplemented with 5% CS-FBS. Total RNA was extracted from untreated AC-1 and LTLT-Ca cells. Each array profiles the expression of a panel of 84 genes. For each array, 4 μg of RNA was reverse-transcribed into cDNA in the presence of gene-specific oligonucleotide primers as described in the manufacturer's protocol. cDNA template was mixed with the appropriate ready-to-use PCR master mix. Equal volumes were measured (in aliquots) into each well of the same plate, and then the real-time PCR cycling program was run. Quantitative RT-PCR was performed using the manufacturer's protocols for the Human Breast Cancer and Estrogen Receptor Signaling RT2 Profiler PCR Array (Qiagen). Relative gene expressions were calculated by using the 2−ΔΔCt method, in which Ct indicates the fractional cycle number where the fluorescent signal reaches detection threshold. The “delta-delta” method (described by Pfaffl, 2001) uses the normalized ΔCt value of each sample, calculated using a total of five endogenous control genes (18S rRNA, HPRT1, RPL13A, GAPDH, and ACTB) (24). -Fold change values are then presented as average -fold change = 2−(average −ΔΔCt) for genes in treated relative to control samples. Clinical variables were characterized using descriptive statistics, and the statistical significance of differences in gene expression between groups was calculated using Student's t test.
Cell Lysis
LTLT-Ca and AC-1 control cells were cultured to 80% confluence in the medium as described above, and washed with cold Hank's Buffered Salt Solution (HBSS) for 3 times, then collected with a cell scraper. Nonidet P-40 cell lysis buffer (Invitrogen) containing an additional 1 mm of phenylmethylsulfonyl fluoride (PMSF) and protease inhibitor mixture (Sigma) was used to extract total cellular proteins. The concentration of proteins was measured with BCA assay (Pierce Biotechnology, Rockford, IL). The cell lysis was stored at −80 °C before further processing.
Trypsin Digestion
Protein samples were digested with sequencing grade modified trypsin (Promega Corp) according to manufacturer's instructions. Briefly, to aliquots of 100 μg of protein sample was added 45 μl of 200 mm triethyl ammonium bicarbonate (TEAB) and the final volume was adjusted to 100 μl with ultrapure water. Five microliters of 200 mm Tris (2-carboxyethyl) phosphine (TCEP) was added and the resulting mixture was incubated for 1 h, then 5 μl of 375 mm iodoacetamide was added and the mixture was incubated for 30 min without light. After incubation, 1 ml of prechilled acetone was added and the precipitation was allowed to proceed overnight. The acetone-precipitated protein pellets were suspended with 100 μl of 200 mm TEAB and 2.5 μg of trypsin was added to digest the sample overnight at 37 °C.
Tandem Mass Tags (TMT) Labeling
Tandem mass tags TMT6 (Thermo Scientific) with different molecular weights (126 ∼ 131 Da) were applied as isobaric tags for relative and absolute quantification. According to the manufacturer's protocols, the digested samples were individually labeled with TMT6 reagents for 1 h as follows: three 100-μg aliquots of digested peptides from AC-1 control cells were each labeled with a different isobaric tag (TMT126, 127, and 128, respectively). Likewise, 100-μg aliquots of peptides from LTLT-Ca cells were labeled with TMT129, 130, and 131 mass tags, respectively. The labeling reaction was quenched with 5% hydroxylamine. Finally, the six labeled peptide aliquots were combined for subsequent fractionation.
Fractionation of Labeled Peptide Mixture Using a Strong Cation Exchange Column
The combined TMT labeled peptide mixture was fractionated with a strong cation exchange column (SCX) (Thermo Scientific) on a Shimadzu 2010 HPLC equipped with a UV detector (Shimadzu, Columbus, MD). Mobile phase consists of buffer A (5 mm KH2PO4, 25% acetonitrile, pH 2.8) and buffer B (buffer A plus 350 mm KCl). The column was equilibrated with Buffer A for 30 min before sample injection. The mobile phase gradient was set as follows at a flow rate of 1.0 ml/min: (a) 0 to 10 min: 0% buffer B; (b) 10 to 40 min: 0% to 25% Buffer B, (c) 40 to 45 min: 25% to 100% Buffer B; (d) 45 to 50 min: 100% buffer B; (e) 50 to 60 min: 100% to 0% buffer B; (f) 60 min to 90 min: 0% buffer B. A total of 60 fractions were initially collected, lyophilized and combined into 15 final fractions based on SCX chromatographic peaks.
Desalination of Fractionated Samples
A C18 solid-phase extraction (SPE) column (Hyper-Sep SPE Columns, Thermo-Fisher Scientific) was used to desalt all collected fractions. The combined 15 fractions were each adjusted to 1-ml final volume containing 0.25% (v/v in water) trifluoroacetic acid (TFA, Sigma). The C18 SPE columns were conditioned before use by filling them with 1 ml acetonitrile and allowing the solvent to pass through the column slowly (∼3 min). The columns were then rinsed three times with 1 ml 0.25% (v/v in water) TFA solution. The fractions were loaded on to the top of the SPE cartridge and allowed to elute slowly. Columns were washed four times with 1-ml 0.25% TFA aliquots before the peptides were eluted with 3 × 400 μl of 80% acetonitrile/0.1% formic acid (aqueous).
LC-MS/MS Analysis on LTQ-Orbitrap
Peptides were analyzed on an LTQ-Orbitrap XL instrument (Thermo-Fisher Scientific) coupled to an Ultimate 3000 Dionex nanoflow LC system (Dionex, Sunnyvale, CA). High mass resolution was used for peptide identification and high energy collision dissociation (HCD) was employed for reporter ion quantification. The RP-LC system consisted of a peptide Cap-Trap cartridge (0.5 × 2 mm) (Michrom BioResources, Auburn, CA) and a prepacked BioBasic C18 PicoFrit analytical column (75 μm i.d. × 15 cm length, New Objective, Woburn, MA) fitted with a FortisTip emitter tip. Samples were loaded onto the trap cartridge and washed with mobile phase A (98% H2O, 2% acetonitrile and 0.1% formic acid) for concentration and desalting. Subsequently, peptides were eluted over 180 min from the analytical column via the trap cartridge using a linear gradient of 6–100% mobile phase B (20% H2O, 80% acetonitrile and 0.1% formic acid) at a flow-rate of 0.3 μl/min using the following gradient: 6% B for 5 min; 6–60% B for 125 min; 60–100% B for 5 min; hold at 100% B for 5 min; 100–6% B in 2 min; hold at 6% B for 38 min.
The LTQ-Orbitrap tandem mass spectrometer was operated in a data-dependent mode. Briefly, each full MS scan (60,000 resolving power) was followed by six MS/MS scans where the three most abundant molecular ions were dynamically selected and fragmented by collision-induced dissociation (CID) using a normalized collision energy of 35%, and the same three molecular ions were also scanned three times by HCD-MS2 with collision energy of 45%. MS scans were acquired in profile mode and MS/MS scans in centroid mode. LTQ-Orbitrap settings were as follows: spray voltage 2.0 kV, 1 microscan for MS1 scans at 60,000 resolution (fwhm at m/z 400), microscans for MS2 at 7500 resolution (fwhm at m/z 400); full MS mass range, m/z 400–1400; MS/MS mass range, m/z 100–2000. The “FT master scan preview mode,” “Charge state screening,” “Monoisotopic precursor selection,” and “Charge state rejection” were enabled so that only the 2+, 3+, and 4+ ions were selected and fragmented by CID and HCD.
Database Search and TMT Quantification
The protein search algorithm used was Mascot v2.3.01 (Matrix Science, Boston, Ma). Mascot format files were generated by the Proteome Discoverer 1.2 software (Thermo-Fisher Scientific) using the following criteria: database, IPI_Human.fasta.v3.77 (containing 89,422 entries and concatenated with the reversed versions of all sequences.); enzyme, trypsin; maximum missed cleavages, 2; Static modifications, carbamidomethylation (+57 Da), N-terminal TMT6plex (+229 Da), lysyl TMT6plex (+229 Da). Dynamic modifications, N-terminal Clnpyro- Glu (+17Da); methionine oxidation (+16 Da); STY phosphorylation (+80 Da); Precursor mass tolerance was set at 20 ppm; fragment match tolerance was set at 0.8 Da. Peptides reported by the search engine were accepted only if they met the false discovery rate of p < 0.05 (target decoy database), a Mascot ion score ≥30 for peptide identifications was required. For TMT quantification, the ratios of TMT reporter ion abundances in MS/MS spectra generated by HCD (up to six reporter ions ranging from m/z 126.12 to m/z 131.14) from raw data sets were used to calculate fold changes in proteins between control and treatment.
Gel Electrophoresis and Western Blot Analysis
Equal amounts of total proteins (50 μg) was subjected to sodium dodecyl sulfate-polyacrylamide gel electrophoresis (SDS-PAGE) using the Mini-PROTEAN Tetra Cell electrophoresis module assembly (Bio-Rad, Hercules, CA, USA) and transferred at 4 °C overnight to nitrocellulose membranes (Bio-Rad). Immunodetections were performed using anti-rabbit antibodies against human ERα (Santa Cruz Biotechnology, Santa Cruz, CA), human integrin alpha V (Santa Cruz Biotechnology), human aromatase (Santa Cruz Biotechnology, Santa Cruz, CA), fascin (Abcam, Cambridge, MA) and GADPH (Sigma-Aldrich, St. Louis, MO). Immunoreative bands were visualized using the enhanced chemiluminescence detection reagents according to the manufacturer's instructions and quantitated by densitometry using ImageJ software.
Cell Migration and Invasion
Matrigel (BD Biosciences, San Jose, CA) solution was prepared and diluted into serum-free media and used to coat the inner chamber of a 24-well ThinCertTM cell culture inserts (for cell invasion assays only). The insert was incubated and washed with serum-free media. The cells were seeded into a 25 cm2 flask with appropriate media. On the following day, the cells were trypsinized, centrifuged and resuspended in serum-free media. Afterward 250 μl of 2.5 × 10⁴ cells were added to the inner chamber of the insert and 500 μl of either serum-free or serum-containing media was added to the outer chamber. Cells were incubated for 42 h at 37° with 5% CO2. The media was aspirated and the cells in the bottom of the well were fixed with 4% formaldehyde for 10 min at room temperature. The formaldehyde was aspirated and stained with crystal violet in 0.5% methanol. Media was aspirated and cells were resuspended in serum-free media to same cell concentration. The upper membrane was scraped to remove nonmigratory cells. The membrane was fixed between glass microscope coverslip using ProLong Gold. All experiments were performed with n ≥ 6. The images were captured by microscopy using Olympus BX41 at 10 × magnification. Cells were counted using ImageJ software.
Immunofluorescence
Cells were plated in six-well plates on acid cleaned cover slips (22 × 22 mm, No. 1.5) and grown to ∼50% confluence. After three quick washes in PBS, the cells were fixed in 3.6% paraformaldehyde/PBS for 20 min. This was followed by three 5 min washes in PBS and permeabilization in 100% MeOH, 10 min at −20 °C. The samples were washed again in PBS and then blocked for 1 h, at room temperature in PBS/0.5% TX-100 (Acros Organics, Waltham, MA)/2% ImmunoPure goat serum (Thermo Scientific, Rockford, IL). Primary antibodies; rabbit anti-Pan Actin (D18C11) (Cell Signaling, Danvers, MA) and mouse anti-Fascin (IM20) (Abcam, Cambridge, MA) were added at 1:100 in PBS/.5% TX-100 and incubated for 2 h, at room temperature. This was followed by 3 × 5 min washes in PBS and then addition of secondary antibodies Alexa Fluor goat anti-mouse-488 (Invitrogen, Carlsbad, CA) and Alexa Fluor goat anti-rabbit-594 (Invitrogen) at 1:200. These were incubated for 45 min, followed by washing with PBS. The cells were Dapi stained with a 5 min, dark incubation in 300 nm Dapi (Cell Signaling). After additional washing with PBS the cells were mounted on slides and imaged using and Olympus Bx41 microscope (Olympus, Center Valley, PA). The images were captured with a DP72 CCD driven by DP2 software (Olympus) and the color images were combined in the DP2 software. All images were captured using the same exposure time for each channel and the similar results were observed in single primary antibody stained cells. Cells that were not stained had no observable background fluorescence.
Bioinformatics and Statistics
Bioinformatics was performed on significantly altered proteins. This was determined by two parameters: one is having an analytical replication p value of < 0.05 and the second is determined by the ratio value. The standard deviation (S.D.) of all the ratios in the control sample was determined and then significance was defined as (1 ± 2SD) (25–27). Classification of proteins was determined by the web program PANTHER (28). The proteins were analyzed for overexpression of gene ontology terms in the categories of pathways, molecular function and biological process. Pathway mapping was performed using Pathvisio 2.0.11, a tool for visualizing and editing biological pathways (29). The ratio data of the significant proteins were loaded into Pathvisio and used to map onto preloaded pathways from Wikipathways (30) and KEGG (31–33). The pathway thus created was extensively modified from KEGG pathway 04810, “Regulation of actin cytoskeleton” in Homo sapiens to reflect the involvement of the differentially expressed proteins from the proteomic analysis.
Flow Cytometry
AC-1 and LTLT-Ca breast cancer cells were detached by trypsinization after which 1 × 10⁶ of each cell line was fixed in 1% formaldehyde in PBS for 10 min. Cells were resuspended in permeabilization/blocking buffer (PBS supplemented with 10% goat serum and 0.1% Tween-20). Cell pellets were stained with 1:100 dilution FITC conjugated monoclonal α-human vimentin antibodies or normal mouse IgG (Santa Cruz Biotechnology) in permeabilization blocking/buffer. FITC fluorescence (FL1-area) was determined by flow cytometry, using the Accuri C6 (BD Biosciences). Forward scatter and side scatter parameters were used to gate cell populations and eliminate debris.
Patient Survival Analysis
An online database (34) was used to assess relevance of significantly changed protein expressions to relapse free survival. The database was established using gene expression data and survival information of 2978 patients downloaded from Gene Expression Omnibus (GEO) (Affymetrix HGU133A and HGU133 + 2 microarrays, database updated in 2012). Breast cancer patient cohorts are stratified into two groups according to the median (or upper/lower quartile) expression of the gene. The two groups can be compared in terms of relapse free survival, overall survival and distant metastasis free survival. Three subgroups of patients can be assessed: systematically untreated patients, endocrine-treated ER positive patients, and patients with a distribution of clinical characteristics representative of those seen in general clinical practice in the United States.
To assess the relevance to patient survival of differentially expressed proteins identified in proteomics, the gene names corresponding to the proteins were entered into the database to obtain one Kaplan-Meier survival plot for each gene where the number-at-risk was indicated below the main plot. Hazard ratio (and 95% confidence intervals) and logrank P were calculated and displayed on the webpage. For the genes listed in Tables I and II, their effects on relapse free survival (RFS) were calculated and listed. Positive logrank p values indicate positive correlation (i.e. an altered gene correlates with decreased survival) and negative log rank p values indicate negative correlation (i.e. altered gene expression is associated with increased survival).
Table I. Selected up-regulated proteins in letrozole resistant breast cancer (LTLT-Ca) cells. Proteomic analyses were performed as described in the methods section and a ratio of the fold change in LTLT-Ca/AC-1 cells, p values and relapse free survival analyses are shown.
| Accession | # AAs | MW [kDa] | Description | Gene Symbol | Fold change LTLT-Ca/AC-1 | t-test (p values) | Relapse free survival analysis (Logrank P) |
|---|---|---|---|---|---|---|---|
| IPI00018300 | 478 | 55.3 | Interferon-induced protein with tetratricopeptide repeats 1 | IFIT1 | 6.728 | 8.43E-08 | 0.0033 |
| IPI00180240 | 44 | 5.1 | Thymosin beta-4-like protein 3 | TMSL3 | 4.096 | 2.12E-06 | 0.0024 |
| IPI00008918 | 759 | 85.2 | Isoform Beta of LIM domain and actin-binding protein 1 | LIMA1 | 3.962 | 1.25E-08 | −1.8E-4 |
| IPI00465431 | 250 | 26.1 | Galectin-3 | lgals3 | 3.468 | 2.85E-05 | 0.28 |
| IPI00017526 | 95 | 10.4 | Protein S100P | S100p | 3.383 | 2.34E-06 | 1.7E-6 |
| IPI00922108 | 1002 | 111.1 | Integrin alpha-V isoform 2 | itgav | 3.278 | 2.04E-05 | 2.3E-5 |
| IPI00010414 | 329 | 36 | PDZ and LIM domain protein 1 | pdlim1 | 3.255 | 1.48E-06 | −0.0019 |
| IPI00896384 | 265 | 30.6 | Kinesin heavy chain isoform 5C variant (Fragment) | 2.967 | 9.04E-07 | NA | |
| IPI00514234 | 517 | 57.1 | Ladinin-1 | Lad1 | 2.942 | 2.32E-05 | 0.17 |
| IPI00163187 | 493 | 54.5 | Fascin | fscn1 | 2.695 | 6.13E-06 | 0.0077 |
| IPI00017704 | 142 | 15.9 | Coactosin-like protein | cotl1 | 2.662 | 1.11E-05 | 0.037 |
| IPI00375426 | 323 | 36.2 | Cathepsin H | ctsh | 2.589 | 5.27E-05 | −0.11 |
| IPI00643056 | 82 | 9.2 | Cellular retinoic acid binding protein 2 | crabp2 | 2.529 | 5.72E-07 | 2.1E-4 |
| IPI00220113 | 979 | 102.8 | Isoform 2 of Microtubule-associated protein 4 | map4 | 2.355 | 9.77E-04 | 0.37 |
| IPI00219219 | 135 | 14.7 | Galectin-1 | lgals1 | 2.341 | 1.29E-06 | 1.4E-3 |
| IPI00219301 | 332 | 31.5 | Myristoylated alanine-rich C-kinase substrate | marcks | 2.137 | 3.05E-03 | 2.7E-5 |
| IPI00216691 | 140 | 15 | Profilin-1 | pfn1 | 2.104 | 9.38E-05 | 5.3E-8 |
| IPI00013895 | 105 | 11.7 | Protein S100-A11 | s100a11 | 2.051 | 3.00E-05 | 1.0E-11 |
| IPI00183695 | 97 | 11.2 | Protein S100-A10 | s100a10 | 2.006 | 1.22E-06 | 3.5E-7 |
| IPI00793199 | 321 | 36.1 | Annexin A4 | anxa4 | 1.979 | 2.86E-06 | 0.12 |
| IPI00217563 | 798 | 88.4 | Isoform Beta-1A of Integrin beta-1 | Itgb1 | 1.754 | 1.86E-04 | −3.9E-6 |
| IPI00024095 | 323 | 36.4 | Annexin A3 | anxa3 | 1.724 | 6.59E-04 | 0.4 |
| IPI00337335 | 1995 | 227.9 | Isoform 1 of Myosin-14 | myh14 | 1.597 | 1.98E-07 | −6.2E-6 |
| IPI00339379 | 879 | 98.7 | Isoform 2 of Rho guanine nucleotide exchange factor 1 | 1.541 | 2.74E-04 | NA | |
| IPI00024403 | 537 | 60.1 | Copine-3 | cpn3 | 1.533 | 7.29E-07 | 2.8E-10 |
| IPI00019502 | 1960 | 226.4 | Isoform 1 of Myosin-9 | myh9 | 1.532 | 5.01E-05 | 0.081 |
| IPI00550020 | 102 | 11.5 | Parathymosin | ptms | 1.53 | 4.89E-05 | 0.31 |
| IPI00010779 | 248 | 28.5 | Isoform 1 of Tropomyosin alpha-4 chain | ptm4 | 1.519 | 3.72E-05 | NA |
| IPI00645452 | 426 | 47.7 | Tubulin, beta | tubb | 1.476 | 1.95E-04 | 1.3E-7 |
| IPI00010182 | 87 | 10 | Isoform 1 of Acyl-CoA-binding protein | 1.474 | 3.22E-05 | NA | |
| IPI00019812 | 499 | 56.8 | Serine/threonine-protein phosphatase 5 | ppp5 | 1.464 | 1.08E-03 | −7.1E-7 |
| IPI00843975 | 586 | 69.4 | Ezrin | ezr | 1.434 | 4.65E-05 | 0.84 |
| IPI00879573 | 499 | 57 | Heparin cofactor 2 | serpind1 | 1.432 | 1.39E-02 | −1.2E-4 |
| IPI00554688 | 198 | 22.9 | Cyclin-C isoform b | ccnc | 1.427 | 2.54E-02 | 8.2E-5 |
| IPI00641181 | 195 | 19.5 | MARCKS-related protein | marcksl1 | 1.425 | 4.85E-03 | 0.085 |
| IPI00643041 | 216 | 24.4 | GTP-binding nuclear protein Ran | ran | 1.419 | 1.40E-04 | 1.4E-8 |
| 482 | 54.5 | Isoform 3 of Tyrosine-protein kinase Fyn | 1.402 | 6.07E-03 | NA | ||
| IPI00479186 | 531 | 57.9 | Isoform M2 of Pyruvate kinase isozymes M1/M2 | 1.385 | 1.50E-05 | NA | |
| IPI00900380 | 169 | 19.2 | Isoform 2 of Malignant T cell amplified sequence 1 | mcts1 | 1.383 | 7.49E-03 | 8.2E-13 |
| IPI00013808 | 911 | 104.8 | Alpha-actinin-4 | actn4 | 1.38 | 8.13E-05 | 0.83 |
| IPI00007074 | 528 | 59.1 | Tyrosyl-tRNA synthetase, cytoplasmic | yars | 1.38 | 3.12E-04 | 0.04 |
| IPI00377066 | 224 | 25.5 | Ras suppressor protein 1 isoform 2 | rsu1 | 1.365 | 3.26E-03 | −7.6E-4 |
| IPI00031169 | 212 | 23.5 | Ras-related protein Rab-2A | rab2a | 1.357 | 1.62E-03 | 0.27 |
| IPI00909239 | 887 | 102.6 | Alpha-actinin-1 isoform c | actn1 | 1.352 | 1.53E-05 | 8.9E-4 |
| IPI00014575 | 560 | 62.7 | Cell division control protein 6 homolog | cdc6 | 1.349 | 1.22E-03 | 1.9E-13 |
| IPI00157790 | 2017 | 223.6 | Proteasome-associated protein ECM29 homolog | 1.349 | 3.09E-04 | NA | |
| IPI00018364 | 183 | 20.5 | Ras-related protein Rap-2b | rap2b | 1.337 | 3.41E-03 | 0.0013 |
| IPI00642012 | 86 | 9.9 | Stathmin | stmn1 | 1.334 | 1.27E-03 | 4.2E-8 |
| IPI00297910 | 323 | 35.7 | Tumor-associated calcium signal transducer 2 | tacstd2 | 1.331 | 5.79E-05 | 0.95 |
| IPI00216319 | 246 | 28.2 | 14–3-3 protein eta | ywhah | 1.311 | 6.13E-04 | 0.15 |
| IPI00012011 | 166 | 18.5 | Cofilin-1 | cfl1 | 1.308 | 6.27E-06 | −0.0039 |
| IPI00021263 | 245 | 27.7 | 14–3-3 protein zeta/delta | ywhaz | 1.304 | 4.06E-06 | 1.1E-16 |
Table II. Selected down-regulated proteins in letrozole resistant breast cancer (LTLT-Ca) cells. Proteomic analyses were performed as described in the methods section and a ratio of the fold change in LTLT-Ca/AC-1 cells, p values and relapse free survival analyses are shown.
| Accession | # AAs | MW [kDa] | Description | Gene symbol | Fold change LTLT-Ca/AC-1 | t-test (p values) | Relapse free survival analysis (Logrank P) |
|---|---|---|---|---|---|---|---|
| IPI00218076 | 332 | 37.3 | Protein FAM9A | fam9a | −11.39 | 1.59E-6 | NA |
| IPI00022283 | 84 | 9.1 | Trefoil factor 1 | tff31/ps2 | −6.83 | 1.11E-5 | 3.4E-6 |
| IPI00073772 | 338 | 36.8 | Fructose-1,6-bisphosphatase 1 | fbp1 | −4.30 | 6.91E-6 | 3.3E-6 |
| IPI00011564 | 198 | 21.6 | Syndecan-4 | sdc4 | −3.82 | 1.38E-3 | 0.21 |
| IPI00909461 | 164 | 16.9 | cDNA FLJ52050, highly similar to Breast carcinoma amplified sequence 1 | −3.66 | 3.30E-5 | NA | |
| IPI00151462 | 125 | 14.6 | Microtubule-associated proteins 1A/1B light chain 3 beta 2 | map1lc3b | −3.54 | 2.11E-5 | −4.6E-5 |
| IPI00002280 | 260 | 27.4 | ProSAAS | −2.91 | 2.24E-3 | NA | |
| IPI00924735 | 774 | 85.9 | NRCAM protein | nrcam | −2.82 | 6.72E-5 | 1.2E-6 |
| IPI00647481 | 167 | 19.1 | Absent in melanoma 2 | aim2 | −2.71 | 8.96E-5 | 4.9E-5 |
| IPI00246975 | 225 | 26.5 | Glutathione S-transferase Mu 3 | gstm3 | −2.52 | 5.07E-6 | 7.2E-4 |
| IPI00795633 | 448 | 52.3 | CLU | clu | −2.50 | 1.23E-6 | 2.5E-12 |
| IPI00026358 | 117 | 13.7 | Gamma-aminobutyric acid receptor-associated protein-like 2 | gabarapl2 | −2.30 | 2.90E-7 | −0.46 |
| IPI00010214 | 104 | 11.7 | Protein S100-A14 lng = 104 | s100a14 | −2.12 | 1.16E-5 | −0.56 |
| IPI00793420 | 530 | 59.9 | Bone morphogenic protein type II receptor | bmpr2 | −2.05 | 2.39E-4 | −0.0093 |
| IPI00022462 | 760 | 84.8 | Transferrin receptor protein 1 | tfrc | −2.01 | 5.83E-6 | −7.2E-7 |
| IPI00008964 | 201 | 22.2 | Ras-related protein Rab-1B | rab1b | −1.94 | 1.22E-6 | 0.39 |
| IPI00010491 | 218 | 24.6 | Ras-related protein Rab-27B | rab27b | −1.85 | 4.56E-4 | 1.0 |
| IPI00218200 | 246 | 28.0 | B-cell receptor-associated protein 31 | bcap31 | −1.85 | 7.32E-7 | −1.5E-7 |
| IPI00152380 | 3530 | 395.0 | Myosin-XV | myo15A | −1.79 | 4.96E-4 | 2.0E-11 |
| IPI00788741 | 98 | 10.3 | Hydroxysteroid (17-beta) dehydrogenase 12, isoform CRA | −1.78 | 1.54E-4 | NA | |
| IPI00027463 | 90 | 10.2 | Protein S100-A6 | s100a6 | −1.77 | 7.87E-7 | 0.89 |
| IPI00000005 | 189 | 21.2 | GTPase NRas | nras | −1.75 | 3.44E-7 | −0.0013 |
| IPI00007188 | 298 | 32.9 | ADP/ATP translocase 2 | slc25a5 | −1.75 | 8.74E-6 | −1.6E-10 |
| IPI00007364 | 220 | 23.3 | Claudin-3 | cldn3 | −1.75 | 1.30E-4 | −6.8E-4 |
| IPI00016342 | 207 | 23.5 | Ras-related protein Rab-7a | rab7a | −1.73 | 4.51E-6 | 0.14 |
| IPI00215914 | 181 | 20.7 | ADP-ribosylation factor 1 | arf3 | −1.69 | 5.02E-5 | −0.12 |
| IPI00016513 | 200 | 22.5 | Ras-related protein Rab-10 | rab10 | −1.68 | 1.60E-4 | NA |
| IPI00062120 | 103 | 11.8 | Protein S100-A16 | s100a16 | −1.66 | 6.93E-5 | NA |
| IPI00186008 | 291 | 33.0 | PCTP-like protein | stard10 | −1.64 | 3.28E-5 | NA |
| IPI00106687 | 222 | 25.7 | Latexin | lxn | −1.59 | 1.36E-4 | 0.7 |
| IPI00026824 | 370 | 41.6 | Heme oxygenase 2 | hmox2 | −1.56 | 7.08E-5 | −9.7E-4 |
| IPI00152731 | 716 | 78.5 | Macrophage-expressed gene 1 protein | mpeg1 | −1.55 | 7.01E-5 | NA |
| IPI00941747 | 592 | 67.5 | Calnexin | canx | −1.54 | 4.15E-7 | −0.062 |
| IPI00297261 | 435 | 49.9 | Tyrosine-protein phosphatase non-receptor type 1 | ptpn1 | −1.53 | 5.49E-5 | 1.7E-6 |
| IPI00291467 | 298 | 32.8 | ADP/ATP translocase 3 | slc25a6 | −1.51 | 2.53E-4 | −0.013 |
| IPI00011229 | 412 | 44.5 | Cathepsin D | ctsd | −1.48 | 4.12E-7 | −0.3 |
| IPI00914602 | 714 | 80.8 | Amyloid beta A4 protein isoform f precursor | aplp1 | −1.47 | 1.25E-4 | −1.6E-7 |
| IPI00300096 | 201 | 23.0 | Ras-related protein Rab-35 | rab35 | −1.45 | 3.62E-5 | 1.2E-5 |
| IPI00879819 | 600 | 67.6 | Lamin-B2 | lmnb2 | −1.44 | 1.78E-6 | −0.013 |
| IPI00007755 | 225 | 24.3 | Ras-related protein Rab-21 | rab21 | −1.43 | 1.36E-4 | −0.43 |
| IPI00012866 | 480 | 55.7 | RAC-alpha serine/threonine-protein kinase (akt1) | akt1 | −1.43 | 2.35E-3 | 0.73 |
| IPI00006167 | 546 | 59.2 | Protein phosphatase 1G | ppm1g | −1.40 | 1.11E-5 | −1.3E-5 |
| IPI00021828 | 98 | 11.1 | Cystatin-B | cstb | −1.35 | 1.51E-5 | −1.7E-5 |
| IPI00025861 | 882 | 97.4 | Cadherin-1 | cdh1 | −1.34 | 1.41E-4 | 0.34 |
| IPI00016179 | 98 | 11.5 | Protein S100-A13 | S100a13 | −1.33 | 1.41E-5 | 0.083 |
| IPI00942032 | 175 | 20.0 | Anterior gradient protein 2 homolog | agr2 | −1.33 | 2.53E-6 | 0.083 |
RESULTS
Letrozole Resistance Alters the Expression of Genes Involved in Breast Cancer and Estrogen Signaling
RT-PCR analysis was first performed on a panel of 88 genes involved in estrogen signaling and breast cancer survival to identify the most significantly altered genes as a result of acquired letrozole resistance. A total of 39 genes were up-(19) or down- (10) regulated by over threefold while several of which exhibited extremely large fold changes (Additional file 1, Table S1). It is evident that the ER regulated signaling was significantly suppressed, as key ER related gene expressions were dramatically decreased. For example, as a result of ER down-regulation (-28-fold), progesterone receptor (PgR) and pS2 (TFF1) were dramatically reduced to almost negligible levels (-1891 and −1146-fold, respectively). Also diminished were mRNA expression levels of Cathepsin D (-1.44 fold) and CCNA1 (-104 fold). Although it is well documented that ER regulates PgR, TFF1, and Cathepsin D (35–41), the association of the CCNA1 gene with ER status has only recently been implicated (42). Interestingly, complement component 3 (C3), an ER responsive gene was significantly up-regulated by 250-fold, an observation that contradicts a recent study where C3 expression is often consistent with ER expression level (43). It was also noted that Bcl-2 levels decreased by over 340-fold in the letrozole resistant cell line, consistent with a previous report on the role of Bcl-2 in breast carcinoma (44).
The superarray analysis also revealed the up-regulation of a host of genes in the letrozole-resistant cells, suggesting a compensatory mechanism that helps sustain the growth and proliferation of the LTLT-Ca cell line as a result of acquired resistance to letrozole (12, 13). EGFR was up-regulated by 28-fold, an indication of activated survival pathways downstream of the growth factor receptor. In addition, the 5.9-fold overexpression of Her2, suggests yet another alternative signaling pathway that has been up-regulated. We also observed a significant increase in mRNA expression of the MUC1 (20 fold) and IL6 (89-fold) genes, which have been reported to promote breast cancer survival and progression (45). The huge fold change of GABRP (6202-fold increase) along with SERPINB5 (24-fold increase) and MUC1 (20-fold increase) suggests that the letrozole-resistant breast cancer cells may have transitioned to a more aggressive phenotype (44, 46).
Letrozole-resistance Alters the Cellular Morphology of Breast Cancer Cells
In addition to alterations occurring at the level of gene expression in LTLT-Ca cells, these cells also demonstrated a change in cellular morphology from a rounded, uniform cell body to a less organized cell body with protrusions (Fig. 1). The acquisition of the protrusion-like morphology is suggestive of changes that occur during epithelial to mesenchymal transition (EMT) whereby, cells of epithelial origin lose epithelial characteristics and polarity, and acquire a mesenchymal phenotype with increased migratory behavior. It has been proposed that EMT-like processes might occur during tumor progression in carcinomas, particularly at specific stages (i.e. invasion and intravasation) where tumor cells disassemble and migrate to tissue and organ sites distant from the primary tumors.
Fig. 1.
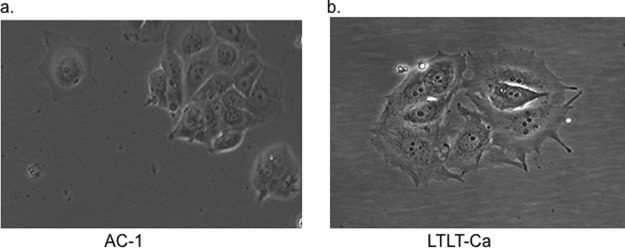
Morphology of AC-1 and LTLT-Ca Cells. (A) AC-1 and (B) LTLT-Ca cell images were captured by microscopy using Olympus BX41 at 10 × magnification.
Quantitative Proteomic Analysis Reveals Extensive Changes of Protein Expression in Letrozole Resistant Cells Compared With Control Cells
Using a gel free proteomic approach combining tandem mass tag (TMT) labeling, two-dimensional HPLC, and high-resolution mass spectrometry, we obtained the identities of over 1700 proteins with quantitative abundance ratios present in both the letrozole resistant and the sensitive breast cancer cells. Of the quantified proteins, a total of 863 were significantly altered (p < 0.05), with 411 proteins up-regulated and 452 down-regulated by at least 20% (Additional file 2, supplemental Table S2). Pathway analysis of all significantly changed proteins using PANTHER indicates adaptive alterations in several signaling pathways. Listed in Tables I and II are proteins selected for either their large fold changes or perceived relevance to breast cancer progression and adaptation to letrozole treatment. Importantly, the androgen/estrogen/progesterone biosynthesis was down-regulated, whereas the EGF receptor signaling pathway and the cytoskeletal regulation by Rho GTPase were significantly up-regulated. Suppression of ER signaling was demonstrated by the down-regulation of at least three classical ER regulated genes: TFF1 (pS2), Cathepsin D, and AGR2 where their protein expression were reduced by 6.8, 1.5, and 1.3 fold, respectively. This proteomic signature was consistent with changes occurring at the mRNA level where ER, TFF1, and PgR were drastically down-regulated in the RT-PCR analysis of a breast cancer superarray panel consisting of 84 genes. Up-regulation of multiple proteins associated with survival signaling and enhanced migration and invasion were also observed in our proteomic data. For example, the proteins thymosin beta-4, S100P, integrin alpha-V isoform 2 (ITGAV), galectin-3, fascin, and galectin-1 were found overexpressed in LTLT-CA cells by 4.1, 3.4, 3.3, 3.5, 2.7, and 2.3-fold, respectively.
Western Blot and Immunostaining Confirm Key Protein Expression Changes in Letrozole-resistant Cells
Global quantitative proteomic analysis identified the expression changes of a large number of proteins in LTLT-Ca cells that reflect suppressed ER signaling and enhanced alternative survival pathways. To confirm some of these expression changes we selected several proteins for validation by immunoblotting. ITGAV has been found significantly up-regulated in tumors with positive perineural invasion (p = 0.028) (47) and in breast cancer (48). Viana et al. observed a direct relationship between ITGAV and EGFR expression (r = 0.774; p < 0.001) by IHC, suggesting the possibility of crosstalk in this signaling pathway. Overexpression of ITGAV was also implicated in the differentiation and metastasis of cancer cells (49). In earlier studies, overexpression of ITGAV by neoplastic cells was shown to contribute to the promotion of local invasion and metastasis and was associated with adverse prognosis (50, 51). Fascin is an actin-bundling protein linked to migration in cell culture systems and metastasis in vivo (52–54). In breast cancer cells, fascin was also shown to regulate cell morphology, migration, and invasion (55). ER and aromatase were not detected in proteomic analysis, presumably due to reasons not efficient in extracting these proteins. Given the high relevance of ER and aromatase to the transition of breast cancer cells to letrozole resistance, they are also selected for Western blot validation. As shown in Fig. 2, both ER and aromatase expression were down-regulated in the letrozole resistant cell line, suggesting that acquired AI resistance drives a phenotype that is much less dependent on estrogen for growth and proliferation. This observation is consistent with previous reports on letrozole-resistant characteristics (5, 11). Increased expression of both ITGAV by more than twofold (Fig. 2) and fascin by more than 50-fold (Fig. 2, supplemental Data File S1, supplemental Fig. S1) in letrozole resistant cells was confirmed in Western blotting and immunohistochemistry.
Fig. 2.
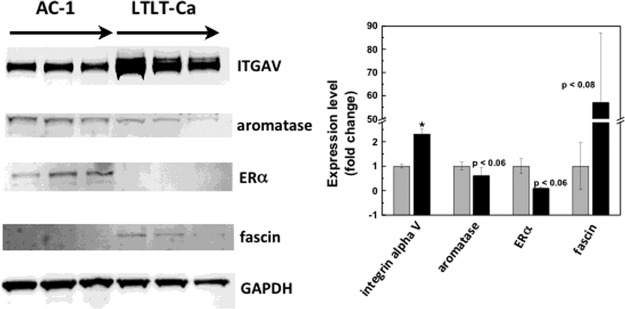
Western blot analysis confirms changes in protein expression in letrozole resistant cells initially identified in quantitative proteomics. A, A representative Western blot of AC-1 and LTLT-Ca cells showing the different expression levels of the indicated proteins in triplicate. B, Quantitative analysis of expression fold changes of the indicated proteins with expression levels in AC-1 set to 100%.
Pathway Analysis Reveals that Integrins and RhoA Signaling Drive Enhanced Cell Motility in LTLT-Ca Cells
Proteomic analysis revealed the up-regulation of multiple proteins that participate in the actin cytoskeletal dynamics. To understand the molecular signaling associated with these proteomic changes in the letrozole resistant MCF-7 cells we mapped our protein changes on a custom pathway derived from an initial KEGG pathway framework (See Experimental section). Thirty-four proteins in the proteomics data were identified as involved in the regulation of cell motility and showed statistically significant changes in expression levels (ACTB, ACTN1, ACTN4, ARPC2, ARPC4, ARPC5, CAV1, CFL1, CRKL, DIAPH1, EZR, Fascin, Filamin A, FYN, GNA13, GNG12, IQGAP, ITGA3, ITGAV, ITGB, LAMB1, MYL6, PFN1, PIP4K2C, RAC1, RhoA, RHO GEF, RDX, S100P, THBS1, TMSL3, VASP, VCL, Zyxin). Although some fold changes were below 1.2, they were statistically significant (see supplemental Table S1, p < 0.05) and were thus included in the pathway construction. Fig. 3 illustrates a reconstructed KEGG pathway map of actin cytoskeleton regulation. In one possible scenario, enhanced Rho-Rock signaling is enabled by increased expression of RHO GEF, the RhoA activator, and CAV1, which inhibits p190 RhoGAP. Decreased expression of DIAPH1 helps push RhoA to interact and signal through ROCK (56, 57). In another signaling route depicted in the map, increased integrin signaling (ITGA3, ITGAV, ITGB) expression is implicated in the formation of focal adhesions with adaptor proteins, actinin, filamin A, vinculin (VCL), and Zyxin (58). This complex of integrins and proteins works in a coordinated manner to polymerize actin to form filopodia, with the help of fascin (59).
Fig. 3.

Regulation of action cytoskeleton in LTLT-Ca MCF-7 cells. The pathway illustrates the changes to proteins expression, in the LTLT-Ca cell line, involved in regulating the actin cytoskeleton. The program Pathvisio v2.0 was used to edit and overlay the ratio data onto the curated pathway. All colored proteins are significantly up- or down-regulated (red = up and blue = down). The ratio number for each significantly regulated protein is located to the right of that protein. Solid lined with no arrow indicate physical interaction. Solid lines with an arrow or bar at the end indicate direct activation or inhibition, respectively. Dotted lines indicate indirect or unknown method of interaction.
Cell Migration and Invasion is Enhanced by Letrozole Resistance
Upon identification of several key proteins that were critically involved in cell migration and invasion, we performed a proof of principle functional assay to determine if alteration of these proteins were sufficient to confer cell motility and/or invasion. Results are shown in Figs. 4 and 5. For migration assays, both AC-1 and LTLT-Ca cells were seeded in the appropriate serum-free media on the inner chamber of a cell culture insert, whereas for invasion assays a matrigel-coated cell insert was used. Cells were incubated for 24 h and afterward they were fixed and stained. Cells that migrated were imaged and counted. Migration assays revealed that although AC-1 cells exhibited very little migratory behavior, ∼84% more of the LTLT-Ca cells were induced to migrate from the serum-starved insert to the serum-containing compartment (Fig. 4A). Invasion assays demonstrated LTLT-Ca cells were ∼138% more invasive than the AC-1 cells (Fig. 4B).
Fig. 4.
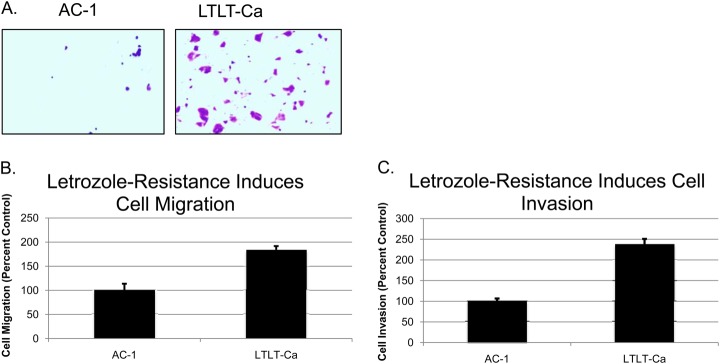
Letrozole resistance promotes, cell migration and, cell invasion. A, Representative migration assay of AC-1 and LTLT-Ca cells showing the differences in cell migration. B, Quantitative analysis of cell migration with AC-1 cells set to 100%. C, Quantitative analysis of cell invasion assay with AC-1 cells set to 100%.
Fig. 5.
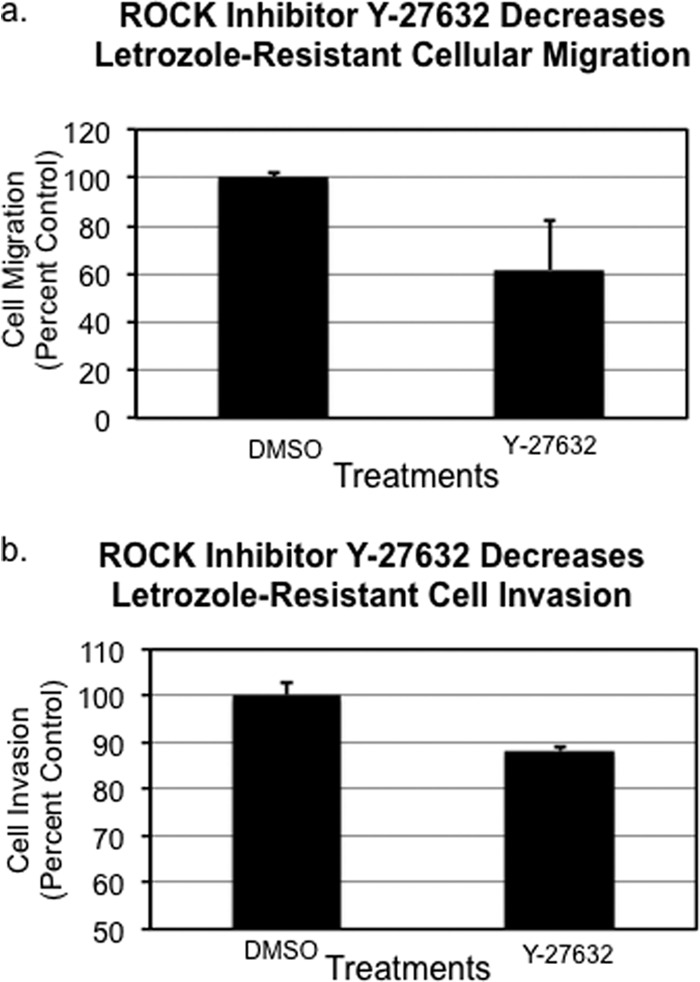
ROCK inhibitor Y-27632 partially abrogated the enhanced (A) migratory and (B) invasive capacity of LTLT-Ca breast cancer cells resistant to letrozole.
Enhanced Cell Motility in Letrozole Resistant Breast Cancer Cells is Dependent on RhoA-ROCK Signaling Pathway
Pathway analysis predicted the participation of several key proteins involved in ROCK mediated cellular motility of letrozole-resistant cells. We were primarily interested in determining if the small fold change in RhoA expression in LTLT-Ca cells (1.5-fold up-regulation) is at least partially responsible for enhanced motility. Therefore, we examined the effect of ROCK inhibitor (Y-27632) treated LTLT-Ca cells on migratory capacity. Treatment of the resistant cells with 10 μm Y-27632 resulted in a 40% reduction of transwell migration, thus reversing the migratory phenotype of the letrozole-resistant cells (Fig. 5A). Likewise LTLT-Ca cells were exposed to the ROCK inhibitor and the invasive properties of the cells were examined. Results demonstrated that the ROCK inhibitor decreased invasion by ∼12% (Fig. 5B). Taken together, these results suggest a role for ROCK in the motility of letrozole-resistant cells.
Letrozole Resistance is Associated With a Mesenchymal Phenotype With Increased Expression of Vimentin
EMT is a process that allows a polarized epithelial cell, which normally interacts with the basement membrane via its basal surface, to undergo multiple biochemical changes that enable it to assume a mesenchymal phenotype. It is a coordinated molecular and cellular change defined as a reduction in cell-cell adhesion, apical-basolateral polarity, and epithelial markers, as well as an acquisition of motility, spindle-cell shape, and mesenchymal markers. In addition EMT is characterized by an enhanced migratory capacity, invasiveness, elevated resistance to apoptosis, and greatly increased production of ECM components. EMT has been postulated as an absolute requirement for tumor invasion and metastasis. The enhanced migration and invasion of the letrozole resistance cells prompted us to measure the cell population expressing vimentin and twist using flow cytometry in AC-1 versus LTLT-Ca cells. Results demonstrate LTLT-Ca cells have more than a twofold greater expression of vimentin compared with the parental cells, and twist expression was increased by 50% (Fig. 6). Taken together, up-regulation of both vimentin and twist suggest that letrozole-resistance may induce an EMT-like phenotype.
Fig. 6.

Letrozole resistance is associated with EMT. Expression levels of vimentin and twist, two markers associated with EMT, were determined in permeabilized AC-1 and LTLT-Ca cells by flow cytometric analysis using an Accuri C6 flow cytometer. A, and B, are representative histograms showing the fluorescence intensity following staining with α-vimentin-FITC or α-twist antibodies (with Alexa 488 secondary staining) of AC-1 (black) or LTLT-Ca (red) cell lines. Vimentin and twist expression were separately determined and each analysis was performed at least twice. C, depicts the normalized expression of vimentin (black) and twist (gray) in AC-1 and LTLT-Ca cells as shown in panels A, and B, with expression in AC-1 as 100% expression for vimentin and twist.
Clinical Relevance of Proteomic Signatures of Letrozole Resistance
To assess the clinical relevance of proteomic signatures of letrozole resistance in breast cancer patients, we used an online breast cancer patient survival analysis tool to obtain a Kaplan-Meier plot for each up- and down-regulated proteins selected in Tables I and II. The online database contains the expression of 22,277 genes and survival information of 2978 breast cancer patients (34). Relapse free survival was used to correlate with the proteins selected in Tables I and II. As shown in the last column, alterations in the expression level of many proteins in letrozole resistant cells were found to positively correlate with decreased survival. For example, the up-regulation of S100P, S100A10, S100A11, integrin alpha-V (itgav), MARCKS, profiling-1, fascin, galectins 1 and 3, β-tubulin, copine-3, and the GTP-binding nuclear protein Ran all appear to be predictive of poor survival (Table I). On the other hand, down-regulation of a number of proteins such as protooncogene vav (vav1), trefoil factor 1 (tff1/PS2), syndecan-4, absent in melanoma 2, glutathione S-transferase Mu 3 (gstm3), tyrosine-protein phosphatase non-receptor type 1 (ptpn1), and clusterin are significantly correlated to poor prognosis and decreased survival. However, letrozole resistance also appears to induce expression changes of many proteins that are associated with improved survival in clinical results. For instance, the overexpression of serine/threonine-protein phosphatase 5, isoform 1 of myosin-14, heparin cofactor 2, and the down-regulation of GTPase NRas, Claudin-3, Heme oxygenase 2 all point to a better prognosis as indicated by the Kaplan-Meier survival curves (see negative longrank p values in the last columns of Tables I and Table II).
Fig. 7A–7D represent the Kaplan-Meier survival plots for four up-regulated proteins in LTLT-Ca cells strongly correlated to decreased relapse free survival. The up-regulation of fascin (p < 0.008), integrin alph-V (p < 2.3 × 10⁻⁵), MARCKS (p < 0.00003), and profilin-1 (p < 10−7) is correlated to reduced survival over a period of 20 years. Shown in Fig. 7E–7H are Kaplan-Meier survival curves where several downregulated proteins were significantly correlated to poor survival outcome. Thus, reduced expression of fructose-1,6-bisphosphatase 1 (fbp1) and glutathione S-transferase Mu 3 (gstm3) are strongly associated with lower relapse free survival (p < 10−5 for both genes). Down-regulation of the protein absent in melanoma 2 (AIM2) and trefoil factor 1 (TFF1) were also found to correlate significantly with decreased survival of patients (p < 10−4, and p < 10−5, respectively).
Fig. 7.

Kaplan-Meier survival plots indicate prognostic relevance of both overexpressed and downregulated proteins found in letrozole resistant cells. A, Up-regulation of the actin bundling protein fascin is predictive of reduced relapse free survival; B, Overexpression of ITGAV is significantly associated with poor prognosis; C, More patients suffer from relapse if their breast cancers have higher level of MARCKS; D, Increased expression of profilin-1 is prognostic of worse disease outcome; E, Reduced expression of fbp1 correlates significantly with decreased survival; F, Down-regulation of gstm3 is predicative of poor survival; G, Down-regulation of AIM2 is associated with worse prognosis; and H, Lower level of TFF1/pS2 predicts shorter relapse free survival.
Dramatic down-regulation of the Bcl-2 gene in LTLT-Ca cells also prompted us to test its clinical relevance as a predictor of disease outcome. Kaplan-Meier plots suggest the Bcl-2 is strongly associated with relapse free survival of all patients regardless of ER status (Fig. 8A). The correlation of reduced expression and poorer survival remains significant when only ER + (Fig. 8B) or ER- (Fig. 8C) patients are considered. Moreover, for ER+ but PR- breast cancer patients, lower expression of Bcl-2 gene again is an excellent indicator of decreased recurrence free survival (Fig. 8D).
Fig. 8.

Kaplan-Meier plots demonstrate Bcl-2 down-regulation is predictive of poor relapse free survival in A, all breast cancer patients; B, patients with ER+ breast cancer; C, patients with ER- breast cancer; and D, patients with ER- and PgR- breast cancer.
DISCUSSION
The complexity of adaptive cellular changes in acquired resistance to aromatase inhibitors such as letrozole requires a systems biology approach for a better understanding of the mechanisms of resistance. Previous studies on letrozole-resistant breast cancer cells have mainly focused on genomic characterization (60, 61). To the best of our knowledge, this study represents the first quantitative investigation of adaptive proteomic changes occurring in the letrozole resistant cells. Recognizing that resistance related gene expression changes do not always reflect changes in protein expression, we first analyzed a panel of genes known to play a role in breast cancer and ER signaling. The superarray results revealed the dramatic down-regulation of genes involved in estrogen signaling, including ER, pS2, and PgR. These data confirmed that estrogen deprivation because of inhibition of aromatase could lead to the loss of ER, which in turn caused a drastic decrease in the ER dependent gene expression of TFF1/pS2 and the progesterone receptor.
When breast cancer cells become independent of ER for sustained survival and proliferation, alternative signaling must be activated. Indeed, our gene array data suggest that the up-regulated EGFR (28.1-fold) and erbB2 (5.8-fold) levels may contribute at least in part to such survival signaling. Several previous studies also point to constitutive activation of growth factor receptor signaling as the primary mechanism of letrozole resistance (10, 62–64). On the other hand, there are clear signs of activated pathways involving genes such as JUN, TNFAIP2, C3, and GABRP that may also contribute to sustained survival in the presence of letrozole. The severe reduction of Bcl-2 gene expression (-346-fold) in letrozole resistant cells was also a significant observation, in that numerous studies have shown that tumors with high bcl-2 expression are more responsive to hormone therapy and have more favorable disease-free and overall survival (65). Conversely, lowered levels of bcl-2 expression have been associated with a poorer disease prognosis (66–68). This is consistent with the Kaplan-Meier plots (Fig. 8) where decreased expression of Bcl-2 is significantly correlated to lower relapse free survival. Our data suggest that letrozole resistance leads to dramatic down-regulation of the expression of Bcl-2, which in turn can be predictive of increased invasiveness and worse disease outcome.
Although the RT-PCR array analysis provided a snapshot of the profound differences between the letrozole sensitive and resistant cells as reflected in 88 genes, quantitative proteomic analysis revealed much more extensive changes occurring in the expression of hundreds of proteins as a result of acquired letrozole resistance (Tables I and II, supplemental Table S1). Statistically significant fold changes of over 800 proteins reflect a complex signaling network evolved in response to the prolonged challenge of letrozole treatment. Although ER and PgR proteins were not captured in the global proteomic analysis, a large decrease in the trefoil factor 1 (TFF1/pS2) gene expression and reduced ER protein levels confirmed a distinct characteristic of our letrozole resistant cells consistent with diminished estrogen signaling. As compensation for the loss of ER regulated survival, multiple proteins were seen up-regulated, including those that have not been associated with letrozole resistance, indicating the diverse adaptive mechanisms at work. The up-regulation of S100P and other S100 family proteins revealed a previously unknown link between letrozole resistance and the calcium binding small proteins. S100P is a ligand for the receptor for advanced glycation end product (RAGE). Binding of the Ca2+ activated S100P homodimer to RAGE has been shown to promote cancer cell proliferation via the ERK1/2 and NFκB signaling pathways (69–71). S100P was also found to co-immunoprecipitate with RAGE and its action on cell survival and proliferation could be blocked by RAGE inhibitors (71). Thus, marked overexpression of S100P, along with S100A10 and S100A11 was at least partially responsible for the sustained growth and survival of the letrozole resistant breast cancer cells. Our results suggest that, as the ER regulated proliferation pathway was severely suppressed after prolonged exposure to letrozole, the S100P-RAGE signaling via activation of ERK1/2 and possibly NF-κB was activated as a compensatory mechanism of cell proliferation and survival.
More importantly, proteomic data provided collective evidence of the progression of letrozole resistant cells toward a more aggressive phenotype. Up-regulation of thymosin beta-4 has been found to correlate with malignant progression of SW480 colon cancer cells and metastatic capacity of colorectal carcinomas (72–74). The actin-bundling protein, fascin, was significantly up-regulated in the letrozole resistant cells (2.7-fold, p = 6.1 × 10⁻⁶). Fascin has been found to play a critical role in invasive and metastatic carcinomas including ER negative breast tumors (55, 75, 76) and has been associated with poor prognosis, shorter survival, and more metastatic diseases (77–79). The overexpression of fascin in the LTLT-Ca cells suggests that the prometastasis protein may promote migration and invasion in letrozole resistant breast cancer cells.
Pathway analysis using bioinformatics tools supports a model where increased RhoA promotes migratory cell polarity through ROCK mediated inhibition of Rac1 in lamellipodia (Fig. 3 orange lines) (56). The multifunctional membrane protein responsible for caveolae formation, Caveolin-1 (Cav1, 1.50, p < 0.001), has recently been identified as an effector of Rho/ROCK signaling implicated in tumor migration (80–82). Cav1 is also overexpressed in basal-like cells and associated with a poor breast cancer prognosis (83, 84). This type of cell motility is characterized by plasma membrane blebs and also involves the proteins a-actinin (ACTN), ezrin (EZR), filamin A, Fyn, myosin (MYL6), tropomodulin, tropomyosin, and radixin (RDX) (71–73). The down-regulation of DIAPH1 is supportive of this model since it has been shown to increase ROCK-dependent invasiveness (57, 85). The membrane/F-actin cross-linking protein ezrin is necessary for RhoA mediated motility and is implicated in tumor metastasis (86–88). Activation of ezrin by the EF-hand calcium binding protein S100P is reported to promote transendothelial migration of tumor cells (89). The above model is based on quantitative proteomic data where a network of proteins is mobilized to promote cell motility. This scenario is further corroborated by the partial abrogation of the enhanced motility of LTLT-Ca cells when a ROCK inhibitor was used to treat the resistant cell line (Fig. 5).
Both proteomic evidence (Tables I and II, supplemental Table S1) and functional studies (Fig. 4) suggest that the letrozole resistant LTLT-Ca cells are becoming a basal-like metaplastic or claudin-low breast cancer subtype with the decreased expression of cadherin 1 (-1.35, p < 0.001), claudin-3 (-1.74, p < 0.001) and increased expression of laminin (LAMB1,1.82, p < 0.01), fascin (2.712, p < 0.00001), and SPARC (1.14, p < 0.01) (supplemental Table S1) (90, 91). Endocrine resistance is often associated with an EMT and basal-like cells are more likely to undergo an epithelial to mesenchymal transition (92, 93). The marked increase of TMSL3 expression in LTLT-Ca cells is another sign of EMT occurring in the resistant cells, as it is a known trigger of this transition (94). More definitive evidence, however, is provided by flow cytometry analysis of vimentin and twist expression, hallmarks of EMT, which was up-regulated in the letrozole resistant cells (Fig. 6).
Our cellular model of letrozole resistance also demonstrated clinical relevance. Many of the changes in mRNA and proteomic expression have significant predictive values. Overexpression of pro-migration and pro-invasion proteins such as fascin and ITGAV has been associated with reduced relapse free survival in breast cancer patients, as illustrated in the Kaplan Meier plots (Fig. 7). Loss of estrogen-mediated signaling has a negative impact on breast cancer progression, a characteristic evident in our letrozole resistant cells. Consequently, loss of estrogen-mediated signaling is also confirmed as a strong indicator of poor prognosis. Moreover, our study also revealed that the anti-apoptotic Bcl-2 gene, significantly down-regulated at the mRNA level, may also contribute to transforming the letrozole resistant cells into a more invasive phenotype. Clinically, reduced expression of Bcl-2 is strongly indicative of worse disease outcome (Fig. 8).
In conclusion, we have characterized a letrozole resistant breast cancer cell line using a global proteomic approach, supplemented by analysis of an mRNA panel of 88 genes. Our study demonstrated that acquired letrozole resistance was accompanied by diminished ER regulated signaling, activation of growth factor signaling pathways downstream of EGFR and erbB2, and up-regulation of multiple proteins that collectively promote cell motility, invasion, and EMT. Importantly, our study for the first time revealed links between AI resistance and cellular transformation toward a more aggressive phenotype where expression changes of key proteins such as fascin, Bcl-2, and vimentin could be used as clinical predictive biomarkers for breast cancer undergoing letrozole treatment. Although our study is based on a well-established ER+ aromatase transfected breast cancer cell line, it is highly desirable that investigations of letrozole resistance can be extended to additional breast cancer cell lines for further validation of many potentially useful proteomic targets discovered in this report. We are encouraged by a recent report (95) where a letrozole resistant T47D cell line transfected with constitutive expression of aromatase was successfully cultured. A comprehensive proteomic characterization of such additional cell models of letrozole resistance is being actively pursued in our laboratory.
Supplementary Material
Footnotes
* This study was supported by the Louisiana Cancer Research Consortium (LCRC); Office of Naval Research Grant N00014-99-1-0763, National Institutes for Minority Health and Health Disparties RCMI program through Grant 3G12MD007595-04.
 This article contains supplemental Fig. S1 and Tables S1 and S2.
1 The abbreviations used are::
- AI
- Aromatase Inhibitors
- AC-1
- MCF-7 cells stably transfected with the human aromatase gene
- EMT
- Epithelial to Mesenchymal Transition
- ERα
- Estrogen Receptor alpha
- LTLT-Ca
- Long-term letrozole treated MCF-7Ca cells
- TMT
- tandem mass tags.
REFERENCES
- 1. Dunbier A. K., Hong Y., Masri S., Brown K. A., Sabnis G. J., Palomares M. R. (2010) Progress in aromatase research and identification of key future directions. J Steroid Biochem. Mol. Biol 118, 311–315 [DOI] [PubMed] [Google Scholar]
- 2. Geisler J., Lønning P. E. (2005) Aromatase inhibition: translation into a successful therapeutic approach. Clin. Cancer Res. 11, 2809–2821 [DOI] [PubMed] [Google Scholar]
- 3. Sabnis G., Brodie A. (2011) Adaptive changes results in activation of alternate signaling pathways and resistance to aromatase inhibitor resistance. Mol. Cell. Endocrinol. 340, 142–147 [DOI] [PubMed] [Google Scholar]
- 4. Dowsett M., Martin L. A., Smith I., Johnston S. (2005) Mechanisms of resistance to aromatase inhibitors. J. Steroid Biochem. Mol. Biol. 95, 167–172 [DOI] [PubMed] [Google Scholar]
- 5. Brodie A., Macedo L., Sabnis G. (2010) Aromatase resistance mechanisms in model systems in vivo. J. Steroid Biochem. Mol. Biol. 118, 283–287 [DOI] [PMC free article] [PubMed] [Google Scholar]
- 6. Masri S., Phung S., Wang X., Chen S. (2010) Molecular characterization of aromatase inhibitor-resistant, tamoxifen-resistant and LTEDaro cell lines. J. Steroid Biochem. Mol. Biol. 118, 277–282 [DOI] [PMC free article] [PubMed] [Google Scholar]
- 7. Wong C., Chen S. (2009) Heat shock protein 90 inhibitors: new mode of therapy to overcome endocrine resistance. Cancer Res. 69, 8670–8677 [DOI] [PMC free article] [PubMed] [Google Scholar]
- 8. Masri S., Phung S., Wang X., Wu X., Yuan Y. C., Wagman L., Chen S. (2008) Genome-wide analysis of aromatase inhibitor-resistant, tamoxifen-resistant, and long-term estrogen-deprived cells reveals a role for estrogen receptor. Cancer Res. 68, 4910–4918 [DOI] [PubMed] [Google Scholar]
- 9. Brodie A., Sabnis G., Macedo L. (2007) Xenograft models for aromatase inhibitor studies. J. Steroid Biochem. Mol. Biol. 106, 119–124 [DOI] [PubMed] [Google Scholar]
- 10. Sabnis G., Brodie A. (2010) Understanding resistance to endocrine agents: molecular mechanisms and potential for intervention. Clin. Breast Cancer 10, E6–E15 [DOI] [PubMed] [Google Scholar]
- 11. Chumsri S., Sabnis G. J., Howes T., Brodie A. M. (2011) Aromatase inhibitors and xenograft studies. Steroids 76, 730–735 [DOI] [PMC free article] [PubMed] [Google Scholar]
- 12. Jelovac D., Sabnis G., Long B. J., Macedo L., Goloubeva O. G., Brodie A. M. (2005) Activation of mitogen-activated protein kinase in xenografts and cells during prolonged treatment with aromatase inhibitor letrozole. Cancer Res. 65, 5380–5389 [DOI] [PubMed] [Google Scholar]
- 13. Tilghman S. L., Sabnis G., Brodie A. M. (2011) Upregulation of AIB1, Aromatase and ER Provides Long-Term Estrogen Deprived Human Breast Cancer Cells with a Mechanistic Growth Advantage for Survival. Hormone Mol. Biol. Clin. Inv. 3, 357–366 [DOI] [PMC free article] [PubMed] [Google Scholar]
- 14. Santner S. J., Pauley R. J., Tait L., Kaseta J., Santen R. J. (1997) Aromatase activity and expression in breast cancer and benign breast tissue stromal cells. J. Clin. Endocrinol. Metab. 82, 200–208 [DOI] [PubMed] [Google Scholar]
- 15. Sutherland R. M. (1988) Cell and environment interactions in tumor microregions: the multicell spheroid model. Science 240, 177–184 [DOI] [PubMed] [Google Scholar]
- 16. Sheikh M. S., Shao Z. M., Chen J. C., Fontana J. A. (1993) Differential regulation of matrix Gla protein (MGP) gene expression by retinoic acid and estrogen in human breast carcinoma cells. Mol. Cell. Endocrinol. 92, 153–160 [DOI] [PubMed] [Google Scholar]
- 17. Sun X. Z., Zhou D., Chen S. (1997) Autocrine and paracrine actions of breast tumor aromatase. A three-dimensional cell culture study involving aromatase transfected MCF-7 and T-47D cells. J. Steroid Biochem. Mol. Biol. 63, 29–36 [DOI] [PubMed] [Google Scholar]
- 18. Silva M. C., Rowlands M. G., Dowsett M., Gusterson B., McKinna J. A., Fryatt I., Coombes R. C. (1989) Intratumoral aromatase as a prognostic factor in human breast carcinoma. Cancer Res. 49, 2588–2591 [PubMed] [Google Scholar]
- 19. Brodie A., Lu Q., Nakamura J. (1997) Aromatase in the normal breast and breast cancer. J. Steroid Biochem. Mol. Biol. 61, 281–286 [PubMed] [Google Scholar]
- 20. Bulun S. E., Simpson E. R. (2008) Aromatase expression in women's cancers. Adv. Exp. Med. Biol. 630, 112–132 [DOI] [PubMed] [Google Scholar]
- 21. Bulun S. E., Chen D., Lu M., Zhao H., Cheng Y., Demura M., Yilmaz B., Martin R., Utsunomiya H., Thung S., Su E., Marsh E., Hakim A., Yin P., Ishikawa H., Amin S., Imir G., Gurates B., Attar E., Reierstad S., Innes J., Lin Z. (2007) Aromatase excess in cancers of breast, endometrium and ovary. J. Steroid Biochem. Mol. Biol. 106, 81–96 [DOI] [PMC free article] [PubMed] [Google Scholar]
- 22. Long B. J., Jelovac D., Thiantanawat A., Brodie A. M. (2002) The effect of second-line antiestrogen therapy on breast tumor growth after first-line treatment with the aromatase inhibitor letrozole: long-term studies using the intratumoral aromatase postmenopausal breast cancer model. Clin. Cancer Res. 8, 2378–2388 [PubMed] [Google Scholar]
- 23. Brodie A., Jelovac D., Sabnis G., Long B., Macedo L., Goloubeva O. (2005) Model systems: mechanisms involved in the loss of sensitivity to letrozole. J. Steroid Biochem. Mol. Biol. 95, 41–48 [DOI] [PubMed] [Google Scholar]
- 24. Pfaffl M. W., Lange I. G., Daxenberger A., Meyer H. H. (2001) Tissue-specific expression pattern of estrogen receptors (ER): quantification of ER alpha and ER beta mRNA with real-time RT-PCR. APMIS 109, 345–355 [DOI] [PubMed] [Google Scholar]
- 25. Guo Y., Singleton P. A., Rowshan A., Gucek M., Cole R. N., Graham D. R., Van Eyk J. E., Garcia J. G. (2007) Quantitative proteomics analysis of human endothelial cell membrane rafts: evidence of MARCKS and MRP regulation in the sphingosine 1-phosphate-induced barrier enhancement. Mol. Cell. Proteomics 6, 689–696 [DOI] [PMC free article] [PubMed] [Google Scholar]
- 26. Pierce A., Unwin R. D., Evans C. A., Griffiths S., Carney L., Zhang L., Jaworska E., Lee C. F., Blinco D., Okoniewski M. J., Miller C. J., Bitton D. A., Spooncer E., Whetton A. D. (2008) Eight-channel iTRAQ enables comparison of the activity of six leukemogenic tyrosine kinases. Mol. Cell. Proteomics 7, 853–863 [DOI] [PubMed] [Google Scholar]
- 27. Tan H. T., Tan S., Lin Q., Lim T. K., Hew C. L., Chung M. C. (2008) Quantitative and temporal proteome analysis of butyrate-treated colorectal cancer cells. Mol. Cell. Proteomics 7, 1174–1185 [DOI] [PubMed] [Google Scholar]
- 28. Thomas P. D., Campbell M. J., Kejariwal A., Mi H., Karlak B., Daverman R., Diemer K., Muruganujan A., Narechania A. (2003) PANTHER: a library of protein families and subfamilies indexed by function. Genome Res. 13, 2129–2141 [DOI] [PMC free article] [PubMed] [Google Scholar]
- 29. van Iersel M. P., Kelder T., Pico A. R., Hanspers K., Coort S., Conklin B. R., Evelo C. (2008) Presenting and exploring biological pathways with PathVisio. BMC Bioinformatics 9, 399. [DOI] [PMC free article] [PubMed] [Google Scholar]
- 30. Pico A. R., Kelder T., van Iersel M. P., Hanspers K., Conklin B. R., Evelo C. (2008) WikiPathways: pathway editing for the people. PLoS Biol. 6, e184. [DOI] [PMC free article] [PubMed] [Google Scholar]
- 31. Kanehisa M., Goto S., Hattori M., Aoki-Kinoshita K. F., Itoh M., Kawashima S., Katayama T., Araki M., Hirakawa M. (2006) From genomics to chemical genomics: new developments in KEGG. Nucleic Acids Res. 34, D354–D357 [DOI] [PMC free article] [PubMed] [Google Scholar]
- 32. Kanehisa M., Goto S. (2000) KEGG: kyoto encyclopedia of genes and genomes. Nucleic Acids Res. 28, 27–30 [DOI] [PMC free article] [PubMed] [Google Scholar]
- 33. Kanehisa M., Goto S., Furumichi M., Tanabe M., Hirakawa M. (2010) KEGG for representation and analysis of molecular networks involving diseases and drugs. Nucleic Acids Res. 38, D355–D360 [DOI] [PMC free article] [PubMed] [Google Scholar]
- 34. Györffy B., Lanczky A., Eklund A. C., Denkert C., Budczies J., Li Q., Szallasi Z. (2010) An online survival analysis tool to rapidly assess the effect of 22,277 genes on breast cancer prognosis using microarray data of 1,809 patients. Breast Cancer Res. Treat. 123, 725–731 [DOI] [PubMed] [Google Scholar]
- 35. Bretschneider N., Kangaspeska S., Seifert M., Reid G., Gannon F., Denger S. (2008) E2-mediated cathepsin D (CTSD) activation involves looping of distal enhancer elements. Mol. Oncol. 2, 182–190 [DOI] [PMC free article] [PubMed] [Google Scholar]
- 36. Markićević M., Petrović A., Kanjer K., Nesković-Konstantinović Z., Nikolić-Vukosavujević D. (2008) Estrogen-regulated cut-off values of pS2 and cathepsin D expression in breast carcinomas. Adv. Exp. Med. Biol. 617, 341–348 [DOI] [PubMed] [Google Scholar]
- 37. Kristek J., Dmitrović B., Kurbel S., Sakić K., Krajinović Z., Blazicević V., Has B., Marjanović K. (2007) Tumor growth fraction, expression of estrogen and progesterone receptors, p53, bcl-2 and cathepsin D activity in primary ductal invasive breast carcinoma and their axillary lymph node metastases. Coll. Antropol. 31, 1043–1047 [PubMed] [Google Scholar]
- 38. Dunbier A. K., Anderson H., Ghazoui Z., Folkerd E. J., A'Hern R., Crowder R. J., Hoog J., Smith I. E., Osin P., Nerurkar A., Parker J. S., Perou C. M., Ellis M. J., Dowsett M. (2010) Relationship between plasma estradiol levels and estrogen-responsive gene expression in estrogen receptor-positive breast cancer in postmenopausal women. J. Clin. Oncol. 28, 1161–1167 [DOI] [PMC free article] [PubMed] [Google Scholar]
- 39. Corte M. D., Tamargo F., Alvarez A., Rodriguez J. C., Vázquez J., Sánchez R., Lamelas M. L., González L. O., Allende M. T., Garcia-Muñiz J. L., Fueyo A., Vizoso F. (2006) Cytosolic levels of TFF1/pS2 in breast cancer: Their relationship with clinical-pathological parameters and their prognostic significance. Breast Cancer Res. Treat. 96, 63–72 [DOI] [PubMed] [Google Scholar]
- 40. Ioachim E., Tsanou E., Briasoulis E., Batsis Ch, Karavasilis V., Charchanti A., Pavlidis N., Agnantis N. J. (2003) Clinicopathological study of the expression of hsp27, pS2, cathepsin D and metallothionein in primary invasive breast cancer. Breast 12, 111–119 [DOI] [PubMed] [Google Scholar]
- 41. Itoh T., Karlsberg K., Kijima I., Yuan Y. C., Smith D., Ye J., Chen S. (2005) Letrozole-, anastrozole-, and tamoxifen-responsive genes in MCF-7aro cells: a microarray approach. Mol. Cancer Res. 3, 203–218 [DOI] [PubMed] [Google Scholar]
- 42. Yang J., Jubb A. M., Pike L., Buffa F. M., Turley H., Baban D., Leek R., Gatter K. C., Ragoussis J., Harris A. L. (2010) The histone demethylase JMJD2B is regulated by estrogen receptor alpha and hypoxia, and is a key mediator of estrogen induced growth. Cancer Res. 70, 6456–6466 [DOI] [PMC free article] [PubMed] [Google Scholar]
- 43. Divekar S. D., Storchan G. B., Sperle K., Veselik D. J., Johnson E., Dakshanamurthy S., Lajiminmuhip Y. N., Nakles R. E., Huang L., Martin M. B. (2011) The role of calcium in the activation of estrogen receptor-alpha. Cancer Res. 71, 1658–1668 [DOI] [PMC free article] [PubMed] [Google Scholar]
- 44. Symmans W. F., Fiterman D. J., Anderson S. K., Ayers M., Rouzier R., Dunmire V., Stec J., Valero V., Sneige N., Albarracin C., Wu Y., Ross J. S., Wagner P., Theriault R. L., Arun B., Kuerer H., Hess K. R., Zhang W., Hortobagyi G. N., Pusztai L. (2005) A single-gene biomarker identifies breast cancers associated with immature cell type and short duration of prior breastfeeding. Endocr. Relat. Cancer 12, 1059–1069 [DOI] [PubMed] [Google Scholar]
- 45. Cascio S., Zhang L., Finn O. J. (2011) MUC1 protein expression in tumor cells regulates transcription of proinflammatory cytokines by forming a complex with nuclear factor-kappaB p65 and binding to cytokine promoters: importance of extracellular domain. J. Biol. Chem. 286, 42248–42256 [DOI] [PMC free article] [PubMed] [Google Scholar]
- 46. Backus J., Laughlin T., Wang Y., Belly R., White R., Baden J., Justus Min C., Mannie A., Tafra L., Atkins D., Verbanac K. M. (2005) Identification and characterization of optimal gene expression markers for detection of breast cancer metastasis. J. Mol. Diagn. 7, 327–336 [DOI] [PMC free article] [PubMed] [Google Scholar]
- 47. Viana Lde S., Affonso R. J., Jr., Silva S. R., Denadai M. V., Matos D., Salinas de Souza C., Waisberg J. (2013) Relationship between the Expression of the Extracellular Matrix Genes SPARC, SPP1, FN1, ITGA5 and ITGAV and Clinicopathological Parameters of Tumor Progression and Colorectal Cancer Dissemination. Oncology 84, 81–91 [DOI] [PubMed] [Google Scholar]
- 48. Francois P., Bertos N., Laferrière J., Sadekova S., Souleimanova M., Zhao H., Finak G., Meterissian S., Hallett M. T., Park M. (2012) Gene-expression profiling of microdissected breast cancer microvasculature identifies distinct tumor vascular subtypes. Breast Cancer Res. 14, R120. [DOI] [PMC free article] [PubMed] [Google Scholar]
- 49. Lu J. G., Li Y., Li L., Kan X. (2011) Overexpression of osteopontin and integrin alphav in laryngeal and hypopharyngeal carcinomas associated with differentiation and metastasis. J. Cancer Res. Clin. Oncol. 137, 1613–1618 [DOI] [PMC free article] [PubMed] [Google Scholar]
- 50. Nejjari M., Hafdi Z., Gouysse G., Fiorentino M., Béatrix O., Dumortier J., Pourreyron C., Barozzi C., D'Errico A., Grigioni W. F., Scoazec J. Y. (2002) Expression, regulation, and function of alpha V integrins in hepatocellular carcinoma: an in vivo and in vitro study. Hepatology 36, 418–426 [DOI] [PubMed] [Google Scholar]
- 51. Wong N. C., Mueller B. M., Barbas C. F., Ruminski P., Quaranta V., Lin E. C., Smith J. W. (1998) Alphav integrins mediate adhesion and migration of breast carcinoma cell lines. Clin. Exp. Metastasis 16, 50–61 [DOI] [PubMed] [Google Scholar]
- 52. Chen L., Yang S., Jakoncic J., Zhang J. J., Huang X. Y. (2010) Migrastatin analogues target fascin to block tumour metastasis. Nature 464, 1062–1066 [DOI] [PMC free article] [PubMed] [Google Scholar]
- 53. Hashimoto Y., Kim D. J., Adams J. C. (2011) The roles of fascins in health and disease. J. Pathol. 224, 289–300 [DOI] [PubMed] [Google Scholar]
- 54. Jayo A., Parsons M. (2010) Fascin: a key regulator of cytoskeletal dynamics. Int. J. Biochem. Cell Biol. 42, 1614–1617 [DOI] [PubMed] [Google Scholar]
- 55. Al-Alwan M., Olabi S., Ghebeh H., Barhoush E., Tulbah A., Al-Tweigeri T., Ajarim D., Adra C. (2011) Fascin is a key regulator of breast cancer invasion that acts via the modification of metastasis-associated molecules. PLoS One 6, e27339. [DOI] [PMC free article] [PubMed] [Google Scholar]
- 56. Vega F. M., Fruhwirth G., Ng T., Ridley A. J. (2011) RhoA and RhoC have distinct roles in migration and invasion by acting through different targets. J. Cell Biol. 193, 655–665 [DOI] [PMC free article] [PubMed] [Google Scholar]
- 57. Carreira S., Goodall J., Denat L., Rodriguez M., Nuciforo P., Hoek K. S., Testori A., Larue L., Goding C. R. (2006) Mitf regulation of Dia1 controls melanoma proliferation and invasiveness. Genes Dev. 20, 3426–3439 [DOI] [PMC free article] [PubMed] [Google Scholar]
- 58. Hirata H., Tatsumi H., Sokabe M. (2008) Mechanical forces facilitate actin polymerization at focal adhesions in a zyxin-dependent manner. J. Cell Sci. 121, 2795–2804 [DOI] [PubMed] [Google Scholar]
- 59. Vignjevic D., Kojima S., Aratyn Y., Danciu O., Svitkina T., Borisy G. G. (2006) Role of fascin in filopodial protrusion. J. Cell Biol. 174, 863–875 [DOI] [PMC free article] [PubMed] [Google Scholar]
- 60. Miller T. W., Balko J. M., Ghazoui Z., Dunbier A., Anderson H., Dowsett M., Gonzalez-Angulo A. M., Mills G. B., Miller W. R., Wu H., Shyr Y., Arteaga C. L. (2011) A gene expression signature from human breast cancer cells with acquired hormone independence identifies MYC as a mediator of antiestrogen resistance. Clin. Cancer Res. 17, 2024–2034 [DOI] [PMC free article] [PubMed] [Google Scholar]
- 61. Chen S. (2011) An “omics” approach to determine the mechanisms of acquired aromatase inhibitor resistance. OMICS 15, 347–352 [DOI] [PMC free article] [PubMed] [Google Scholar]
- 62. McLeskey S. W., Zhang L., El-Ashry D., Trock B. J., Lopez C. A., Kharbanda S., Tobias C. A., Lorant L. A., Hannum R. S., Dickson R. B., Kern F. G. (1998) Tamoxifen-resistant fibroblast growth factor-transfected MCF-7 cells are cross-resistant in vivo to the antiestrogen ICI 182,780 and two aromatase inhibitors. Clin. Cancer Res. 4, 697–711 [PubMed] [Google Scholar]
- 63. Miller W. R., Anderson T. J., White S., Evans D., Krause A., Dixon J. M. (2005) Growth factor signalling in clinical breast cancer and its impact on response to conventional therapies: the Edinburgh experience. Endocr. Relat. Cancer 12, S119–S123 [DOI] [PubMed] [Google Scholar]
- 64. Ellis M. J., Tao Y., Young O., White S., Proia A. D., Murray J., Renshaw L., Faratian D., Thomas J., Dowsett M., Krause A., Evans D. B., Miller W. R., Dixon J. M. (2006) Estrogen-independent proliferation is present in estrogen-receptor HER2-positive primary breast cancer after neoadjuvant letrozole. J. Clin. Oncol. 24, 3019–3025 [DOI] [PubMed] [Google Scholar]
- 65. Zhang G. J., Kimijima I., Tsuchiya A., Abe R. (1998) The role of bcl-2 expression in breast carcinomas (Review). Oncol. Rep. 5, 1211–1216 [DOI] [PubMed] [Google Scholar]
- 66. Lee K. H., Im S. A., Oh D. Y., Lee S. H., Chie E. K., Han W., Kim D. W., Kim T. Y., Park I. A., Noh D. Y., Heo D. S., Ha S. W., Bang Y. J. (2007) Prognostic significance of bcl-2 expression in stage III breast cancer patients who had received doxorubicin and cyclophosphamide followed by paclitaxel as adjuvant chemotherapy. BMC Cancer 7, 63. [DOI] [PMC free article] [PubMed] [Google Scholar]
- 67. Nadler Y., Camp R. L., Giltnane J. M., Moeder C., Rimm D. L., Kluger H. M., Kluger Y. (2008) Expression patterns and prognostic value of Bag-1 and Bcl-2 in breast cancer. Breast Cancer Res. 10, R35. [DOI] [PMC free article] [PubMed] [Google Scholar]
- 68. Tawfik K., Kimler B. F., Davis M. K., Fan F., Tawfik O. (2012) Prognostic significance of Bcl-2 in invasive mammary carcinomas: a comparative clinicopathologic study between “triple-negative” and non-“triple-negative” tumors. Hum. Pathol. 43, 23–30 [DOI] [PubMed] [Google Scholar]
- 69. Arumugam T., Simeone D. M., Van Golen K., Logsdon C. D. (2005) S100P promotes pancreatic cancer growth, survival, and invasion. Clin. Cancer Res. 11, 5356–5364 [DOI] [PubMed] [Google Scholar]
- 70. Fuentes M. K., Nigavekar S. S., Arumugam T., Logsdon C. D., Schmidt A. M., Park J. C., Huang E. H. (2007) RAGE activation by S100P in colon cancer stimulates growth, migration, and cell signaling pathways. Dis. Colon Rectum. 50, 1230–1240 [DOI] [PubMed] [Google Scholar]
- 71. Arumugam T., Simeone D. M., Schmidt A. M., Logsdon C. D. (2004) S100P stimulates cell proliferation and survival via receptor for activated glycation end products (RAGE). J. Biol. Chem. 279, 5059–5065 [DOI] [PubMed] [Google Scholar]
- 72. Yamamoto T., Gotoh M., Kitajima M., Hirohashi S. (1993) Thymosin beta-4 expression is correlated with metastatic capacity of colorectal carcinomas. Biochem. Biophys. Res. Commun. 193, 706–710 [DOI] [PubMed] [Google Scholar]
- 73. Kobayashi T., Okada F., Fujii N., Tomita N., Ito S., Tazawa H., Aoyama T., Choi S. K., Shibata T., Fujita H., Hosokawa M. (2002) Thymosin-beta4 regulates motility and metastasis of malignant mouse fibrosarcoma cells. Am. J. Pathol. 160, 869–882 [DOI] [PMC free article] [PubMed] [Google Scholar]
- 74. Wang W. S., Chen P. M., Hsiao H. L., Ju S. Y., Su Y. (2003) Overexpression of the thymosin beta-4 gene is associated with malignant progression of SW480 colon cancer cells. Oncogene 22, 3297–3306 [DOI] [PubMed] [Google Scholar]
- 75. Xu Y. F., Yu S. N., Lu Z. H., Liu J. P., Chen J. (2011) Fascin promotes the motility and invasiveness of pancreatic cancer cells. World J. Gastroenterol. 17, 4470–4478 [DOI] [PMC free article] [PubMed] [Google Scholar]
- 76. Snyder M., Huang X. Y., Zhang J. J. (2011) Signal transducers and activators of transcription 3 (STAT3) directly regulates cytokine-induced fascin expression and is required for breast cancer cell migration. J. Biol. Chem. 286, 38886–38893 [DOI] [PMC free article] [PubMed] [Google Scholar]
- 77. Darnel A. D., Behmoaram E., Vollmer R. T., Corcos J., Bijian K., Sircar K., Su J., Jiao J., Alaoui-Jamali M. A., Bismar T. A. (2009) Fascin regulates prostate cancer cell invasion and is associated with metastasis and biochemical failure in prostate cancer. Clin. Cancer Res. 15, 1376–1383 [DOI] [PubMed] [Google Scholar]
- 78. Hashimoto Y., Ito T., Inoue H., Okumura T., Tanaka E., Tsunoda S., Higashiyama M., Watanabe G., Imamura M., Shimada Y. (2005) Prognostic significance of fascin overexpression in human esophageal squamous cell carcinoma. Clin. Cancer Res. 11, 2597–2605 [DOI] [PubMed] [Google Scholar]
- 79. Yoder B. J., Tso E., Skacel M., Pettay J., Tarr S., Budd T., Tubbs R. R., Adams J. C., Hicks D. G. (2005) The expression of fascin, an actin-bundling motility protein, correlates with hormone receptor-negative breast cancer and a more aggressive clinical course. Clin. Cancer Res. 11, 186–192 [PubMed] [Google Scholar]
- 80. Radel C., Rizzo V. (2005) Integrin mechanotransduction stimulates caveolin-1 phosphorylation and recruitment of Csk to mediate actin reorganization. Am. J. Physiol. Heart Circ. Physiol. 288, H936-H945 [DOI] [PubMed] [Google Scholar]
- 81. Grande-Garcia A., Echarri A., de Rooij J., Alderson N. B., Waterman-Storer C. M., Valdivielso J. M., del Pozo M. A. (2007) Caveolin-1 regulates cell polarization and directional migration through Src kinase and Rho GTPases. J. Cell Biol. 177, 683–694 [DOI] [PMC free article] [PubMed] [Google Scholar]
- 82. Joshi B., Strugnell S. S., Goetz J. G., Kojic L. D., Cox M. E., Griffith O. L., Chan S. K., Jones S. J., Leung S. P., Masoudi H., Leung S., Wiseman S. M., Nabi I. R. (2008) Phosphorylated caveolin-1 regulates Rho/ROCK-dependent focal adhesion dynamics and tumor cell migration and invasion. Cancer Res. 68, 8210–8220 [DOI] [PubMed] [Google Scholar]
- 83. Pinilla S. M., Honrado E., Hardisson D., Benitez J., Palacios J. (2006) Caveolin-1 expression is associated with a basal-like phenotype in sporadic and hereditary breast cancer. Breast Cancer Res. Treat 99, 85–90 [DOI] [PubMed] [Google Scholar]
- 84. Savage K., Lambros M. B., Robertson D., Jones R. L., Jones C., Mackay A., James M., Hornick J. L., Pereira E. M., Milanezi F., Fletcher C. D., Schmitt F. C., Ashworth A., Reis-Filho J. S. (2007) Caveolin 1 is overexpressed and amplified in a subset of basal-like and metaplastic breast carcinomas: a morphologic, ultrastructural, immunohistochemical, and in situ hybridization analysis. Clin. Cancer Res. 13, 90–101 [DOI] [PubMed] [Google Scholar]
- 85. Brandt D. T., Baarlink C., Kitzing T. M., Kremmer E., Ivaska J., Nollau P., Grosse R. (2009) SCAI acts as a suppressor of cancer cell invasion through the transcriptional control of beta1-integrin. Nat. Cell Biol. 11, 557–568 [DOI] [PubMed] [Google Scholar]
- 86. Li J., Tu Y., Wen J., Yao F., Wei W., Sun S. (2010) Role for ezrin in breast cancer cell chemotaxis to CCL5. Oncol. Rep. 24, 965–971 [DOI] [PubMed] [Google Scholar]
- 87. Sahai E., Marshall C. J. (2003) Differing modes of tumour cell invasion have distinct requirements for Rho/ROCK signalling and extracellular proteolysis. Nat. Cell Biol. 5, 711–719 [DOI] [PubMed] [Google Scholar]
- 88. Bartkowiak K., Wieczorek M., Buck F., Harder S., Moldenhauer J., Effenberger K. E., Pantel K., Peter-Katalinic J., Brandt B. H. (2009) Two-dimensional differential gel electrophoresis of a cell line derived from a breast cancer micrometastasis revealed a stem/ progenitor cell protein profile. J. Proteome Res. 8, 2004–2014 [DOI] [PubMed] [Google Scholar]
- 89. Austermann J., Nazmi A. R., Muller-Tidow C., Gerke V. (2008) Characterization of the Ca2+ -regulated ezrin-S100P interaction and its role in tumor cell migration. J. Biol. Chem. 283, 29331–29340 [DOI] [PMC free article] [PubMed] [Google Scholar]
- 90. Taube J. H., Herschkowitz J. I., Komurov K., Zhou A. Y., Gupta S., Yang J., Hartwell K., Onder T. T., Gupta P. B., Evans K. W., Hollier B. G., Ram P. T., Lander E. S., Rosen J. M., Weinberg R. A., Mani S. A. (2010) Core epithelial-to-mesenchymal transition interactome gene-expression signature is associated with claudin-low and metaplastic breast cancer subtypes. Proc. Natl. Acad. Sci. U.S.A. 107, 15449–15454 [DOI] [PMC free article] [PubMed] [Google Scholar]
- 91. Sarrio D., Rodriguez-Pinilla S. M., Hardisson D., Cano A., Moreno-Bueno G., Palacios J. (2008) Epithelial-mesenchymal transition in breast cancer relates to the basal-like phenotype. Cancer Res. 68, 989–997 [DOI] [PubMed] [Google Scholar]
- 92. May C. D., Sphyris N., Evans K. W., Werden S. J., Guo W., Mani S. A. (2011) Epithelial-mesenchymal transition and cancer stem cells: a dangerously dynamic duo in breast cancer progression. Breast Cancer Res. 13, 202. [DOI] [PMC free article] [PubMed] [Google Scholar]
- 93. Creighton C. J., Li X., Landis M., Dixon J. M., Neumeister V. M., Sjolund A., Rimm D. L., Wong H., Rodriguez A., Herschkowitz J. I., Fan C., Zhang X., He X., Pavlick A., Gutierrez M. C., Renshaw L., Larionov A. A., Faratian D., Hilsenbeck S. G., Perou C. M., Lewis M. T., Rosen J. M., Chang J. C. (2009) Residual breast cancers after conventional therapy display mesenchymal as well as tumor-initiating features. Proc. Natl. Acad. Sci. U.S.A. 106, 13820–13825 [DOI] [PMC free article] [PubMed] [Google Scholar]
- 94. Huang H. C., Hu C. H., Tang M. C., Wang W. S., Chen P. M., Su Y. (2007) Thymosin beta4 triggers an epithelial-mesenchymal transition in colorectal carcinoma by upregulating integrin-linked kinase. Oncogene 26, 2781–2790 [DOI] [PubMed] [Google Scholar]
- 95. Gupta A., Mehta R., Alimirah F., Peng X., Murillo G., Wiehle R., Mehta R. G. (2013) Efficacy and mechanism of action of Proellex, an antiprogestin in aromatase overexpressing and Letrozole resistant T47D breast cancer cells. J. Steroid Biochem. Mol. Biol. 133, 30–42 [DOI] [PubMed] [Google Scholar]
Associated Data
This section collects any data citations, data availability statements, or supplementary materials included in this article.