

Abstract
Keratinocytes account for 95% of all cells of the epidermis, the stratified squamous epithelium forming the outer layer of the skin, in which a significant number of skin diseases takes root. Immortalized keratinocyte cell lines are often used as research model systems providing standardized, reproducible, and homogenous biological material. Apart from that, primary human keratinocytes are frequently used for medical studies because the skin provides an important route for drug administration and is readily accessible for biopsies. However, comparability of these cell systems is not known. Cell lines may undergo phenotypic shifts and may differ from the in vivo situation in important aspects. Primary cells, on the other hand, may vary in biological functions depending on gender and age of the donor and localization of the biopsy specimen. Here we employed metabolic labeling in combination with quantitative mass spectrometry-based proteomics to assess A431 and HaCaT cell lines for their suitability as model systems. Compared with cell lines, comprehensive profiling of the primary human keratinocyte proteome with respect to gender, age, and skin localization identified an unexpected high proteomic consistency. The data were analyzed by an improved ontology enrichment analysis workflow designed for the study of global proteomics experiments. It enables a quick, comprehensive and unbiased overview of altered biological phenomena and links experimental data to literature. We guide through our workflow, point out its advantages compared with other methods and apply it to visualize differences of cell lines compared with primary human keratinocytes.
The epidermis is the outermost layer of the skin protecting the entire organism against insults from the external environment and providing an impenetrable barrier against fluid and electrolyte loss (1). To maintain integrity and homeostasis in its very exposed position, the epidermis relies on remarkable capacities, such as complete self-renewal, rapid wound regeneration, and tight adhesion to the underlying basement membrane. Keratinocytes account for 95% of all cells of the epidermis and hence are of high interest for studying epidermis functions. They are employed, among others, in research on epidermis acidification (2), DNA degradation in skin (3), local immune response in the skin (4), fatty acid transport and metabolism (5), cell-regeneration (6), and differentiation (7–10), on the role of stem cells in tissue homeostasis and tumor formation (11), as well as integrin functions (12, 13) and cell-adhesion (14). However, the short keratinocyte life cycle of about 4 weeks requires a steady supply of fresh tissue samples, and a concern is that varying constitutional factors such as age, gender, and anatomic site may compromise experimental results. Many skin properties have been examined with respect to such factors and an impact has been observed on epidermal thickness (15), epidermal nerve fiber density (16), skin surface pH (17), protein absorption ability (18), stratum corneum hydration (17, 19), melanin index, and skin elasticity (20). These properties arise from the interplay of many cell types in the tissue context, most importantly between dermal fibroblasts and epidermal keratinocytes. It is very likely that keratinocytes play an important role in many of these phenomena and consequently also exhibit differences as a function of constitutional factors.
Next to primary cells, cell lines and culture systems are routinely used in biological and medical research, immortalized cell lines offering many advantages such as easy handling and unlimited growth. However, cell lines may differ substantially from the respective healthy tissue and, accordingly, in many cases it is unclear how well these cell lines mimic the situation in vivo (21). To study proteome alterations of primary human keratinocytes and to evaluate the suitability of keratinocyte-like cell line models we conducted an unbiased global mass spectrometry (MS)-based proteome analysis. Such protein abundance analyses are usually combined with ontology enrichment tests to gain an unbiased and comprehensive overview of altered biological functions. Two general approaches exist. The over-representation approach divides the data set into a discrete number of quantiles, for example, three or five, and assesses significance of over-representation of specific gene sets using the hypergeometric distribution or its binomial approximation. Most commonly the Fischer's exact test is used, because the significance of the deviation from the null hypothesis can be calculated exactly even for very small gene sets (22). However, it ignores all genes that are outside of the respective quantile and therefore its results are highly dependent on the choice of cutoff. The aggregate score approach, of which gene set enrichment analysis (GSEA) is the most popular method, assigns scores to each gene set considering all the gene specific scores for that set. It avoids all drawbacks entailed by a cutoff, but it depends on the Kolmogorov-Smirnov test, which is known for lack of sensitivity and limited practical use (23). For gene sets represented by less than 15 genes in the data set its statistical validity substantially drops and its use is not recommended. This would exclude ∼70% of the Gene Ontology (GO)1 entries from the present analysis. Thus, it is particularly unfavorable for proteomic studies with sub-comprehensive coverage for which the number of eligible gene sets is reduced compared with transcriptome analyses. A third ontology enrichment approach relying on a combination of t test and χ2-test achieves comparable results to the aforementioned methods and requires practically no computation time (23). But as the other approaches it is not able to reflect significance of over-representation at different extents of regulation. However, we regard this essential for the assessment of proteomic variations of cell lines, as two third of the proteome varies across cell lines (24). To choose the best model system, it is of great value to know the extent to which the observed biological functions are regulated.
Here, we introduce a sliding window ontology enrichment analysis that combines the advantages of the over-representation approach and the aggregate score approach and additionally visualizes significance of over-representation for different extents of regulation. It is the core of a five-step bioinformatics data processing workflow designed to provide a quick and comprehensive overview of altered biological phenomena in unbiased, global proteomics experiments. We use it to enable the reader to make an informed choice among model systems for her/his specific experiments.
In the first part, we explain the workflow by comparing proteome differences between A431 cells and primary keratinocytes. A431 cells originate from an epidermoid carcinoma, are known for abnormally high expression of epidermal growth factor receptor and concomitant lack of p53 (25, 26), and exhibit a classical cancer phenotype (27–29). In the second part, we apply our workflow to study proteome differences between human adult low calcium high temperature (HaCaT) cells (30) and primary keratinocytes. For dermatological research the non-tumorous HaCaT cells are a favored keratinocyte model cell line, because optimal culture conditions compensate their defects to such an extent that their behavior closely resembles that of normal human keratinocytes. Despite the altered and unlimited growth potential, HaCaT cells, similar to normal keratinocytes, reform an orderly structured and differentiated epidermal tissue when transplanted onto nude mice (30). Hence, HaCaT cells have proved to be useful to determine, inter alia, skin toxicity or irritancy of various agents (31–35), to investigate the mechanisms of cutaneous allergic reactions, or of cell interactions in inflammatory, or neoplastic processes (36), as well as effects of UV-irradiation and reactive oxygen species (37–39). Next to the comparison to HaCaT cells we investigated the influence of age, gender, and skin localization on the proteome of primary human keratinocytes.
EXPERIMENTAL PROCEDURES
Isolation of Primary Keratinocytes
Primary human keratinocytes were isolated from the skin of six healthy individuals. The local ethical committee approved the study, and informed consent was obtained from the donors. After excess fat and blood was removed from the tissue, it was rinsed three times with phosphate-buffered saline without Ca2+, Mg2+ (Invitrogen, Karlsruhe, Germany) supplemented with 0.5% Ciprobay (Bayer, Leverkusen, Germany), and transferred to a sterile Petri dish. For the isolation of primary keratinocytes the sample was cut into 5 × 5 mm pieces, and incubated in Trypsin/EDTA solution (0.05/0.02% w/v, Pan Biotech, Aidenbach, Germany) at 37 °C. After 60 min the samples were transferred into a solution of phosphate-buffered saline with 10% fetal calf serum (PAA, Coelbe, Germany) to inhibit trypsin. The epidermis was separated from the dermis, and torn into small pieces using forceps. The cell suspension was pelleted at 1000 × g, resuspended in keratinocyte serum free medium (supplemented with pituitary gland extract and EGF; Invitrogen), containing 0.5% Ciprobay (10 mg/L), and plated into a T25 primary tissue culture flask. Medium was supplied three times a week. Keratinocytes were passaged once a week and grown to maximum confluence of 80%. All experiments were performed minimally twice, starting from independently thawed cell stocks.
Stable Isotope Labeling by Amino Acids in Cell Culture
Primary human keratinocytes, and HaCaT cells were cultured in keratinocyte growth medium (-arginine, -lysine) (Promocell, Heidelberg, Germany), supplemented with bovine pituitary gland extract, EGF, insulin, hydrocortisone, epinephrine, transferrin, CaCl2, 0.5% Ciprobay (10 mg/L), 210 mg/L l-arginine (Sigma-Aldrich, Seelze, Germany), and 63 mg/L l-lysine (Sigma-Aldrich) for the not labeled condition (10 cm cell culture dishes) (40). A431 cells (41) were cultured in DMEM without arginine and lysine (Thermo Scientific, Langenselbold, Germany) supplemented with 10% dialyzed FCS (Invitrogen). Cells were “heavy” labeled for 14 days with 210 mg/L L-arginine-13C6-15N4 (Arg10; Sigma-Aldrich) and 63 mg/L L-lysine-13C6-15N2 (Lys8; Silantes, Munich, Germany) or “medium” with 210 mg/L L-arginine-13C6 (Arg6; Sigma-Aldrich) and 63 mg/L L-lysine-2H4 (Lys4; Silantes, Munich, Germany) (42, 43). Cells were harvested by incubation in trypsin/EDTA for 5 min at 37 °C, spun down at 300 × g for 5 min, and resuspended in accutase solution (Promocell, Heidelberg, Germany) to inhibit trypsin. Cells were washed twice with PBS, counted six times using the CASY Cell Counter (Model TT, Innovatis, Reutlingen, Germany), pelleted, and frozen at −80 °C.
Western Blot
Cells were normalized to cell count and whole cell lysates were generated by addition of SDS loading buffer. Benzonase (Merck, Darmstadt, Germany) was added to digest DNA. Samples were separated by SDS-PAGE and blotted onto nitrocellulose using wet blot systems. Primary antibodies were from Santa Cruz Biotechnology (Heidelberg, Germany): anti-laminin γ-2 (# sc-55457), anti-laminin β-3 (# sc-7651), anti-laminin α-3 (# sc-16585), and anti-actin (#sc-47778).
Cell Migration Assay
Cell migration was measured with the xCELLigence Real-Time Cell Analyzer DP (Roche Diagnostics, Mannheim, Germany). Specific migration CIM-plates were filled with medium and HaCaT cells and NHK were seeded (6 × 10⁴ cells/well) into the top chamber wells of the CIM-plate according to the manufacturer instructions. Cell migration was monitored for the first 8 h every 15 min and then every 30 min until 24 h by changes of the impedance signal caused by cells that crossed the membrane from the top to the bottom chamber (44). For analysis of migration, the slope was measured for the first 12 h.
Cell Death Assay
Cell death was assessed by the MTT (3-(4,5-dimethylthiazol-2-yl)-2,5-diphenyltetrazolium bromide) assay. NHK or HaCaT cells (4 × 10⁴ cells/well) were seeded in 96-well plates and, after attachment to the plate (4–16 h), were treated with 0.1–10 μm of hydrogen peroxide (H2O2), using as controls KSFM for NHK or DMEM for HaCaT cells. After treatment for 24 h the media were removed and replaced by 100 μl of medium containing 1 mg of MTT/ml. The plates were incubated for 1 h at 37 °C. After removal of nonincorporated dye, isopropanol p.a. was added and the plate was read at 570 nm in a microplate reader (Tecan Group Ltd., Männedorf, Switzerland). Cell viability was calculated as a percentage of control, which was previously normalized as 100% viability. Curves were fit with a dose response nonlinear regression of log (inhibitor) versus variable slope, using software GraphPad Prism 5 (GraphPad Software Inc., San Diego, CA).
Protein Digestion and Fractionation
Harvested cells were lysed in SDS-loading buffer. Benzonase (Merck, Darmstadt, Germany) was added before samples were reduced by dithiotreitol (1 mm) (Sigma-Aldrich) for 30 min at 56 °C and alkylated using iodoacetamide (5.5 mm) (Sigma-Aldrich) for 30 min at 25 °C in the darkness. Protein mixtures were separated by SDS-PAGE (4-12% Bis-Tris mini gradient gel, NuPAGE (Invitrogen)), gel lanes were cut into 10 equal slices, samples in-gel digested using trypsin (Promega, Mannheim, Germany) (45, 46) and resulting peptide mixtures were processed on STAGE tips as described (46).
Mass Spectrometry
Mass spectrometric measurements were performed on LTQ Orbitrap XL mass spectrometer (Thermo Fisher Scientific, Bremen, Germany) coupled to an Agilent 1200 nanoflow-HPLC (Agilent Technologies GmbH, Waldbronn, Germany). HPLC-column tips (fused silica) with 75 μm inner diameter (New Objective, Woburn, MA, USA) were self packed with Reprosil-Pur 120 ODS-3 (Dr. Maisch, Ammerbuch, Germany) to a length of 20 cm. Samples were applied directly onto the column without pre-column. A gradient of A [0.5% acetic acid (high purity, LGC Promochem, Wesel, Germany) in water] and B [0.5% acetic acid in 80% acetonitrile (LC-MS grade, Wako, Germany) in water] with increasing organic proportion was used for peptide separation (loading of sample with 2% B; separation ramp: from 10% to 30% B within 80 min). The flow rate was 250 nl/min and for sample application 500 nl/min. The mass spectrometer was operated in the data-dependent mode and switched automatically between MS (max. of 1 × 10⁶ ions) and MS/MS. Each MS scan was followed by a maximum of five MS/MS scans in the linear ion trap using collision energy of 35% and a target value of 5000. Parent ions with charge states from z = 1 and unassigned charge states were excluded for fragmentation. The mass range for MS was m/z = 370 to 2000. The resolution was set to 60,000. Mass-spectrometric parameters were as follows: spray voltage 2.3 kV; no sheath and auxiliary gas flow; ion-transfer tube temperature 125 °C.
Identification of Proteins, and Protein Ratio Assignment Using MaxQuant
The MS raw data files were uploaded into the MaxQuant software (version 1.2.2.5.) (47), which performs peak detection, stable isotope labeling by amino acids in cell culture (SILAC)-pair detection, and generates peak lists of mass error corrected peptides using the following parameters: carbamidomethylcysteine was set as fixed modification, methionine oxidation and protein amino-terminal acetylation were set as variable modifications. Double or triple SILAC were chosen as quantitation mode. Three miss cleavages were allowed, enzyme specificity was trypsin/p + DP, and the MS/MS tolerance was set to 0.5 Da. Peak lists were searched by Andromeda (48) for peptide identification using a IPI human decoy database containing common contaminants such as keratins and enzymes used for in-gel digestion (based on IPI human version 3.68, 116276 entries). The average mass precision of identified peptides was in general less than 1 ppm after recalibration. Peptide lists were further used by MaxQuant to identify and relatively quantify proteins using the following parameters: peptide, and protein false discovery rates were set to 0.01, maximum peptide posterior error probability (PEP) was set to 1, minimum peptide length was set to 6, the PEP was based on Andromeda score, minimum number peptides for identification and quantitation of proteins was set to two of which one must be unique, and identified proteins have been re-quantified.
Bioinformatic Analysis - Normalization and Filter
Primary keratinocytes from six different donors were SILAC labeled and paired in 5 separate SILAC experiments. Because of limited amount of sample, use of one sample as reference to enable comparability among all samples was not possible. Nevertheless, one sample in each experiment was paired in at least two different combinations in a way that allowed normalization of all samples to one reference. For marker identification with respect to the factors age, gender, and skin localization we grouped samples accordingly and performed a statistical tests using LIMMA for R (49). We considered only proteins with a Benjamini-Hochberg corrected LIMMA p value below 0.05 for the following gene ontology and KEGG gene set enrichment test. In the cell line comparison we normalized primary cells and cell lines to one reference and calculated LIMMA p values considering the variance between primary cells as well as cell lines for maximum stringency.
Bioinformatic Analysis - Noise Extent Indicator
We derive a measure of the overall noise from two biological replicates of a global experiment. For each entity E with two measuring points E1 and E2 we calculate the orthogonal distance D of their coordinates to the line through origin by
and use the 98% quantile D98 of all values as noise extent indicator. In a scatter plot this value refers to the extent of the value cloud orthogonal to the line through origin.
Bioinformatic Analysis - Sliding Window Gene Ontology Enrichment Analysis
To visualize both the enrichment of gene sets and their extent of regulation we calculate an enrichment score (-log(p)) based on results of the Fisher's exact test p values (using Perseus) for over 100 overlapping bins with stepwise decreasing cutoffs instead of the common 3 or 5 quantiles with one arbitrary cutoff. This score reflects enrichment of gene sets normalized to gene set size and test bin size such that values of different bins and gene sets become comparable to each other. To limit results to biologically relevant findings, we filtered detected annotations by extent of regulation and number of enriched testing windows before multiple testing corrections. Because of statistical dependence of overlapping bins, only one enrichment score of each gene set can be employed in Bonferroni multiple testing correction. We determined an enrichment score cutoff for all tested bins and gene sets such that the minimum score of each remaining gene set above this cutoff still meets the chosen significance cutoff of p ≤ 0.05 after Bonferroni correction. Significance of higher enrichment scores can be relatively inferred but not exactly stated in this procedure. The overlapping test windows were formed by setting the outer bin border to the very maximum (or minimum respectively) of the log2 transformed SILAC ratios. The inner bin border of the “first” bin was set to zero such that the “first” bin covers all up-regulated (or down-regulated) proteins. Although the outer bin border always remained at the very maximum (minimum), the inner bin border increased (decreased) in “subsequent” bins of 0.1 width (log2 SILAC ratio) until the very maximum (or minimum). Enrichment scores are visualized in a heat map as 0.1 spanning boxes at the inner border of each bin. Although each heat map box corresponds to all proteins more strongly regulated, the heat map still reflects relative local gene set accumulation in a 0.1 step resolution such that the distribution of the underlying gene set (relative to the whole dataset) becomes apparent. Besides the mere overrepresentation of gene sets among regulated proteins, this approach also closely reflects their distribution and sheds light on the strength of regulation. To exclude the possibility of false positives in small testing windows at the very leading edge we set the minimum window size to 20 proteins. Respective Excel scripts are provided in supplemental material.
Bioinformatic Analysis - Automated Literature Ontology Search
To contrast the results with the literature, an automated unbiased literature search was performed. All titles and abstract containing “HaCaT” or “A431” were compiled and searched for a keyword list containing 13,508 GO terms, KEGG terms plus a self generated list of “literature ontology terms” (LO terms). We generated LO terms by removing word combinations from GO terms and KEGG terms that are unlikely to be found in a running text. We removed: “[*]”; “[”; “]”; “(*)”; “(”; “)”; “+”; “:,”; “: ”; “:-”; “ … - ”; “ * process”; “ activity”, “ metabolic”; “ anabolic”; “ catabolic”; “ synthetic”; “ biosynthetic”; “'de novo ' ”; “:*:”; “activation of ”; “by *”; “negative regulation of ”; “positive regulation of ”; “regulation of ”; “cellular.” In this way a LO term “acetyl-CoA” is formed containing all genes from “acetyl-CoA biosynthetic process,” “acetyl-CoA catabolic process,” and “acetyl-CoA metabolic process.” The literature ontology “Acetyl-CoA” is close to the original terms with respect to semantic meaning and enclosed genes but more likely to be found in a running text and is as well suitable for the “functional similarity analysis” described in the following. A respective R script is provided in supplemental material.
Bioinformatic Analysis - Functional Similarity Analysis
As described in (50, 51) we performed a functional similarity analysis to group related terms, to link experimental findings to literature findings, and visualize and discern distinct biological phenomena. Each gene set is paired with all others and the ratio of shared genes to the number of genes in the smaller term is determined. The resulting similarity matrix is clustered hierarchically using Perseus (47, 48), row distance set to correlation, row linkage set to complete. The resulting clusters are used to define biological phenomena from similar terms. A respective R script is provided in supplemental material.
RESULTS
A Bioinformatics Workflow for Hypothesis Free, Global Proteomics Studies
We designed a five-step workflow for the unbiased, comprehensive analysis of “omics” data, in which we implemented four improvements compared with classical ontology enrichment analyses (step 2–5; Fig. 1A, supplemental Fig. S1). The following passage will guide through the workflow and explain and exemplify its advantages on the basis of the SILAC-based proteomic comparison of A431 cells to primary keratinocytes (Fig. 1B).
Fig. 1.

A, Bioinformatics data processing pipeline. (1) Global quantitative proteomics data is generated. (2) The experimental noise is calculated and significance tests of reproducible quantifications of individual proteins are performed. (3) The sliding window ontology enrichment analysis highlights the extent and significance of enrichment of protein groups. (4) An automated ontology literature mining lists the occurrences of keywords from ontology databases in relevant literature. (5) Experimentally detected alterations and literature occurrences are grouped by hierarchical clustering according to gene member overlap. B, Quantitative proteome differences between A431 cells and primary keratinocytes. (1) The bottom panel depicts a histogram of log2 transformed protein SILAC ratios. The whole dataset is highlighted in light blue (2875 proteins), LIMMA filtered proteins in dark blue (1149 proteins). (2) Experimental noise is indicated by vertical lines. (3) The upper main panel represents a heatmap indicating enrichment and regulation of altered ontology groups. 2101 annotations were detected as overrepresented of which 96 remained after limiting results to gene sets that meet the p < 0.05 significance cutoff (Bonferroni corrected) with at least five test windows above the 98% noise extent. 75 annotations were mentioned in literature more than 20 times. Both, experimental results and literature search, summed up to 158 annotations relevant to A431 in total from which 16 (a-p) underlying biological phenomena emerged by functional similarity analysis. Terms with pronounced literature occurrences or regulation are annotated and marked by diamonds. Employed source databases are indicated by two-letter abbreviation (CC: GO cellular compartment, BP: GO biological process, KG: Kyoto encyclopedia of genes and genomes, LO: literature ontology). (4) The upper left panel exemplifies literature occurrences of ontology terms depicted as yellow bars in log10 scale, (5) followed by hierarchical clusters of detected ontology terms. Clusters are used to define altered biological phenomena from protein groups.
Step 1: Omics Data is Generated
Step 2: Determination of a Noise Extent Indicator
The choice of a cutoff is critical for enrichment analyses, because it is always a tradeoff between statistical power and dilution of enrichment. Larger bins achieve higher statistical power but also include more of the less, possibly randomly, regulated proteins at the expense of enrichment. Nevertheless, a cutoff is often arbitrarily set generating three (40)or five (22) quantiles. To define a protein as regulated and discriminate biologically meaningful signals from background, the cutoff should be oriented at the extent of experimental noise. We calculated a noise extent indicator in which we obtained a measure for noise of the actual experiment from two biological replicates without the need for an additional control experiment (Experimental Procedures). This measure is not to be confused with a confidence interval and thus is not narrowing with increasing number of replicates (supplemental Fig. S2). We see three important implications for the noise extent indicator. First, in a conventional three or five quantile approach it can serve as a sensible rational for the choice of a fixed cutoff. Second, in our workflow, which is independent from a fixed cutoff, it aids in interpretation by setting an observed signal in relation to the overall experimental noise and provides a rationale to estimate relevance of observed alterations. Third, it proved to be more sensible than the commonly used correlation coefficient to estimate the reproducibility of replicate experiments. A correlation coefficient returns a measure of the linear dependence between two variables, whereas the noise extent indicator returns the maximum noise extent of a given data-noise quantile. Visually described, a correlation coefficient considers length and width of the usually oval cloud on a scatter plot of two replicates, whereas the noise extent indicator considers only the width. The misapplication of a correlation coefficient becomes apparent when no difference is observed in a comparative experiment and the scatter plot consequently displays a round shaped cloud. In this case a correlation coefficient returns zero even for reproducible quantification, whereas the noise extent indicator still reflects a measure of the scattering, unaltered by the absence of regulated proteins.
Step 3: Sliding Window Enrichment Analysis
To minimize random effects in the enrichment analysis, we filtered protein ratios of replicate experiments using Linear models for microarray data (LIMMA) (49) with a 0.05 p value cutoff. LIMMA performs a moderated t test and takes the variance of all genes into account, which proved to be of value for transcriptome data analysis. For detection of altered gene sets we propose a sliding window ontology enrichment analysis that combines the advantages of the over-representation and aggregation score approaches and additionally resolves the extent of gene set regulation (Experimental Procedures). This approach detects a higher number and more specific gene sets than common approaches because the stepwise narrowing bins make it independent from a fixed cutoff but still allow the application of Fischer's exact test, for which all test bin sizes and gene set sizes are eligible. Compared with GSEA roughly twice as many genes sets are detected as significantly altered. However, the overlap of common identified sets is only ca. 50% indicating that both approaches are complementary (supplemental Fig. S3). The narrowing of bins toward the leading edge additionally contributes to the surplus of detected gene sets because it increases sensitivity and makes possible the detection of smaller gene sets among the strongly regulated proteins. As a further advantage, the sliding window approach displays biologically relevant behavior of individual gene sets in greater detail because enrichment and extent of regulation are considered by narrowing bins and closely reflected in the output. Although for instance “membrane” and “plasma membrane part” in A431 cells are both enriched with similar values for bins starting at -twofold (-1 log2), the sliding window approach reveals that “plasma membrane part” is also significantly enriched among proteins regulated more than -eightfold (-3 log2) in contrast to “membrane,” which is not overrepresented among proteins regulated more than -twofold (-1.2 log2) (Fig. 1B). By avoiding a fixed cutoff the sliding window approach widens the scope of interpretation. While the quantile approach defines gene sets as regulated or not regulated, the sliding window approach merely reflects the gene set behavior and leaves it to the scientist to estimate its biological relevance considering both extents of regulation and of noise. This freedom of interpretation is sensible because strength of regulation has different implications depending on the observed group of proteins. A regulation of twofold is relatively small for proteins that accumulate over time, for example in the extracellular matrix (ECM) (52), while it would be considered more relevant if it concerns a signaling pathway. Weakly regulated phenomena are neglected by a fixed cutoff of twofold even though they are statistically valid and add essential information to the overall picture of cellular responses to an experimental condition. They might reflect essential early steps in a chain of events that lead to the more pronounced phenotypes. If a specific cellular response is expected from an experiment, weak signals allow to distinguish, whether the experimental perturbation was merely too weak or totally failed.
Step 4: Automated Ontology Literature Mining
Unbiased, global experiments require extensive literature search, since all results are potentially of interest. However, the list of altered protein groups is overwhelming and related publications often use synonymous keywords, making a manual literature search impractical, as it is prone to be biased by the authors' background and interests. To address this issue we performed an automated ontology keyword search in relevant literature. All abstracts of papers related to our study are searched for all annotations from GO and KEGG and a list ranked by occurrences is generated providing a quick, comprehensive and unbiased overview of the contexts, in which the cells of interest were previously mentioned.
Step 5: Functional Ontology Similarity Analysis
Similar to previously described methods we employ a functional ontology similarity analysis to group similar ontologies based on gene member overlap and hierarchical clustering, independent from ontology categories (50, 53) (Experimental Procedures). From the cluster tree the underlying biological phenomena and their degree of confinement from each other visually emerge and facilitate a clear overview of all observed phenomena. However, in our analysis we gain additional synergistic benefits by clustering results from experiments and automated literature search together. This enables us to find relevant papers even for experimentally altered terms with no literature occurrence by identifying synonymously used literature terms through clustering proximity. “Extracellular region part” for instance is rarely mentioned in context with A431 cells, but the related term “basement membrane” can be quickly identified with many literature occurrences (Fig. 1B). Likewise, entirely unstudied phenomena become immediately apparent, for example, “organelle organization.” A major advantage in interpretation arises from the group context. “Mitochondrial membrane” alone, for instance, could hint at altered energy conversion, lipid metabolism, calcium storage, or apoptosis. In context with ”cholesterol” and “sterol biosynthetic process” the interpretation is clearly narrowed down to altered lipid metabolism (Fig. 1B).
The Keratinocyte Proteome - Study Design
Next to A431 cells, proteomic alterations in HaCaT cells were assessed by a quantitative comparative proteomic study using a SuperSILAC mix of primary human keratinocytes from six different donors (54). In addition, the proteome of primary human keratinocytes was investigated and the influence of gender, age of the donor and the anatomic site, from where the biopsy was obtained, was assessed (Fig. 2). Cells were SILAC-labeled for a period of 2 weeks, which is the time keratinocytes need for a 98% protein turnover (40). All experiments were performed as at least two independent biological replicates (supplemental Fig. S4). Sample complexity was reduced by SDS-PAGE, proteins in-gel digested (55), and the resulting peptide fractions measured on a LTQ Orbitrap XL. One hundred and eighty raw files were generated comprising 495 h of analysis time. MaxQuant and Andromeda were employed for peptide identification and quantification (56). In total in all cell lines and primary cells, we identified 112,026 peptides, which could be combined to 7968 protein groups, of which 5010 were quantifiable, which makes, to our knowledge, the current study the most detailed proteomic investigation of human epidermal cells to date. The average protein PEP score was 5.6 × 10⁻⁴, with 14 quantifiable peptides per protein and sequence coverage of 27% (supplemental Tables S1–S6).
Fig. 2.
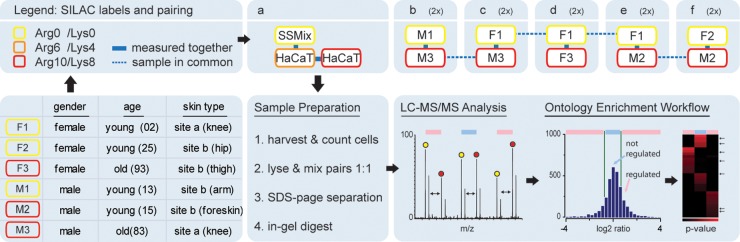
Study design. Primary cells and HaCaT cells used in this study are depicted. Site a describes samples of thicker skin from the outside of joints, site b samples from other anatomical sites. Cells were SILAC labeled as indicated. Primary cells were combined to a Super SILAC mix and spiked to HaCaT cells. Samples were lysed, separated by SDS-PAGE, gel lanes cut into pieces and proteins digested by trypsin. Resulting peptides were analyzed by LC-MS/MS and data subjected to the bioinformatics data processing pipeline outlined in Fig. 1.
Proteomic Assessment of HaCaT Cells as a Model System for Keratinocytes
To evaluate the suitability of HaCaT cells, we used average values of the log2 transformed, normalized protein ratios of two biological replicates (supplemental Fig. S4) and applied the workflow described above. Of 3321 quantified proteins 1035 (31%) proteins in HaCaT cells were assigned a p value of maximum 0.05 by LIMMA. Sliding window ontology enrichment detected 2234 annotations enriched (p < 0.05 Bonferroni cutoff). We limited results by considering only gene sets detected in at least five bins above the 98% noise extent. This resulted in 86 gene set annotations (Experimental Procedures). The automated literature search found 72 annotations that were mentioned more than 20 times in previous papers. Both, experimental results and literature search, summed up to 148 annotations relevant to HaCaT cells in total. Functional similarity analysis defined 14 underlying biological phenomena from these 148 annotations (Fig. 3A). In literature, HaCaT cells are regularly used for studies of extracellular region, laminin-5 complex, and differentiation. However, proteins related to these functions constitute the leading edge of eightfold down-regulated proteins in HaCaT cells compared with primary keratinocytes (Fig. 3A-i, j, l). As we are interested in ECM and its plasticity in skin (52), we decided to investigate this in more detail. We could validate the down-regulation of laminin-5, which consists of the chains laminin-α3, -β3, and -γ2, by Western blot analysis (Fig. 3B). A pathway analysis indicated that laminin-5 might play a role in cell motility and that almost the entire pathway was down-regulated in HaCaT cells (Fig. 3C). We compared HaCaT cells and primary keratinocyte motility and indeed could identify significant differences (Fig. 3D).
Fig. 3.

A, Altered protein abundances in HaCaT cells as compared with primary keratinocytes. The bottom panel shows a histogram of log2 transformed SILAC protein ratios. The whole dataset is highlighted in light red and LIMMA filtered protein ratios in dark red. The 99 and 98% noise extent is indicated by black vertical lines. The left panel shows hierarchical clusters of relevant ontology terms, followed by literature occurrences of ontology terms depicted in the middle panel, and enrichment and regulation of ontology terms in the main panel. Grouped ontology terms are distinguished by color and gray or white background. Terms with pronounced literature occurrences or regulation are annotated and marked by diamonds. Two-letter abbreviation indicates database origin of term (CC: GO cellular compartment; BP: GO biological function; KG: Kyoto encyclopedia of genes and genomes; LO: literature ontology). Clusters are annotated from a-n. Cell cycle or apoptosis (a), cholesterol (f), and wound healing processes (m) are not found to be strongly altered in HaCaT, but have been discussed in literature. Stromal communication is impaired manifesting in altered expression of extracellular matrix (i), laminin-5 complex (j), and adhesion (k). B, Abundance differences of the laminin-5 complex. Western blot analyses of whole cell lysate of normal human keratinocytes (NHK), A431, and HaCaT cells validate the abundance differences of the laminin-5 chains. Actin is used as loading control. C, Network analysis. Proteins in the integrin signaling pathways exhibit altered abundances in HaCaT cells compared with primary keratinocytes (green = lower and red = higher abundance). Analyzed by Ingenuity software. D, Altered motility of HaCaT cells compared with primary keratinocytes. The slope of kinetic impedance measurements reflecting cell migration is depicted. The data are expressed as the mean ± S.D. of eight replicates in two independent experiments. Differences were assessed by the Student t test for unpaired samples (*: p value <0.05). E, Comparable cell viability of HaCaT cells and primary keratinocytes. The treatment of NHK and HaCaT cells with hydrogen peroxide increases cell death in a dose response manner as analyzed by MTT. Comparing the treatment of both cell types identifies the response as similar, with IC50 of 1.6 and 1.7 μm for NHK and HaCaT, respectively. This difference is not significant (p = 0.42). The results represent the average ± S.D. of triplicates of three independent experiments.
Phenomena related to cell-substrate junction and prostaglandin biosynthesis are down-regulated fourfold and regularly mentioned in the context of HaCaT cell based studies (Fig. 3A-k, n). Phenomena related to cell cycle, chromosome organization, gene expression, fatty acid metabolism, amino acid metabolic process are as well regularly mentioned in context with HaCaT cells and found ∼twofold up-regulated in this study (Fig. 3A-a, b, d, h), lipid metabolic process ∼threefold (Fig. 3A-c). Apoptosis, which shares many proteins with cell cycle is mentioned more than 1500 times in literature (Fig. 3A-a). However, this process appeared not to be altered in HaCaT cells compared with primary keratinocytes and, indeed, we did not observe altered cell viability between the two cell systems after hydrogen peroxide treatment (Fig. 3E). With about 2500 publications the main part of the literature deals with functions specifically related to keratinocytes, emphasizing the importance to compare the proteomes of HaCaT cells and primary human keratinocytes. Respective terms cluster separately indicating distinct protein groups, which were not altered in this study (Fig. 3A-m).
Comparison of Primary Keratinocytes With Respect to Gender, Age, and Skin Localization
To assess proteome differences of primary keratinocytes, we compared keratinocytes varying with respect to gender and age of the donor and to the anatomic site from where the biopsy was obtained (thicker skin at outer joint area versus thin skin). Samples were grouped according to gender, age, and skin localization, respectively, and processed as outlined above. Because primary keratinocytes exhibit very little difference with respect to gender, age, and skin localization, we reduced filter criteria and required only three (instead of five) test bins above the 98% noise extent to have an equal or higher enrichment score than the significantly enriched bin. For the comparison of male and female derived cells, we obtained six twofold up-regulated annotations, which are all closely related to glycogen catabolic process (Fig. 4). In the comparison of old and young keratinocytes we found 41 annotations regulated that assemble to five phenomena groups (Fig. 5). Regulation of signaling is twofold down-regulated in old keratinocytes. Proteins associated with extracellular matrix, its secretion mechanisms and wound healing function are twofold down-regulated as well as lysosome and cell adhesion. Proteins involved in DNA recombination are twofold up-regulated. In the comparison of keratinocytes from different skin localizations 18 annotations are regulated and cluster to three phenomena. Chromatin associated proteins are up-regulated twofold. Proteins related to arachidonic acid metabolism are down-regulated twofold as well as the MHC protein complex (Fig. 6).
Fig. 4.

Altered protein abundances in primary keratinocytes with respect to gender. The bottom panel shows a histogram of log2 transformed SILAC protein ratios. The whole data set is highlighted in light blue and LIMMA filtered protein ratios in dark blue. The 99 and 98% noise extent is indicated by black vertical lines. The left panel shows hierarchical clusters of relevant ontology terms, followed by enrichment and regulation of ontology terms in the main panel. Terms with pronounced regulation are annotated and marked by diamonds. Two-letter abbreviation indicate database origin of terms (BP: GO biological function).
Fig. 5.
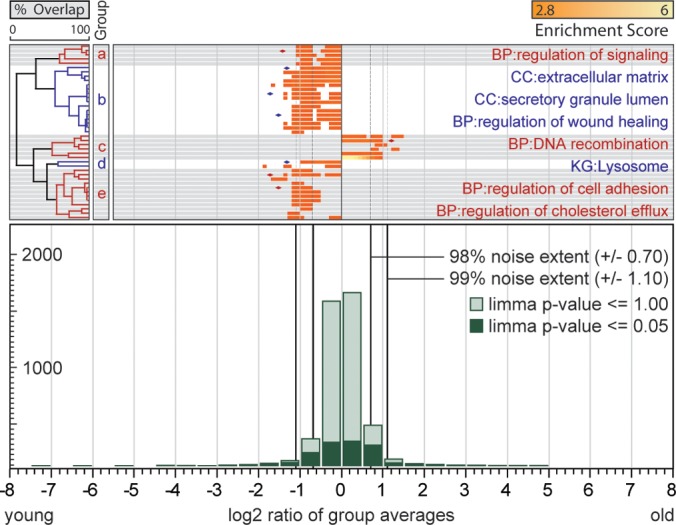
Altered protein abundances in primary keratinocytes with respect to donor age. The bottom panel shows a histogram of log2 transformed SILAC protein ratios. The whole dataset is highlighted in light green and LIMMA filtered protein ratios in dark green. The 99 and 98% noise extent is indicated by black vertical lines. The left panel shows hierarchical clusters of relevant ontology terms, followed by enrichment and regulation of ontology terms in the main panel. Grouped ontology terms are distinguished by color and gray or white background. Terms with pronounced regulation are annotated and marked by diamonds. Two-letter abbreviation indicate origin database of terms (CC: GO cellular compartment; BP: GO biological function; KG: Kyoto encyclopedia of genes and genomes).
Fig. 6.
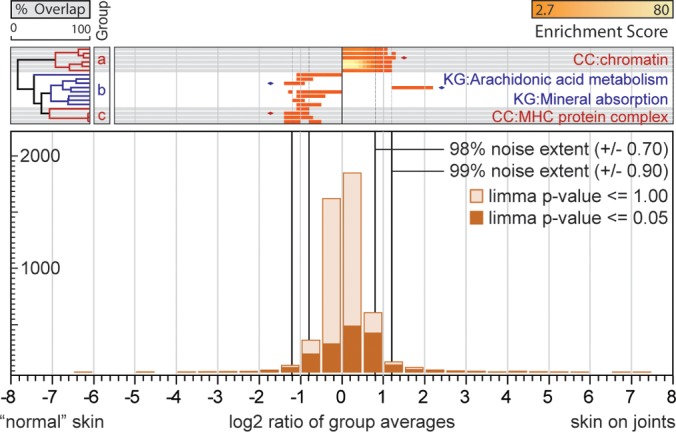
Altered protein abundances in primary keratinocytes with respect to skin localization. The bottom panel shows a histogram of log2 transformed SILAC protein ratios. The whole dataset is highlighted in light orange and LIMMA filtered protein ratios in dark orange. The 99 and 98% noise extent is indicated by black vertical lines. The left panel shows hierarchical clusters of relevant ontology terms, followed by enrichment and regulation of ontology terms in the main panel. Grouped ontology terms are distinguished by color and gray or white background. Terms with pronounced regulation are annotated and marked by diamonds. Two-letter abbreviation indicate origin database of terms (CC: GO cellular compartment; KG: Kyoto encyclopedia of genes and genomes).
DISCUSSION
In the current study we designed a streamlined bioinformatics data processing pipeline to evaluate the suitability of immortalized cell lines and primary cells as model systems and to link experimental data to literature knowledge. We applied our workflow to study epidermal derived cell lines, to compare them with primary human keratinocytes, and to investigate the influence of gender, age, and biopsy site of donors on keratinocyte proteomes. With a total of 5010 quantified proteins, 4414 of these in primary human keratinocytes, we provide a comprehensive resource for the scientific community.
A431 Cells Exhibit Decrease in Stromal Communication, Increased Proliferative Capacity and Shift to Glycolytic Energy Generation
Many of the alterations we observed in A431 cells can be linked to the cancerous phenotype. It is generally known that cancer cells have increased proliferative potential, which presents itself in our experiment as up-regulated cell cycle, DNA replication, and chromosome organization. Consistent with previously described observations in Hepa1–6 cell lines derived from hepatocyte cancer (22) and with HaCaT cells in our own study, we also observed under-representation of proteins related to extracellular region, plasma membrane, and cell adhesion in A431 cells, indicating impaired stromal communication and tissue maintenance. Mitochondrial proteins were less abundant, in line with decreased lipid metabolism, cholesterol and steroid biosynthesis, functions, which are partially located in mitochondria. In accordance with the Warburg hypothesis, cells appear to have undergone a metabolic shift toward less efficient aerobic metabolism (57). The strong down-regulation of metabolic processes can also be rationalized with a loss of specialized cell functions during the carcinogenesis process. As the automated literature search depicts, A431 cells are rarely used as a model for studies related to functions associated with the cancerous phenotype but mainly in the context of A431 cell specific traits. A431 cells are notorious for EGFR over-expression (25, 26), and many studies focus on biological functions observed in context of EGF signaling, for example, apoptosis, cytoskeleton assembly, cell proliferation, and cell migration. We found EGFR 11-fold enriched in our study. However, surprisingly, neither the expression levels on related pathways, such as MAPK or ErbB, nor the above mentioned functions controlled by EGFR signaling were altered in A431 cells under standard culture conditions. Apart from EGFR related research, many studies have focused on functions related to the arachidonic acid metabolism for which an endogenous inhibitor was found to be expressed by A431 cells. In conclusion, we provide detailed proteomic information on tumorous shifts in A431 cells, which will be valuable for the design of future experiments involving A431 cells as a model.
Similarities Between HaCaT Cells and Primary Keratinocytes
In dermatological research HaCaT cells are a favored cell line because of their nontumorous nature, their preserved capacity for differentiation, and because their deficits can be compensated to an extent at which they show overall little deviation from the behavior of primary keratinocytes (58–60). The slightly increased capacity for chromosome organization detected in this study may reflect an observed increase in chromosomal aberrations, which was shown not to correlate with a “transformed phenotype” (58). HaCaT cells are frequently mentioned in studies concerning cell cycle/apoptosis and lipid metabolism, as is apparent from the automated literature search. In line with previous studies, we found little alterations related to lipid metabolism (61). Similarly, protein groups related to cell cycle or apoptosis did not appear significantly regulated in our analyses, and HaCaT cells responded to H2O2 treatment comparable to keratinocytes. The culturing of cells for minimally 2 weeks to incorporate heavy labeled amino acids might have an influence on these results, masking initial proteomic differences. However, in earlier studies we already showed that SILAC labeling of primary skin cells has only little influence on their proteome homeostasis (40). Therefore, we are confident that the detected similarities are not due to culture conditions. Taken together, with respect to proteomic alterations, HaCaT cells can be used for studies involving lipid metabolism, cell cycle, and apoptosis.
Altered Stromal Communication in HaCaT Cells - Consequences on Proteomic Level
HaCaT cells are frequently used for studies on cellular functions related to extracellular matrix, wound healing, anchoring junctions, and cell adhesion and migration. All the respective proteins were down-regulated in our study. These functions are involved in, or tightly controlled through communication with stroma, which is known to be impaired in HaCaT cells (62). It is partially explained through weak expression of interleukin-1, which promotes proliferation of keratinocytes through induction of keratinocyte growth factor (KGF) and granulocyte-macrophage colony stimulating factor (GM-CSF) expression in fibroblasts in a double paracrine feedback mechanism (62). As a consequence, growth and differentiation are impaired. In organotypic cocultures or surface transplants on nude mice this deficit is compensated and HaCaT cells are able to reform regularly stratified and differentiated epithelia, even though with some delay (59, 63, 64). Entirely normal differentiation can be rescued by additional supplementation of autocrinely acting TGF alpha, which restores expression of interleukin-1 and of KGF and GM-CSF receptors (64). However, if cultivated alone in serum-free keratinocyte growth medium, the full scope of deficient signaling in HaCaT cells and its consequences become apparent. Accordingly, we found interleukin-1 levels 16-fold reduced and EGF receptor twofold up-regulated, which is known to compensate for the lost proliferation stimulus from stroma in HaCaT cells (65).
Most pronounced in our analysis was the down-regulation of cellular components related to juxtacrine signaling, such as extracellular matrix, particularly laminin-332, as well as cell-cell and cell-substrate junctions. The laminin-332 complex promotes cell adhesion and migration much more efficiently than other ECM proteins and may play an important role in epithelial-mesenchymal transition (62, 66). In surface transplants on nude mice, HaCaT cells are able to form a normal basement membrane with laminin-332 deposition starting around day four (59, 60). We found these functions strongly impaired under cell culture conditions without serum. Specifically the laminin-332 complex is less abundant, with all three constituent polypeptide chains equally reduced about 10-fold. Along the line of impaired stromal communication, we found extracellular region part, plasma membrane, cell-substrate junction, focal adhesion, as well as cytoskeleton down-regulated. Consequently, we observed altered migration and strongly reduced proliferation (data not shown) for HaCaT cells under serum-free conditions, respectively. Note that protein groups directly annotated with proliferation and differentiation were not significantly regulated. With this study, the full scope of deficient signaling in HaCaT cells and its consequences, if uncompensated, are revealed on a proteomic level. We want to allude to the fact that compensation of deficient signaling by culture medium can restore a close to normal phenotype but might not reflect the physiological balance in pathway activities. Therefore, we believe this study provides valuable information for the experimental design of tissue regeneration studies using HaCaT cells as a model system.
Alterations in primary keratinocytes
Primary keratinocytes derived from the skin of donors of different gender, age, or anatomic site showed a rather consistent proteome composition. Sex hormones influence skin thickness, hair follicle growth, and sebum production in skin (67). However, not many studies addressed the question whether a difference can be found on the keratinocyte level. Jain et al. found no evidence for gender dependent differences in epidermal maturation in humans (68), although such differences were seen in rats. Reed et al. investigated the epidermal barrier integrity and recovery as well as transepithelial water loss and found no difference in males and females (69). Epidermal thickness on the other hand was shown to be greater in males than in females (70). Our results indicate only slight increased capacity of glycogen catabolic processes in males. Consequently, keratinocytes from both sexes serve equally well as model system.
Because aging of the skin is obvious from increasing wrinkles and pigment abnormalities, age-related alterations in the keratinocyte proteome could be expected. Our results indeed indicate slightly down-regulated capacity of extracellular matrix production and secretion, cell adhesion, and consequently regulation of wound healing, which is in line with an aging phenotype. Ultimately, the changes in regulation are much smaller than expected and as compared with HaCaT cells. It appears that keratinocytes contribute only little to the macroscopically visible changed appearance of aged skin and that the major changes are derived from the dermal compartment of the skin. This observation may be surprising but is in line with a large proteomic study that demonstrated generally little impact of aging on protein homeostasis regardless of tissue type (71). It is also the general consensus of many single protein studies and functional characterizations that focus directly on keratinocytes and attempt to link the aging skin phenotype to a decline of protective biological functions. In these studies cytokine related defects in skin pigmentation could be excluded (72), as well as altered DNA-repair mechanisms upon UV-radiation (73), and altered antioxidative capacity (74). Tissue integrity (75), DNA-replication (73), proliferation (76), differentiation, and expression of related cytokines (77) were also shown to be unaffected by aging in keratinocytes. While these studies provided first hints, we show on a proteome scale, that biological functions in keratinocytes are almost unaffected by aging. In conclusion, age is not an important factor in the choice of primary keratinocytes as model systems.
Although a morphological difference is obvious between the thick skin covering joints and the thin skin from other areas such as face or folds, our data suggest little difference in the respective keratinocyte proteomes. Slightly higher abundance of chromatin associated proteins might result from higher proliferation rate to produce the thicker skin on joints. Thus, keratinocytes derived from different sites can serve as general keratinocyte model systems. Taken together, the results on primary keratinocytes were counterintuitive considering constitutional factors on the one hand and studies that have demonstrated varying skin functions (15–20) on the other hand. Our results suggest that involvement of keratinocytes is only small in skin functions dependent on age, gender, or localization and that their main function comprises formation of a barrier against environmental insults.
CONCLUSION
We provide a comprehensive overview of the keratinocyte proteome and explore proteomic alterations in keratinocytes of different origin that are commonly used as model systems. To make the full value of the proteomic data accessible at one glance, we developed an ontology enrichment analysis workflow specifically designed to provide a quick and comprehensive overview for unbiased global studies. Not only can this approach provide information about the extent of regulation of significantly altered gene sets, but it also contrasts experimental results with literature occurrences and displays them in ordered fashion. Primary keratinocytes displayed high proteomic consistency related to constitutional factors such as gender, age, and anatomic site. The present analyses provide essential information for the choice of keratinocyte model systems in skin research. We advise to use primary cells as a model system, if available. The gender and age of the donor, and the anatomic site from which the cells were derived are less important.
Supplementary Material
Acknowledgments
We thank Margit Schuhmann for help in cell culture and Claus Werner Franzke for helpful comments.
Footnotes
* This work was supported by the Excellence Initiative of the German Federal and State Governments through the Freiburg Institute for Advanced Studies (FRIAS), School of Life Sciences - LifeNet and the Center for Biological Signaling Studies (BIOSS), by grants SI 1281/2-1, BR 1475/12-1, and DE 1757/3-1 from the German Research Foundation, DFG, and by the Network Epidermolysis bullosa (EB-Network) grant 01GM0830 from the German Ministry for Education and Research, BMBF.
 This article contains supplemental Figs. S1 to S4 and Tables S1 to S6.
1 The abbreviations used are::
- GO
- Gene Ontology
- SILAC
- stable isotope labeling by amino acids in cell culture.
REFERENCES
- 1. Proksch E., Brandner J. M., Jensen J. M. (2008) The skin: an indispensable barrier. Exp. Dermatol. 17, 1063–1072 [DOI] [PubMed] [Google Scholar]
- 2. Chan A., Mauro T. (2011) Acidification in the epidermis and the role of secretory phospholipases. Dermatoendocrinology 3, 84–90 [DOI] [PMC free article] [PubMed] [Google Scholar]
- 3. Eckhart L., Fischer H., Tschachler E. (2012) Mechanisms and emerging functions of DNA degradation in the epidermis. Front. Biosci. 17, 2461–2475 [DOI] [PubMed] [Google Scholar]
- 4. Gutowska-Owsiak D., Ogg G. S. (2012) The epidermis as an adjuvant. J. Invest. Dermatol. 132, 940–948 [DOI] [PubMed] [Google Scholar]
- 5. Khnykin D., Miner J. H., Jahnsen F. (2011) Role of fatty acid transporters in epidermis: Implications for health and disease. Dermatoendocrinology 3, 53–61 [DOI] [PMC free article] [PubMed] [Google Scholar]
- 6. Ivanova I. A., D'Souza S. J. A., Dagnino L. (2005) Signalling in the epidermis: the E2F cell cycle regulatory pathway in epidermal morphogenesis, regeneration and transformation. Int. J. Biol. Sci. 1, 87–95 [DOI] [PMC free article] [PubMed] [Google Scholar]
- 7. Fürstenberger G., Epp N., Eckl K. M., Hennies H. C., Jørgensen C., Hallenborg P., Kristiansen K., Krieg P. (2007) Role of epidermis-type lipoxygenases for skin barrier function and adipocyte differentiation. Prostaglandins Other Lipid Mediat. 82, 128–134 [DOI] [PubMed] [Google Scholar]
- 8. Mack J. A., Anand S., Maytin E. V. (2005) Proliferation and cornification during development of the mammalian epidermis. Birth Defects Res. 75, 314–329 [DOI] [PubMed] [Google Scholar]
- 9. Massi D., Panelos J. (2012) Notch signaling and the developing skin epidermis. Adv. Exp. Med. Biol. 727, 131–141 [DOI] [PubMed] [Google Scholar]
- 10. Muroyama A., Lechler T. (2012) Polarity and stratification of the epidermis. Semin. Cell Dev. Biol. 23, 890–896 [DOI] [PMC free article] [PubMed] [Google Scholar]
- 11. Boehnke K., Falkowska-Hansen B., Stark H. J., Boukamp P. (2012) Stem cells of the human epidermis and their niche: composition and function in epidermal regeneration and carcinogenesis. Carcinogenesis, 33, 1247–1258 [DOI] [PubMed] [Google Scholar]
- 12. Margadant C., Charafeddine R. A., Sonnenberg A. (2010) Unique and redundant functions of integrins in the epidermis. FASEB J. 24, 4133–4152 [DOI] [PubMed] [Google Scholar]
- 13. Parks W. C. (2007) What is the alpha2beta1 integrin doing in the epidermis? J. Invest. Dermatol. 127, 264–266 [DOI] [PubMed] [Google Scholar]
- 14. Peltonen S., Raiko L., Peltonen J. Desmosomes in developing human epidermis, Dermatol. Res. Pract. 2010, 698761. [DOI] [PMC free article] [PubMed] [Google Scholar]
- 15. Gambichler T., Matip R., Moussa G., Altmeyer P., Hoffmann K. (2006) In vivo data of epidermal thickness evaluated by optical coherence tomography: effects of age, gender, skin type, and anatomic site. J. Dermatol. Sci. 44, 145–152 [DOI] [PubMed] [Google Scholar]
- 16. Gøransson L. G., Mellgren S. I., Lindal S., Omdal R. (2004) The effect of age and gender on epidermal nerve fiber density. Neurology 62, 774–777 [DOI] [PubMed] [Google Scholar]
- 17. Man M. Q., Xin S. J., Song S. P., Cho S. Y., Zhang X. J., Tu C. X., Feingold K. R., Elias P. M. (2009) Variation of skin surface pH, sebum content and stratum corneum hydration with age and gender in a large Chinese population, Skin Pharmacol. Physiol. 22, 190–199 [DOI] [PMC free article] [PubMed] [Google Scholar]
- 18. Jacobi U., Gautier J., Sterry W., Lademann J. (2005) Gender-related differences in the physiology of the stratum corneum. Dermatology 211, 312–317 [DOI] [PubMed] [Google Scholar]
- 19. Liu Z., Song S., Luo W., Elias P. M., Man M. Q. (2012) Sun-induced changes of stratum corneum hydration vary with age and gender in a normal Chinese population. Skin Res. Technol. 18, 22–28 [DOI] [PubMed] [Google Scholar]
- 20. Firooz A., Sadr B., Babakoohi S., Sarraf-Yazdy M., Fanian F., Kazerouni-Timsar A., Nassiri-Kashani M., Naghizadeh M. M., Dowlati Y. Variation of biophysical parameters of the skin with age, gender, and body region. ScientificWorldJournal 2012:386936, 2012 [DOI] [PMC free article] [PubMed] [Google Scholar]
- 21. Nolan G. P. (2007) What's wrong with drug screening today. Nat. Chem. Biol, 3, 187–191 [DOI] [PubMed] [Google Scholar]
- 22. Pan C., Kumar C., Bohl S., Klingmueller U., Mann M. (2009) Comparative proteomic phenotyping of cell lines and primary cells to assess preservation of cell type-specific functions. Mol. Cell. Proteomics 8, 443–450 [DOI] [PMC free article] [PubMed] [Google Scholar]
- 23. Irizarry R. A., Wang C., Zhou Y., Speed T. P. (2009) Gene set enrichment analysis made simple. Stat. Methods Med. Res. 18, 565–575 [DOI] [PMC free article] [PubMed] [Google Scholar]
- 24. Geiger T., Wehner A., Schaab C., Cox J., Mann M. (2012) Comparative proteomic analysis of eleven common cell lines reveals ubiquitous but varying expression of most proteins, Mol. Cell. Proteomics 11, M111.014050. [DOI] [PMC free article] [PubMed] [Google Scholar]
- 25. Barnes D. W. (1982) Epidermal growth factor inhibits growth of A431 human epidermoid carcinoma in serum-free cell culture. J. Cell Biol. 93, 1–4 [DOI] [PMC free article] [PubMed] [Google Scholar]
- 26. Gill G. N., Lazar C. S. (1981) Increased phosphotyrosine content and inhibition of proliferation in EGF-treated A431 cells. Nature 293, 305–307 [DOI] [PubMed] [Google Scholar]
- 27. Chajry N., Martin P. M., Cochet C., Berthois Y. (1996) Regulation of p42 mitogen-activated-protein kinase activity by protein phosphatase 2A under conditions of growth inhibition by epidermal growth factor in A431 cells. Eur. J. Biochem. 235, 97–102 [DOI] [PubMed] [Google Scholar]
- 28. Chajry N., Martin P. M., Pages G., Cochet C., Afdel K., Berthois Y. (1994) Relationship between the MAP kinase activity and the dual effect of EGF on A431 cell proliferation. Biochem. Biophys. Res. Commun. 203, 984–990 [DOI] [PubMed] [Google Scholar]
- 29. Silvy M., Martin P. M., Chajry N., Berthois Y. (1998) Differential dose-dependent effects of epidermal growth factor on gene expression in A431 cells: evidence for a signal transduction pathway that can bypass Raf-1 activation. Endocrinology. 139, 2382–2391 [DOI] [PubMed] [Google Scholar]
- 30. Boukamp P., Petrussevska R. T., Breitkreutz D., Hornung J., Markham A., Fusenig N. E. (1988) Normal keratinization in a spontaneously immortalized aneuploid human keratinocyte cell line, J. Cell Biol. 106, 761–771 [DOI] [PMC free article] [PubMed] [Google Scholar]
- 31. Dickson F. M., Lawrence J. N., Benford D. J. (1993) Release of inflammatory mediators in human keratinocyte cultures following exposure to a skin irritant. Toxicol. In vitro 7, 385–388 [DOI] [PubMed] [Google Scholar]
- 32. Roguet R., Cohen C., Dossou K. G., Rougier A. (1994) Episkin, a reconstituted human epidermis for assessing in vitro the irritancy of topically applied compounds. Toxicol. In vitro 8, 283–291 [DOI] [PubMed] [Google Scholar]
- 33. Bae D. S., Gennings C., Carter W. H., Yang R. S., Campain J. A. (2001) Toxicological interactions among arsenic, cadmium, chromium, and lead in human keratinocytes. Toxicol. Sci. 63, 132–142 [DOI] [PubMed] [Google Scholar]
- 34. Brosin A., Wolf V., Mattheus A., Heise H. (1997) Use of XTT-assay to assess the cytotoxicity of different surfactants and metal salts in human keratinocytes (HaCaT). A feasible method for in vitro testing of skin irritants. Acta Derm. Venereol. 77, 26–28 [DOI] [PubMed] [Google Scholar]
- 35. Ermolli M., Menné C., Pozzi G., Serra M. A., Clerici L. A. (2001) Nickel, cobalt and chromium-induced cytotoxicity and intracellular accumulation in human hacat keratinocytes. Toxicology. 159, 23–31 [DOI] [PubMed] [Google Scholar]
- 36. Hedrick L., Cho K. R., Vogelstein B. (1993) Cell adhesion molecules as tumour suppressors. Trends Cell Biol. 3, 36–39 [DOI] [PubMed] [Google Scholar]
- 37. Fukunaga M., Oka M., Ichihashi M., Yamamoto T., Matsuzaki. H., Kikkawa U. (2001) UV-induced tyrosine phosphorylation of PKC delta and promotion of apoptosis in the HaCaT cell line, Biochem. Biophys. Res. Commun. 289, 573–579 [DOI] [PubMed] [Google Scholar]
- 38. Phillipson R. P., Tobi S. E., Morris J. A., McMillan T. J. (2002) UV-A induces persistent genomic instability in human keratinocytes through an oxidative stress mechanism, Free Radic. Biol. Med, 32, 474–480 [DOI] [PubMed] [Google Scholar]
- 39. Villard P. H., Sampol E., Elkaim J. L., Puyoou F., Casanova D., Sérée E., Durand A., Lacarelle B. (2002) Increase of CYP1B1 Transcription in Human Keratinocytes and HaCaT Cells after UV-B Exposure. Toxicol. Appl. Pharmacol. 178, 137–143 [DOI] [PubMed] [Google Scholar]
- 40. Sprenger A., Küttner V., Biniossek M. L., Gretzmeier C., Boerries M., Mack C., Has C., Bruckner-Tuderman L., Dengjel J. (2010) Comparative quantitation of proteome alterations induced by aging or immortalization in primary human fibroblasts and keratinocytes for clinical applications. Mol. Biosyst. 6, 1579–1582 [DOI] [PubMed] [Google Scholar]
- 41. Hunter T., Cooper J. A. (1981) Epidermal growth factor induces rapid tyrosine phosphorylation of proteins in A431 human tumor cells. Cell 24, 741–752 [DOI] [PubMed] [Google Scholar]
- 42. Blagoev B., Mann M. (2006) Quantitative proteomics to study mitogen-activated protein kinases. Methods 40, 243–250 [DOI] [PubMed] [Google Scholar]
- 43. Ong S. E., Blagoev B., Kratchmarova I., Kristensen D. B., Steen H., Pandey A., Mann M. (2002) Stable isotope labeling by amino acids in cell culture, SILAC, as a simple and accurate approach to expression proteomics, Mol. Cell. Proteomics 1, 376–386 [DOI] [PubMed] [Google Scholar]
- 44. Singh A., Nascimento J. M., Kowar S., Busch H., Boerries M. (2012) Boolean approach to signalling pathway modelling in HGF-induced keratinocyte migration. Bioinformatics 28, i495–i501 [DOI] [PMC free article] [PubMed] [Google Scholar]
- 45. Shevchenko A., Tomas H., Havlis J., Olsen J. V., Mann M. (2006) In-gel digestion for mass spectrometric characterization of proteins and proteomes, Nat. Protoc. 1, 2856–2860 [DOI] [PubMed] [Google Scholar]
- 46. Rappsilber J., Mann M., Ishihama Y. (2007) Protocol for micro-purification, enrichment, pre-fractionation and storage of peptides for proteomics using StageTips, Nat. Protoc. 2, 1896–1906 [DOI] [PubMed] [Google Scholar]
- 47. Cox J., Mann M. (2008) MaxQuant enables high peptide identification rates, individualized p.p.b.-range mass accuracies and proteome-wide protein quantification, Nat. Biotechnol. 26, 1367–1372 [DOI] [PubMed] [Google Scholar]
- 48. Cox J., Neuhauser N., Michalski A., Scheltema R. A., Olsen J. V., Mann M. (2011) Andromeda: a peptide search engine integrated into the MaxQuant environment. J. Proteome Res. 10, 1794–1805 [DOI] [PubMed] [Google Scholar]
- 49. Smyth G. K. (2004) Linear models and empirical bayes methods for assessing differential expression in microarray experiments. Stat. Appl. Genet. Mol. Biol. 3, Article3 [DOI] [PubMed] [Google Scholar]
- 50. Huang D. W., Sherman B. T., Lempicki R. A. (2009) Bioinformatics enrichment tools: paths toward the comprehensive functional analysis of large gene lists. Nucleic Acids Res. 37, 1–13 [DOI] [PMC free article] [PubMed] [Google Scholar]
- 51. Huang D. W., Sherman B. T., Lempicki R. A. (2009) Systematic and integrative analysis of large gene lists using DAVID bioinformatics resources. Nat. Protoc. 4, 44–57 [DOI] [PubMed] [Google Scholar]
- 52. Küttner V., Mack C., Rigbolt K. T. G., Kern J. S., Schilling O., Busch H., Bruckner-Tuderman L., Dengjel J. (2013) Global remodelling of cellular microenvironment due to loss of collagen VII. Mol. Sys. Biol. 9, 657. [DOI] [PMC free article] [PubMed] [Google Scholar]
- 53. Huang D. W., Sherman B. T., Lempicki R. A. (2009) Systematic and integrative analysis of large gene lists using DAVID bioinformatics resources. Nat. Protoc. 4, 44–57 [DOI] [PubMed] [Google Scholar]
- 54. Geiger T., Cox J., Ostasiewicz P., Wisniewski J. R., Mann M. (2010) Super-SILAC mix for quantitative proteomics of human tumor tissue. Nat. Methods 7, 383–385 [DOI] [PubMed] [Google Scholar]
- 55. Shevchenko A., Tomas H., Havlis J., Olsen J. V., Mann M. (2006) In-gel digestion for mass spectrometric characterization of proteins and proteomes, Nat. Protoc. 1, 2856–2860 [DOI] [PubMed] [Google Scholar]
- 56. Cox J., Mann M. (2008) MaxQuant enables high peptide identification rates, individualized p.p.b.-range mass accuracies and proteome-wide protein quantification. Nat. Biotechnol. 26, 1367–1372 [DOI] [PubMed] [Google Scholar]
- 57. Hsu P. P., Sabatini D. M. (2008) Cancer cell metabolism: Warburg and beyond. Cell 134, 703–707 [DOI] [PubMed] [Google Scholar]
- 58. Boukamp P., Popp S., Altmeyer S., Hülsen A., Fasching C., Cremer T., Fusenig N. E. (1997) Sustained nontumorigenic phenotype correlates with a largely stable chromosome content during long-term culture of the human keratinocyte line HaCaT. Genes, Chromosomes Cancer 19, 201–214 [DOI] [PubMed] [Google Scholar]
- 59. Breitkreutz D., Schoop V. M., Mirancea N., Baur M., Stark H. J., Fusenig N. E. (1998) Epidermal differentiation and basement membrane formation by HaCaT cells in surface transplants. Eur. J. Cell Biol. 75, 273–286 [DOI] [PubMed] [Google Scholar]
- 60. Breitkreutz D., Stark H. J., Mirancea N., Tomakidi P., Steinbauer H., Fusenig N. E. (1997) Integrin and basement membrane normalization in mouse grafts of human keratinocytes-implications for epidermal homeostasis. Differentiation 61, 195–209 [DOI] [PubMed] [Google Scholar]
- 61. Schürer N., Köhne A., Schliep V., Barlag K., Goerz G. (1993) Lipid composition and synthesis of HaCaT cells, an immortalized human keratinocyte line, in comparison with normal human adult keratinocytes. Exp. Dermatol. 2, 179–185 [DOI] [PubMed] [Google Scholar]
- 62. Maas-Szabowski N., Stärker A., Fusenig N. E. (2003) Epidermal tissue regeneration and stromal interaction in HaCaT cells is initiated by TGF-alpha. J. Cell Sci. 116, 2937–2948 [DOI] [PubMed] [Google Scholar]
- 63. Schoop V. M., Mirancea N., Fusenig N. E. (1999) Epidermal organization and differentiation of HaCaT keratinocytes in organotypic coculture with human dermal fibroblasts. J. Invest. Dermatol. 112, 343–353 [DOI] [PubMed] [Google Scholar]
- 64. Zinn M., Aumailley M., Krieg T., Smola H. (2006) Expression of laminin 5 by parental and c-Ha-ras-transformed HaCaT keratinocytes in organotypic cultures. Eur. J. Cell Biol. 85, 333–343 [DOI] [PubMed] [Google Scholar]
- 65. Breitkreutz D., Stark H. J., Mirancea N., Tomakidi P., Steinbauer H., Fusenig N. E. (1997) EGF-R dependent regulation of keratinocyte survival. J. Cell Sci. 110, 113–121 [DOI] [PubMed] [Google Scholar]
- 66. Liotta L. A. (1986) Tumor invasion and metastases-role of the extracellular matrix: Rhoads Memorial Award lecture. Cancer Res. 46, 1–7 [PubMed] [Google Scholar]
- 67. Dao H., Kazin R. A. (2007) Gender differences in skin: a review of the literature. Gend Med. 4, 308–328 [DOI] [PubMed] [Google Scholar]
- 68. Jain A., Rutter N., Cartlidge P. H. (2000) Influence of antenatal steroids and sex on maturation of the epidermal barrier in the preterm infant. Arch. Dis. Child. Fetal Neonatal Ed. 83, F112–6 [DOI] [PMC free article] [PubMed] [Google Scholar]
- 69. Reed J. T., Ghadially R., Elias P. M. (1995) Skin type, but neither race nor gender, influence epidermal permeability barrier function. Arch. Dermatol. 131, 1134–1138 [PubMed] [Google Scholar]
- 70. Sandby-Møller J., Poulsen T., Wulf H. C. (2003) Epidermal thickness at different body sites: relationship to age, gender, pigmentation, blood content, skin type and smoking habits. Acta Derm. Venereol. 83, 410–413 [DOI] [PubMed] [Google Scholar]
- 71. Walther D. M., Mann M. (2011) Accurate quantification of more than 4000 mouse tissue proteins reveals minimal proteome changes during aging. Mol. Cell. Proteomics 10, M110.004523. [DOI] [PMC free article] [PubMed] [Google Scholar]
- 72. Okazaki M., Yoshimura K., Uchida G., Harii K. (2005) Correlation between age and the secretions of melanocyte-stimulating cytokines in cultured keratinocytes and fibroblasts. Br. J. Dermatol. 153, 23–29 [DOI] [PubMed] [Google Scholar]
- 73. Liu S. C., Parsons C. S., Hanawalt P. C. (1982) DNA repair response in human epidermal keratinocytes from donors of different age. J. Invest. Dermatol. 79, 330–335 [DOI] [PubMed] [Google Scholar]
- 74. Lopez-Torres M., Shindo Y., Packer L. (1994) Effect of age on antioxidants and molecular markers of oxidative damage in murine epidermis and dermis. J. Invest. Dermatol. 102, 476–480 [DOI] [PubMed] [Google Scholar]
- 75. Chen Y. Q., Mauviel A., Ryynänen J., Sollberg S., Uitto J. (1994) Type VII collagen gene expression by human skin fibroblasts and keratinocytes in culture: influence of donor age and cytokine responses. J. Invest. Dermatol. 102, 205–209 [DOI] [PubMed] [Google Scholar]
- 76. Ng M. H., Aminuddin B. S., Hamizah S., Lynette C., Mazlyzam A. L., Ruszymah B. H. (2009) Correlation of donor age and telomerase activity with in vitro cell growth and replicative potential for dermal fibroblasts and keratinocytes. J. Tissue Viability 18, 109–116 [DOI] [PubMed] [Google Scholar]
- 77. Compton C., Tong T., Trookman N., Zhao H., Roy D. (1994) TGF-beta 1 gene expression in cultured human keratinocytes does not decrease with biologic age. J. Invest. Dermatol. 103, 127–133 [DOI] [PubMed] [Google Scholar]
Associated Data
This section collects any data citations, data availability statements, or supplementary materials included in this article.