

Abstract
Reverse-phase protein arrays (RPPAs) have become an important tool for the sensitive and high-throughput detection of proteins from minute amounts of lysates from cell lines and cryopreserved tissue. The current standard method for tissue preservation in almost all hospitals worldwide is formalin fixation and paraffin embedding, and it would be highly desirable if RPPA could also be applied to formalin-fixed and paraffin embedded (FFPE) tissue. We investigated whether the analysis of FFPE tissue lysates with RPPA would result in biologically meaningful data in two independent studies. In the first study on breast cancer samples, we assessed whether a human epidermal growth factor receptor (HER) 2 score based on immunohistochemistry (IHC) could be reproduced with RPPA. The results showed very good concordance between the IHC and RPPA classifications of HER2 expression. In the second study, we profiled FFPE tumor specimens from patients with adenocarcinoma and squamous cell carcinoma in order to find new markers for differentiating these two subtypes of non-small cell lung cancer. p21-activated kinase 2 could be identified as a new differentiation marker for squamous cell carcinoma. Overall, the results demonstrate the technical feasibility and the merits of RPPA for protein expression profiling in FFPE tissue lysates.
Many diseases are characterized by the expression of specific proteins and the activation status of distinct signaling pathways (1). Thus, protein expression profiling and activation patterns are instrumental for understanding disease, the development of effective treatments, and the identification of patients who will respond to particular therapies. Traditional ways of analyzing protein expression (e.g. Western blot) can be used for these purposes but often are labor intensive, have low throughput, and consume high sample volumes. Reverse-phase protein array (RPPA)1 technology is a very promising method that circumvents these issues (2–4). For RPPA, minute amounts of whole protein lysates from a multitude of samples are spotted onto slides, and individual proteins are detected via protein-specific antibodies. This enables medium- to high-throughput analysis of precious low-volume sample material.
Lysates for RPPA have so far been generated mainly from cell lines or fresh frozen tissue. However, because of the high amount of effort involved in the use of liquid nitrogen for sample preservation, in almost all hospitals worldwide formalin fixation and paraffin embedding is the preferred method for tissue preservation. Therefore, it would be highly desirable if protein-specific epitopes could be quantitatively extracted and analyzed from formalin-fixed and paraffin embedded (FFPE) tissue, as this would make the majority of clinical specimens accessible for mechanistic protein-based research.
In recent years, several research groups have established protocols for protein extraction from FFPE tissue. Common to all of them is the use of high concentrations of ionic detergents, such as sodium dodecyl sulfate, and high temperature. It was shown that these methods even make it possible to extract full-length proteins from FFPE tissue (5–12). The coefficient of variation of the relative extraction efficiency based on Western blot and densitometric assessment of actin typically is below 20% (13). To assess whether the analysis of FFPE tissue lysates would result in biologically meaningful data, we analyzed FFPE breast cancer tissue samples by RPPA for the expression of human epidermal growth factor receptor 2 (HER2) and compared it to HER2 assessment by the gold standard used in clinical practice, which is based on immunohistochemistry (IHC). Successful recovery of HER2 from FFPE tissue should result in concordant HER2 classification between RPPA and IHC.
In the second part of the study, FFPE samples of non-small cell lung cancer (NSCLC) were examined via RPPA. Samples from two subtypes of NSCLC, adenocarcinoma (AC) and squamous cell carcinoma (SCC), were analyzed for more than 150 proteins, including two proteins that are known to be differentially expressed between the two subtypes. The objectives of this analysis were to further assess the validity of the approach by confirming the two positive controls and to identify new markers for the differentiation of the two subtypes of NSCLC.
EXPERIMENTAL PROCEDURES
Tissue Samples
All tissue samples were purchased from commercial vendors, and approvals of the respective institutional ethics committees are available.
For the initial HER2 analysis, 19 FFPE specimens of breast cancer tissue were acquired from Asterand Inc. (Royston, UK). The HER2 validation sample set, consisting of another 27 FFPE breast cancer specimens, was acquired from Asterand Inc. (Royston, UK) and Cureline Inc. (San Francisco, CA). The tumor size was at least 1 cm in diameter, and the tumor cell content ranged from 30% to 85%.
For NSCLC analysis, FFPE specimens of 25 AC and 25 SCC tumors were selected. All samples were derived from commercial providers (Indivumed GmbH, Hamburg, Germany, and Asterand Inc., Royston, UK). Samples for RPPA analysis were defined by the following criteria: tissue from male patients, tumor size ranging from 0.5 cm to 2 cm in diameter, total necrosis < 30%, and viable tumor cells > 50%.
For all RPPA analyses, the tumor samples were cut into sections 15 μm in thickness.
IHC
The stratifying HER2 IHC was performed manually with the Dako HercepTest (Dako, Glostrup, Denmark) according to the manufacturer's instructions.
IHC results were reported using the ASCO/CAP modified Hercepscore scoring scheme for the membrane marker HER2 (14): 0, negative; 1+, incomplete, weak membrane staining in >10% of tumor cells; 2+, intermediate complete membrane staining in >10% of tumor cells; or 3+, strong, uniform, complete membrane staining in >30% of tumor cells.
Fluorescence in Situ Hybridization
All specimens were subjected to FISH for the assessment of the amplification status of the HER2 gene using a HER2 pharmDx FISH kit from Dako (Glostrup, Denmark) according to the manufacturer's instructions.
The amplification status was assessed according to the recommended clinical scoring scheme, counting HER2 and chromosome 17 signals in 20 representative tumor nuclei and calculating a HER2/CHR17 ratio. A specimen was considered amplified if the ratio was >2.2 and non-amplified if the ratio was <1.8. If the ratio fell into the borderline region of 1.8–2.2, an additional 40 tumor cells were counted and the ratio was recalculated. Any ratio greater than or equal to 2.0 was then regarded as amplified.
Protein Extraction
The Qproteome FFPE Tissue Kit (Qiagen, Hilden, Germany) was used for the extraction of proteins from the breast cancer and NSCLC samples. The protein extraction was performed according to the manufacturer's specifications promptly after tumor sections were cut freshly from the respective FFPE tumor blocks. Up to three sections, each with a thickness of 15 μm and an area of 100 mm2, were collected (the total area was 300 mm2 for breast cancer samples and 100 mm2 for NSCLC samples). Paraffin removal was performed in xylene, and this was followed by rehydration in a series of 100%, 96%, and 70% (v/v) ethanol. Each preparation step was performed in the collection tube (1.5 ml) with a 1-ml volume of the respective reagent. The sample was vortexed vigorously for 10 s, incubated for 10 min at room temperature (25 °C), and centrifuged in a micro-centrifuge for 10 min at full speed. The supernatant was discarded, and each preparation step was repeated twice using fresh reagent. After deparaffinization and rehydration, EXB extraction buffer (Qproteome FFPE Tissue Kit, Qiagen, Hilden, Germany) was added to the tube containing the tissue pellet (100 μl for breast cancer and 60 μl for NSCLC samples). After further incubation for 5 min on ice, the tube was heated at 100 °C for 20 min on a heating block and subsequently incubated at 80 °C for 2 h using a Thermomixer (Eppendorf, Hamburg, Germany) with agitation at 750 rpm. The tube was placed at 4 °C for 1 min and centrifuged for 15 min at 14,000 × g at 4 °C. The supernatant containing the extracted proteins was recovered and used for RPPA and Western blot analysis. The protein concentration of the obtained extract was quantified using a BCA test (Thermo Fisher Scientific, Rockford, MD). Protein extracts were stored at −80 °C until further use.
RPPA
RPPA technology, printing, assays, and data analysis have been described in detail previously (15). FFPE tissue lysates were adjusted to a uniform protein concentration with EXB buffer (Qproteome FFPE Tissue Kit, Qiagen, Hilden, Germany) and subsequently diluted with spotting buffer CSBL1 (Zeptosens, Leverkusen, Germany) to a comparable final print concentration of 0.14 μg/μl for the breast cancer samples and 0.18 μg/μl for the NSCLC samples. The diluted lysates were printed onto hydrophobic chips (Zeptosens, Leverkusen, Germany) using a piezoelectric non-contact printer (NanoPlotter 2, GeSiM, Grosserkmannsdorf, Germany) and single-droplet deposition of lysate (0.4 nl per spot). Each lysate was spotted at four serial dilutions (1.6-fold), starting at 0.14 μg/μl and 0.18 μg/μl protein concentrations for breast cancer and NSCLC samples, respectively. Each dilution was printed in duplicate spots, resulting in eight spots per sample. Reference material (fluorescence-labeled albumin) was co-printed with the lysates, and the reference spot signals were used to compensate for local inhomogeneities of array illumination. After printing, the arrays were blocked with 3% (w/v) albumin solution, thoroughly washed with double-distilled water, dried in a nitrogen stream, and stored at 4 °C in the dark until further use.
Protein signals were measured in a direct two-step sequential immunoassay using a sensitive and quantitative fluorescence read-out. For each protein of interest, primary antibody was incubated (array by array) overnight (15 h) at room temperature (25 °C). The following primary antibodies were used: anti-HER2 (A0485, Dako, Glostrup, Denmark) diluted 1:100 from stock, anti-Cytokeratin 5 (M3270, Spring BioScience Inc., Pleasanton, CA) diluted 1:100 from stock, anti-Napsin A (760–4446, Ventana Medical Systems Inc., Tucson, AZ) diluted 1:10 from stock, and anti-p21-activated kinase 2 (PAK2) (2608, Cell Signaling Technology Inc., Danvers, MA) diluted 1:100 from stock. After subsequent washing, the arrays were incubated for 1 h with Alexa647-labeled anti-species antibody (Invitrogen, Paisley, UK). After subsequent washing, the stained arrays were imaged using a ZeptoREADER instrument (Zeptosens, Leverkusen, Germany) in the red laser channel. For each array, six fluorescence images were recorded at exposure times of between 0.5 and 16 s. Assays in the absence of the primary antibody (blank assays) were performed to determine the potential nonspecific signal contributions of the secondary antibody. In addition, one chip out of the print series was stained to measure the relative amount of immobilized protein per spot (protein stain assay).
Microarray images (assay image selected at the longest exposure time not showing any saturation effect) were analyzed using the array analysis software ZeptoVIEW™ Pro 2.0 (Zeptosens, Leverkusen, Germany) with the spot diameters set to 160 μm. Referenced background-corrected mean intensities of the duplicate spots were averaged and extrapolated to the highest of the four printed protein concentrations by applying a linear fit. The signal values of the four extrapolated data points were used to calculate the mean fluorescence intensity for each sample. Blank-corrected mean fluorescence intensity signals of the samples were normalized for their respective relative protein concentrations measured in the protein stain assay on the chip, so as to obtain normalized fluorescence intensity signals. Normalized fluorescence intensity signals were used for all subsequent statistical analysis.
Western Blot
Immunoblotting was performed with the protein extracts of FFPE tumor samples (NSCLC) as prepared for RPPA analysis. Samples with adequately high concentration and sufficient total protein amount remaining after RPPA analysis were tested (n = 16 samples). Protein extracts (5 μg total protein) were resolved via SDS-PAGE using the NuPAGE system (Invitrogen, Paisley, UK), and the proteins were electro-blotted into nitrocellulose membranes of 0.2-μm pore size (Whatman, Fairfield, NJ). The antibody against PAK2 (2608, Cell Signaling Technology Inc., Danvers, MA) was used at a dilution of 1:250 of stock as the primary antibody, and the antibody against rabbit IgG conjugated with IRDye 800CW (926–32213, LI-COR Biosciences, Lincoln, NE) was used at a dilution of 1:10,000 as the secondary antibody. Signals were detected via infrared fluorescence using the Odyssey Imaging system (LI-COR Biosciences, Lincoln, NE), and the PAK2-specific protein bands were quantified using MultiGauge Software v3.0 (FUJI Film Cooperation, Tokyo, Japan).
Statistical Analysis
Statistical analysis was performed using statistical language R 2.10.1 (16). Principal component analysis, Spearman correlation (rSp), and Mann–Whitney tests were performed using the package “stats,” and graphical visualizations were performed using the package “lattice” (16).
The employed kappa coefficient (κ) is a statistical measure of the agreement of two raters; in this case the raters are categorization by means of IHC and RPPA. The kappa coefficient ranges from 0 (disagreement) to 1 (perfect agreement). Disagreements were weighted according to their squared distance from perfect agreement (17). Confidence intervals for kappa and Spearman correlation coefficients were estimated by balanced bootstraps with 10,000 permutations using the package “boot” (18).
Ordinal Multinomial Logistic Regression
For each sample i, the IHC score Yi and the RPPA HER2 signal intensity xi were determined. The IHC score Y is categorical by definition. Each score follows a logical ordering according to the level of HER2 expression, from category j = 0 to 3+. Therefore, the IHC HER2 score is an ordinal categorical response. The RPPA HER2 signal intensity xi is a continuous variable. The relationship between the IHC HER2 score and the RPPA HER2 signal intensity is adequately modeled by an ordinal multinomial logistic regression, which in this study was performed as described elsewhere (18, 19). This model aims to predict the probability that the association of sample i will be assigned to category j based on xi, or pij = P(Yi = j). As the probability for each of the samples is predicted for each of the four scores simultaneously, the probability distribution of the samples to be assigned to each of the four scores is called multinomial. Technically, this is resolved by fitting a binary logistic regression model for each score j in which scores 0 to j combine to form a single category and categories j + 1 to 3+ form a second category. At any RPPA HER2 signal intensity xi, the probability of Y being at or below a particular score j is expressed as a cumulative probability that reflects the HER2 score ordering: P(Y ≤ 0) ≤ P(Y ≤ 1+) ≤ P(Y ≤ 2+) ≤ P(Y ≤ 3+). Finally, the probability P(Y = j) is estimated from P(Y = j) = P(Y ≤ j) − P(Y ≤ j − 1) (20). For validation, the different intensity value ranges of the initial set and the validation set were adjusted by subtracting the respective median and dividing by the respective median absolute deviation.
Mixed Effects Models
For each antibody, the model was estimated using the package lme4 (21), with the RPPA fluorescence intensity as the response, the cancer subtype (SCC or AC) as a fixed factor, and the sample vendor as a random factor. Testing for multiple antibodies (RPPA assays) has been considered by Westfall Young adjustment of p values.
RESULTS
HER2 IHC Assay
19 breast cancer samples were stained and stratified via IHC for HER2 with the DAKO HercepTest and classified into HER2 score categories 0 (three cases), 1+ (six cases), 2+ (five cases), and 3+ (five cases). Fig. 1 shows representative samples for each of the HER2 score categories. For validation, an additional set of 27 breast cancer samples was processed accordingly and classified into HER2 score categories 0 (seven cases), 1+ (nine cases), 2+ (seven cases), and 3+ (four cases).
Fig. 1.

IHC staining of HER2 in breast cancer tissue. This figure shows representative samples for the four categories of HER2 IHC staining: 0 (A), 1+ (B), 2+ (C), and 3+ (D).
HER2 FISH Assay
In addition to the HER2 IHC, the HER2 amplification status was investigated in the initial set of breast cancer tissue samples. As a result of reduced tissue integrity, three cases failed to hybridize, and no result could be obtained. Out of the remaining 16 samples, 14 were concordant with IHC, in that HER2 gene amplification was negatively correlated with IHC 0 and 1+ and positively correlated with IHC 2+ and 3+. Two cases were FISH positive while having an IHC 1+ score, which is considered negative for HER2 regarding therapy decisions for Herceptin.
HER2 RPPA Assay
Expression signals (normalized fluorescence intensity) of HER2 protein were measured and quantified for the FFPE tissue samples in parallel. Two samples were removed for further analysis. In one case, the protein concentration was more than 1.5 x interquartile range lower than the median protein concentration. In the other case, visual inspection of the array showed problems during spotting.
Comparison of HER2 IHC Assay with HER2 RPPA Assay
As Fig. 2 shows, the signal intensity for HER2 in the RPPA assay increased with higher HER2 scores based on IHC. The Spearman correlation coefficient was rSp = 0.86 (95% confidence interval: 0.579, 0.945; p ≤ 0.05).
Fig. 2.
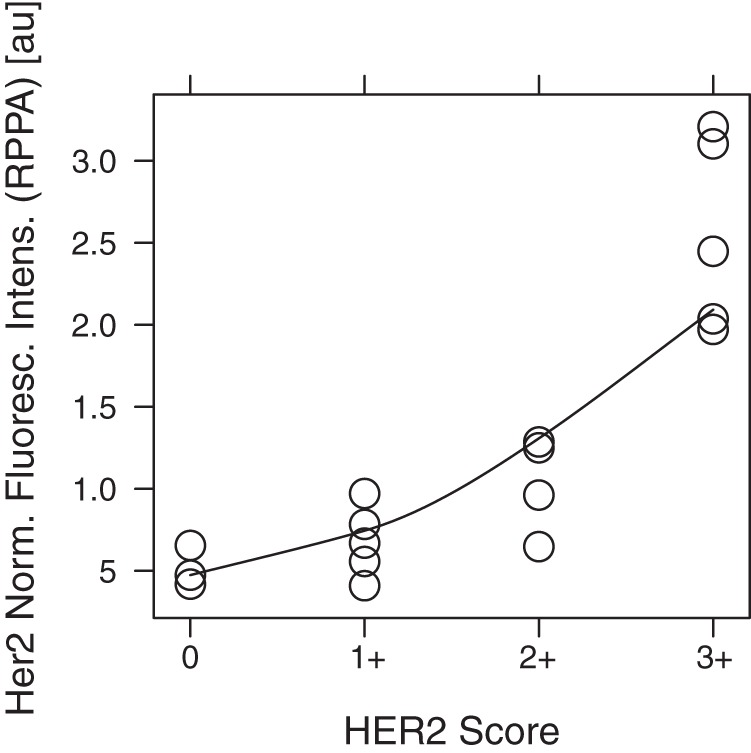
Correlation between HER2 score (IHC) and HER2 signal intensity (RPPA). The figure shows, for the four categories of HER2 IHC staining, the signal intensity in the individual samples for HER2 obtained with RPPA.
However, because the nature of the HER2 score is categorical and ordinal and the nature of the RPPA HER2 signal intensity is continuous, an ordered multinomial logistic regression is a more appropriate model for interpreting the data. Based on the data, the model predicts a probability for the HER2 score at a given RPPA signal intensity. In Fig. 3, the probability that each sample will have a HER2 score equivalent to one of the scores from 0+ to 3+ is a function of the RPPA signal intensity. For samples with RPPA signals below 1.0 au, the maximum probability of any score is always below 66%, equivalent to a probability of a wrong assignment of at least 34%. Therefore, errors are likely when distinguishing between HER2 scores of 0 and 1+ for these samples. For samples with RPPA signals higher than 1.0 au, there are always higher maximum probabilities than 91%, indicating a good assignment of samples to scores of 2+ and 3+. When each sample was assigned the most probable HER2 score based on the model, the concordance between IHC and RPPA was estimated as κ = 0.9 (95% confidence interval: 0.667, 0.963) with high significance (p ≤ 0.001). These findings were validated in a second and larger set of samples. This study included seven, nine, seven, and four samples for HER2 0, 1+, 2+, and 3+, respectively. Here, the concordance between IHC and RPPA was estimated as κ = 0.673 (95% confidence interval: 0.313, 0.881), confirming the relation with high significance (p ≤ 0.001).
Fig. 3.
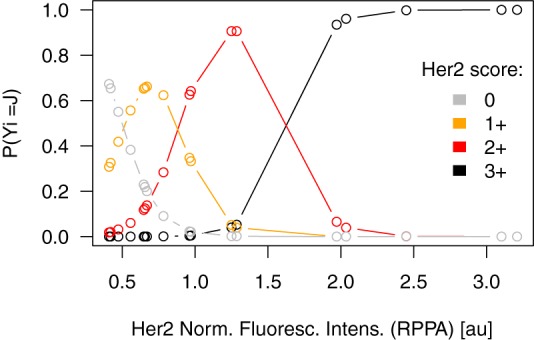
Ordinal multinomial model for HER2 score. This model shows the probability of each sample's assignment in one of the four categories for HER2 IHC staining based on the HER2 signal intensity obtained with RPPA.
Next, we wanted to predict the HER2 scores of samples of the validation set based on the model parameters estimated in the initial set by using the RPPA intensities of the new samples. The value ranges between the two sets were numerically adjusted in order to account for the batch effect. Supplemental Fig. S1 gives an overview of value ranges in the initial and validation sets before and after adjustment. The concordance was estimated with κ = 0.403 (95% confidence interval: 0.268, 0.626), again with high significance (p ≤ 0.001). Interestingly, when the model was trained on the validation set data to predict the HER2 scores of the initial samples using their RPPA intensities, the level of concordance increased to κ = 0.702 (95% confidence interval: 0.464, 0.805).
Comparison of HER2 RPPA Assay with HER2 FISH Assay
In Fig. 4, the status obtained with the FISH assay is plotted against the signal in RPPA. It was found via a one-sided Mann–Whitney test that RPPA could significantly differentiate (p ≤ 0.001) between negative and positive FISH status among the samples.
Fig. 4.

Comparison of FISH status and HER2 signal intensity (RPPA). This figure shows the HER2 signal intensity obtained with RPPA for the FISH negative and FISH positive samples.
RPPA Analysis of NSCLC Samples
Patient samples were matched by age and vendor. At the time of sample collection, the sample vendor was not known as a critical factor, but it was considered in the sample selection and randomization so as to avoid bias. Principal component analysis of all samples and RPPA signals revealed two outliers, which were removed from further analysis. Samples originating from the two different vendors could be perfectly separated using the 2nd Principal component. Therefore, the sample vendor factor has been considered as a random factor in a mixed-effects model. The positive controls napsin A and cytokeratin 5 (22) showed a significant effect between the two NSCLC subtypes (p ≤ 0.05). This was also apparent from visual inspections of the respective arrays (Fig. 5). After adjustment for multiple testing, the RPPA assay for PAK2 also displayed a significantly higher expression (Fig. 6) in SCC than in AC (pAdj = 0.008). This finding was also confirmed by Western blot (Fig. 7). A listing of all the analyzed proteins, including their p values and normalized RPPA intensities, is provided as supplemental Table S1.
Fig. 5.

RPPA images of cytokeratin 5 (A) and napsin A assay (B). Cytokeratin 5 antibody generated signals only at positions of AC samples, whereas napsin A antibody generated signals at positions of the SCC samples.
Fig. 6.
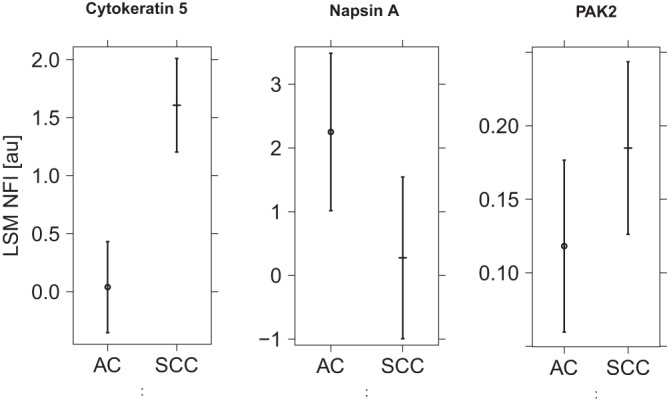
RPPA fluorescence intensity for cytokeratin 5, napsin A, and PAK2. The figure shows least square means and 95% confidence intervals for ACC and SCC as measured for cytokeratin 5, napsin A, and PAK2.
Fig. 7.
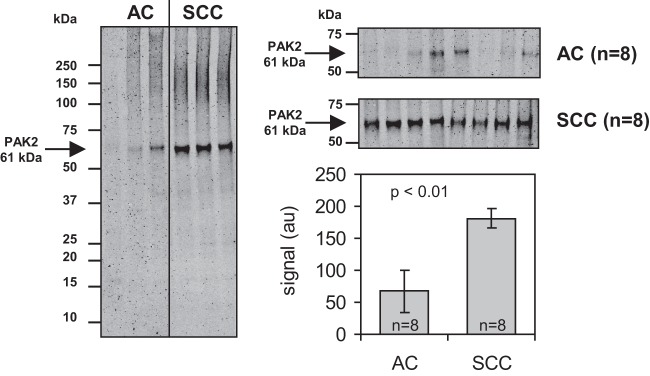
Immunodetection of PAK2 on Western blot with FFPE tissue extracts. Western blot was performed for 16 NSCLC samples (8 AC and 8 SCC samples) also measured with RPPA. Considerably higher signals for PAK2 (molecular weight: 61 kDa) were measured in SCC samples than in the AC samples.
DISCUSSION
The quantification of a protein in extracts from tissue depends on two factors: (i) the abundance of the protein of interest in the tissue, and (ii) whether the protein of interest can be quantitatively extracted out of the tissue. The IHC assay for HER2 is currently the gold standard for quantitative assessment of HER2 levels in breast cancer tissue and has been shown to provide clinically important prognostic and predictive information (23–27). The scoring system of this assay is based on the receptor number in the membranes of cancer cells: no staining (0), partial membrane staining (1+), light-to-moderate complete membrane staining (2+), and complete membrane staining (3+). Our hypothesis was that a reliable assessment of HER2 levels in breast cancer samples with RPPA should result in classification similar to that obtained with the IHC assay. A very good Spearman correlation coefficient between IHC and RPPA shows that this indeed is the case.
For a more appropriate comparison of the IHC and RPPA data, an ordinal multinomial logistic regression model was used that utilized the RPPA signal intensity to compute the probability that each sample would have a HER2 score equivalent to one of the IHC scores of 0 to 3+. This model shows a good assignment of RPPA signals to IHC scores of 2+ and 3+, whereas distinguishing between IHC scores of 0 and 1+ by RPPA is error prone. Additionally, when using this model, the agreement between IHC and RPPA for categorization was shown to be highly concordant. This positive finding owes partly to the fact that the model was trained and assessed with the same samples. The concordance of IHC and RPPA was confirmed in an independent validation sample set with high significance. Overall, the κ value was lower in the validation run. The validation sample set was procured from two different suppliers, which might have been a source of additional variability.
For IHC-based HER2 classification, evaluation by different observers does not result in complete interobserver agreement, despite the standardized scoring system of the HER2 IHC assay (28). In a study by Thomson et al. with three observers, a κ of 0.7 was obtained with this test (29). The Dako HercepTest is performed with the same antibody as used in our study for the assessment of HER2 levels with RPPA. Based on the κ estimates obtained in our study, the agreement between IHC and RPPA data in the initial set can be considered as very good (κ = 0.899), and that of the validation set as good (κ = 0.643). However, the true validation took place when the model parameters trained on the initial set were applied to predict the HER2 score using the RPPA intensities from the truly independent validation set (κ = 0.403), which confirmed the validity of the approach. If we had chosen to use set 1 as the validation set and set 2 as the prediction set, we could report a much better level of prediction, resulting in an agreement of κ = 0.702. This again emphasizes the need for well-characterized samples obtained by means of good standardized protocols.
Another assay for the detection of HER2 amplification and overexpression is based on the FISH technique (30–35). FISH is considered more objective and reproducible (34, 36–40). We therefore also tested the initial breast cancer sample set through FISH for HER2 positivity, and again good concordance between RPPA and FISH was demonstrated. RPPA analysis of FFPE breast cancer tissue could have allowed differentiation between HER2 negative and positive samples.
Based on the aforementioned results, we assume that HER2 can quantitatively be extracted out of FFPE tissue samples and that the RPPA analysis of these samples delivers biologically meaningful results. This outcome is supported by a recent study by Wulfkuhle et al. (41) showing that RPPA measurements of total HER2 protein can efficiently discriminate dichotomized HER2 status (negative: HER2 IHC 0 or 1+ and 2+/FISH−; positive: HER2 IHC 2+/FISH+ and IHC 3+) as determined by IHC or FISH measurements, or both, in the same tissue.
In a second study on NSCLC, we further demonstrated the validity of RPPA profiling of FFPE tissue by confirming two markers, cytokeratin 5 and napsin A, known to be differentially expressed between two NSCLC subtypes (AC and SCC) (22). In an analysis of more than 150 proteins, increased expression of PAK2 in SCC relative to AC was shown and was orthogonally verified by means of Western blot analysis.
The p21-activated kinases (PAKs) are a family of serine/threonine protein kinases that are activated in response to extracellular signals (through both GTPase-dependent and -independent mechanisms) and regulate a wide variety of cellular processes including cell morphogenesis, motility, apoptosis, and cell cycle regulation. In epithelial cancer cells, the expression of PAKs promotes migration and increases anchorage-independent growth (42). Increased expression of PAK1 was found to be significantly associated with the malignant progression of human colorectal carcinoma (43) and with tamoxifen resistance in hormone-receptor-positive breast tumor from premenopausal patients (44). Interestingly, strong PAK1 expression was described as prevalent in SCC (45). PAK2 might play a similar role in tumorigenesis. However, the relationship between PAK2 activity and cell survival appears to be complex. PAK2 is unique among the PAKs in that it is also activated through proteolytic cleavage by caspases or caspase-like proteases. Whereas the activation of PAK2 by Rac or CDC42, as with PAK1, promotes cell survival by phosphorylating Bad and Bcl-2 (46), apoptotic stimuli such as DNA damage lead to proteolytic cleavage of PAK2, generating a p34 fragment. The activated p34 fragment leads to extensive membrane blebbing, cytoplasmic shrinkage, and apoptosis (47, 48). This strongly suggests that PAK2 could be helpful for the diagnosis and/or identification of new treatment targets of SCC.
Through two separate studies on breast cancer and NSCLC, we were able to demonstrate that RPPA analysis of FFPE tissue lysates gives rise to biologically meaningful data. FFPE is the fixation of choice in the clinical routine for preserving human tissue samples. Our findings encourage the application of RPPA in different tissues and disease contexts for detecting differences in protein expression and activation levels that could be beneficial for different purposes such as understanding disease mechanisms, the identification of new targets for drug development, distinction among tumor subtypes for diagnosis, or the stratification of patients for therapy regimens. Overall, the outcome of our study demonstrates the usefulness of RPPA as a screening tool for the selection of candidate proteins for the above-mentioned purposes.
Acknowledgments
We thank Y. Heubach and P. Graemmel for excellent technical assistance.
Footnotes
 This article contains supplemental material.
1 The abbreviations used are::
- AC
- adenocarcinoma
- FFPE
- formalin-fixed and paraffin embedded
- FISH
- fluorescence in situ hybridization
- HER2
- human epidermal growth factor receptor 2
- IHC
- immunohistochemistry
- NSCLC
- non-small cell lung cancer
- PAK
- p21-activated kinase
- PAK2
- p21-activated kinase 2
- RPPA
- reverse phase protein array
- SSC
- squamous cell carcinoma.
REFERENCES
- 1. Hopkins A. L. (2008) Network pharmacology: the next paradigm in drug discovery. Nat. Chem. Biol. 4, 682–690 [DOI] [PubMed] [Google Scholar]
- 2. Malinowsky K., Wolff C., Ergin B., Berg D., Becker K. F. (2010) Deciphering signaling pathways in clinical tissues for personalized medicine using protein microarrays. J. Cell. Physiol. 225, 364–370 [DOI] [PubMed] [Google Scholar]
- 3. Wilson B., Liotta L. A., Petricoin E., 3rd (2010) Monitoring proteins and protein networks using reverse phase protein arrays. Dis. Markers 28, 225–232 [DOI] [PMC free article] [PubMed] [Google Scholar]
- 4. Voshol H., Ehrat M., Traenkle J., Bertrand E., van Oostrum J. (2009) Antibody-based proteomics: analysis of signaling networks using reverse protein arrays. FEBS J. 276, 6871–6879 [DOI] [PubMed] [Google Scholar]
- 5. Becker K. F., Schott C., Hipp S., Metzger V., Porschewski P., Beck R., Nahrig J., Becker I., Höfler H. (2007) Quantitative protein analysis from formalin-fixed tissues: implications for translational clinical research and nanoscale molecular diagnosis. J. Pathol. 211, 370–378 [DOI] [PubMed] [Google Scholar]
- 6. Chu W. S., Liang Q., Liu J., Wei M. Q., Winters M., Liotta L., Sandberg G., Gong M. (2005) A nondestructive molecule extraction method allowing morphological and molecular analyses using a single tissue section. Lab. Invest. 85, 1416–1428 [DOI] [PubMed] [Google Scholar]
- 7. Ikeda K., Monden T., Kanoh T., Tsujie M., Izawa H., Haba A., Ohnishi T., Sekimoto M., Tomita N., Shiozaki H., Monden M. (1998) Extraction and analysis of diagnostically useful proteins from formalin-fixed, paraffin-embedded tissue sections. J. Histochem. Cytochem. 46, 397–403 [DOI] [PubMed] [Google Scholar]
- 8. Nirmalan N. J., Harnden P., Selby P. J., Banks R. E. (2009) Development and validation of a novel protein extraction methodology for quantitation of protein expression in formalin-fixed paraffin-embedded tissues using western blotting. J. Pathol. 217, 497–506 [DOI] [PubMed] [Google Scholar]
- 9. Chung J. Y., Lee S. J., Kris Y., Braunschweig T., Traicoff J. L., Hewitt S. M. (2008) A well-based reverse-phase protein array applicable to extracts from formalin-fixed paraffin-embedded tissue. Proteomics Clin. Appl. 2, 1539–1547 [DOI] [PMC free article] [PubMed] [Google Scholar]
- 10. Shi S. R., Liu C., Balgley B. M., Lee C., Taylor C. R. (2006) Protein extraction from formalin-fixed, paraffin-embedded tissue sections: quality evaluation by mass spectrometry. J. Histochem. Cytochem. 54, 739–743 [DOI] [PubMed] [Google Scholar]
- 11. Becker K. F., Schott C., Becker I., Höfler H. (2008) Guided protein extraction from formalin-fixed tissues for quantitative multiplex analysis avoids detrimental effects of histological stains. Proteomics Clin. Appl. 2, 737–743 [DOI] [PubMed] [Google Scholar]
- 12. Addis M. F., Tanca A., Pagnozzi D., Crobu S., Fanciulli G., Cossu-Rocca P., Uzzau S. (2009) Generation of high-quality protein extracts from formalin-fixed, paraffin-embedded tissues. Proteomics 9, 3815–3823 [DOI] [PubMed] [Google Scholar]
- 13. Nirmalan N. J., Harnden P., Selby P. J., Banks R. E. (2009) Development and validation of a novel protein extraction methodology for quantitation of protein expression in formalin-fixed paraffin-embedded tissues using Western blotting. J. Pathol. 217, 497–506 [DOI] [PubMed] [Google Scholar]
- 14. Wolff A. C., Hammon E. H., Schwartz J. N., Hagerty K. L., Allred D. C., Cote R. J., Dowett M., Fitzgibbons P. L., Hanna W. M., Langer A., McShane L. M., Paik S., Pegram M. D., Perez E. A., Press M. F., Rhodes A., Sturgeon C., Taube S. E., Tubbs R., Vance G. H., van de Vijver M., Wheeler T. M., Hayes D. F. (2007) American Society of Clinical Oncology/College of American Pathologists guideline recommendations for human epidermal growth factor receptor 2 testing in breast cancer. Arch. Pathol. Lab. Med. 131, 18–43 [DOI] [PubMed] [Google Scholar]
- 15. Pawlak M., Schick E., Bopp M. A., Schneider M. J., Oroszlan P., Ehrat M. (2002) Zeptosens' protein microarrays: a novel high performance microarray platform for low abundance protein analysis. Proteomics 2, 383–393 [DOI] [PubMed] [Google Scholar]
- 16. R Development Core Team (2008) R: A Language and Environment for Statistical Computing, R Foundation for Statistical Computing, Vienna, Austria [Google Scholar]
- 17. Gamer M., Lemon J., Fellows I. (2009) irr: Various Coefficients of Interrater Reliability and Agreement, R package version 0.82 R Foundation for Statistical Computing, Vienna, Austria [Google Scholar]
- 18. Venables W. N., Ripley B. D. (2002) Modern Applied Statistics with S, Springer, New York [Google Scholar]
- 19. Faraway J. J. (2006) Extending the Linear Model with R: Generalized Linear, Mixed Effects and Nonparametric Regression Models, Chapman & Hall/CRC, Boca Raton, FL [Google Scholar]
- 20. Agresti A. (2007) An Introduction to Categorical Data Analysis, Wiley Series in Probability and Statistics, Wiley-Interscience, Hoboken, NJ [Google Scholar]
- 21. Bates D., Maechler M., Bolker B. (2011) lme4: Linear Mixed-effects Models Using S4 classes, R package version 0.999375–42 R Foundation for Statistical Computing, Vienna, Austria [Google Scholar]
- 22. Mukhopadhyay S., Katzenstein A. L. (2011) Subclassification of non-small cell lung carcinomas lacking morphological differentiation on biopsy specimens: utility of an immunohistochemical panel containing TTF-1, napsin A, p63, and CK5/6. Am. J. Surg. Pathol. 35, 15–25 [DOI] [PubMed] [Google Scholar]
- 23. Navolanic P. M., Steelman L. S., McCubrey J. A. (2003) EGFR family signaling and its association with breast cancer development and resistance to chemotherapy (review). Int. J. Oncol. 22, 237–252 [PubMed] [Google Scholar]
- 24. Ross J. S., Fletcher J. A., Bloom K. J., Linette G. P., Stec J., Symmans W. F., Pusztai L., Hortobagyi G. N. (2004) Targeted therapy in breast cancer: the HER-2/neu gene and protein. Mol. Cell. Proteomics 3, 379–398 [DOI] [PubMed] [Google Scholar]
- 25. Hayes D. F., Thor A. D. (2002) c-erbB-2 in breast cancer: development of a clinically useful marker. Semin. Oncol. 29, 231–245 [DOI] [PubMed] [Google Scholar]
- 26. Masood S., Bui M. M. (2002) Prognostic and predictive value of HER2/neu oncogene in breast cancer. Microsc. Res. Tech. 59, 102–108 [DOI] [PubMed] [Google Scholar]
- 27. Schnitt S. J., Jacobs T. W. (2001) Current status of HER2 testing: caught between a rock and a hard place. Am. J. Clin. Pathol. 116, 806–810 [DOI] [PubMed] [Google Scholar]
- 28. Kay E. W., Walsh C. J., Cassidy M., Curran B., Leader M. (1994) C-erbB-2 immunostaining: problems with interpretation. J. Clin. Pathol. 47, 816–822 [DOI] [PMC free article] [PubMed] [Google Scholar]
- 29. Thomson T. A., Hayes M. M., Spinelli J. J., Hilland E., Sawrenko C., Phillips D., Dupuis B., Parker R. L. (2001) HER-2/neu in breast cancer: interobserver variability and performance of immunohistochemistry with 4 antibodies compared with fluorescent in situ hybridization. Mod. Pathol. 14, 1079–1086 [DOI] [PubMed] [Google Scholar]
- 30. Seelig S. (1999) Fluorescence in situ hybridization versus immunohistochemistry: importance of clinical outcome. J. Clin. Oncol. 17, 3690–3692 [DOI] [PubMed] [Google Scholar]
- 31. Lal P., Salazar P. A., Hudis C. A., Ladanyi M., Chen B. (2004) HER-2 testing in breast cancer using immunohistochemical analysis and fluorescence in situ hybridization: a single-institution experience of 2,279 cases and comparison of dual-color and single-color scoring. Am. J. Clin. Pathol. 121, 631–636 [DOI] [PubMed] [Google Scholar]
- 32. Owens M. A., Horten B. C., Da Silva M. M. (2004) HER2 amplification ratios by fluorescence in situ hybridization and correlation with immunohistochemistry in a cohort of 6556 breast cancer tissues. Clin. Breast Cancer 5, 63–69 [DOI] [PubMed] [Google Scholar]
- 33. Press M. F., Sauter G., Bernstein L., Villalobos I. E., Mirlacher M., Zhou J. Y., Wardeh R., Li Y. T., Guzman R., Ma Y., Sullivan-Halley J., Santiago A., Park J. M., Riva A., Slamon D. J. (2005) Diagnostic evaluation of HER-2 as a molecular target: an assessment of accuracy and reproducibility of laboratory testing in large, prospective, randomized clinical trials. Clin. Cancer Res. 11, 6598–6607 [DOI] [PubMed] [Google Scholar]
- 34. Tubbs R. R., Hicks D. G., Cook J., Downs-Kelly E., Pettay J., Hartke M. B., Hood L., Neelon R., Myles J., Budd G. T., Moore H. C., Andresen S., Crowe J. P. (2007) Fluorescence in situ hybridization (FISH) as primary methodology for the assessment of HER2 status in adenocarcinoma of the breast: a single institution experience. Diagn. Mol. Pathol. 16, 207–210 [DOI] [PubMed] [Google Scholar]
- 35. Ross J. S., Symmans W. F., Pusztai L., Hortobagyi G. N. (2007) Standardizing slide-based assays in breast cancer: hormone receptors, HER2, and sentinel lymph nodes. Clin. Cancer Res. 13, 2831–2835 [DOI] [PubMed] [Google Scholar]
- 36. Dendukuri N., Khetani K., McIsaac M., Brophy J. (2007) Testing for HER2-positive breast cancer: a systematic review and cost-effectiveness analysis. CMA J. 176, 1429–1434 [DOI] [PMC free article] [PubMed] [Google Scholar]
- 37. Carlson R. W., Moench S. J., Hammond M. E., Perez E. A., Burstein H. J., Allred D. C., Vogel C. L., Goldstein L. J., Somlo G., Gradishar W. J., Hudis C. A., Jahanzeb M., Stark A., Wolff A. C., Press M. F., Winer E. P., Paik S., Ljung B. M. (2006) HER2 testing in breast cancer: NCCN Task Force report and recommendations. J. Natl. Compr. Canc. Netw. 4 Suppl 3, S1-S22 [PubMed] [Google Scholar]
- 38. Cuadros M., Villegas R. (2009) Systematic review of HER2 breast cancer testing. Appl. Immunohistochem. Mol. Morphol. 17, 1–7 [DOI] [PubMed] [Google Scholar]
- 39. Perez E. A., Baweja M. (2008) HER2-positive breast cancer: current treatment strategies. Cancer Invest. 26, 545–552 [DOI] [PubMed] [Google Scholar]
- 40. Hicks D. G., Kulkarni S. (2008) Trastuzumab as adjuvant therapy for early breast cancer: the importance of accurate human epidermal growth factor receptor 2 testing. Arch. Pathol. Lab. Med. 132, 1008–1015 [DOI] [PubMed] [Google Scholar]
- 41. Wulfkuhle J. D., Berg D., Wolff C., Langer R., Tran K., Illi J., Espina V., Pierobon M., Deng J., DeMichele A., Walch A., Bronger H., Becker I., Waldhör C., Höfler H., Esserman L; I-SPY 1 TRIAL Investigators, Liotta L. A., Becker K.-F., Petricoin E. F. (2012) Molecular analysis of HER2 breast cancer by functional protein pathway activation mapping. Clin. Cancer Res. 18, 6426–6435 [DOI] [PMC free article] [PubMed] [Google Scholar]
- 42. Kumar R., Vadlamudi R. K. (2002) Emerging functions of p21-activated kinases in human cancer cells. J. Cell. Physiol. 193, 133–144 [DOI] [PubMed] [Google Scholar]
- 43. Carter J. H., Douglass L. E., Deddens J. A., Colligan B. M., Bhatt T. R., Pemberton J. O., Konicek S., Hom J., Marshall M., Graff J. R. (2004) Pak-1 expression increases with progression of colorectal carcinomas to metastasis. Clin. Cancer Res. 10, 3448–3456 [DOI] [PubMed] [Google Scholar]
- 44. Holm C., Rayala S., Jirström K., Stål O., Kumar R., Landberg G. (2006) Association between Pak1 expression and subcellular localization and tamoxifen resistance in breast cancer patients. J. Natl. Cancer Inst. 98, 671–680 [DOI] [PubMed] [Google Scholar]
- 45. Ong C. C., Jubb A. M., Haverty P. M., Zhou W., Tran V., Truong T., Turley H., O'Brien T., Vucic D., Harris A. L., Belvin M., Friedman L. S., Blackwood E. M., Koeppen H., Hoeflich K. P. (2011) Targeting p21-activated kinase 1 (PAK1) to induce apoptosis of tumor cells. Proc. Natl. Acad. Sci. U.S.A. 108, 7177–7182 [DOI] [PMC free article] [PubMed] [Google Scholar]
- 46. Jakobi R., Moertl E., Koeppel M. A. (2001) p21-activated protein kinase gamma-PAK suppresses programmed cell death of BALB3T3 fibroblasts. J. Biol. Chem. 276, 16624–16634 [DOI] [PubMed] [Google Scholar]
- 47. Rudel T., Bokoch G. M. (1997) Membrane and morphological changes in apoptotic cells regulated by caspase-mediated activation of PAK2. Science 276, 1571–1574 [DOI] [PubMed] [Google Scholar]
- 48. Jakobi R., McCarthy C. C., Koeppel M. A., Stringer D. K. (2003) Caspase-activated PAK-2 is regulated by subcellular targeting and proteasomal degradation. J. Biol. Chem. 278, 38675–38685 [DOI] [PubMed] [Google Scholar]