

Abstract
We present the first comprehensive capillary electrophoresis electrospray ionization mass spectrometry (CESI-MS) analysis of post-translational modifications derived from H1 and core histones. Using a capillary electrophoresis system equipped with a sheathless high-sensitivity porous sprayer and nano–liquid chromatography electrospray ionization mass spectrometry (nano-LC-ESI-MS) as two complementary techniques, we characterized H1 histones isolated from rat testis. Without any pre-separation of the perchloric acid extraction, a total of 70 different modified peptides, including 50 phosphopeptides, were identified in the rat linker histones H1.0, H1a-H1e, and H1t. Out of the 70 modified H1 histone peptides, 27 peptides could be identified with CESI-MS only, and 11 solely with LC-ESI-MS. Immobilized metal-affinity chromatography enrichment prior to MS analysis yielded a total of 55 phosphopeptides; 22 of these peptides could be identified only by CESI-MS, and 19 only by LC-ESI-MS, showing the complementarity of the two techniques. We mapped 42 H1 modification sites, including 31 phosphorylation sites, of which 8 were novel sites. For the analysis of core histones, we chose a different strategy. In a first step, the sulfuric-acid-extracted core histones were pre-separated using reverse-phase high-performance liquid chromatography. Individual rat testis core histone fractions obtained in this way were digested and analyzed via bottom-up CESI-MS. This approach yielded the identification of 42 different modification sites including acetylation (lysine and Nα-terminal); mono-, di-, and trimethylation; and phosphorylation. When we applied CESI-MS for the analysis of intact core histone subtypes from butyrate-treated mouse tumor cells, we were able to rapidly detect their degree of modification, and we found this method very useful for the separation of isobaric trimethyl and acetyl modifications. Taken together, our results highlight the need for additional techniques for the comprehensive analysis of post-translational modifications. CESI-MS is a promising new proteomics tool as demonstrated by this, the first comprehensive analysis of histone modifications, using rat testis as an example.
Histones are the most intensively studied group of basic nuclear proteins and are of great importance with regard to the organization of chromatin structure and control of gene activity. They are highly conserved during evolution, binding to and condensing eukaryotic chromosomal DNA to form chromatin. The fundamental chromatin subunit is the nucleosome, in which 166 bp of DNA are wrapped around a core histone octamer and a further ∼40 bp constitute the linker between one nucleosome core and the next. The histone octamer contains two molecules of each of the core histones H2A, H2B, H3, and H4. A fifth type of histone, referred to as linker histone (H1, H5), binds to both the DNA on the outer surface of nucleosomes and the linker DNA.
There are numerous microsequence variants of linker and core histones (except H4) differing only slightly in primary sequence. In rat testis, for example, six somatic H1 subtypes, designated as H1a, H1b, H1c, H1d, H1e, and H1.0, as well as germ cell specific subtypes (i.e. H1t, H1T2, and HILS1), have been identified (1–3). Under various biological conditions, all histone proteins, for both linker and core histones, are subjected to post-translational modifications, including phosphorylation, acetylation, methylation, ubiquitination, deamidation, glycosylation, and ADP-ribosylation, which have a great influence on the epigenetic control of gene expression (4–6). The multitude of histone proteins resulting from closely related sequence variants and post-translational modifications, as well as their highly basic nature combined with hydrophobic properties, provides a major analytical challenge in current proteomics research. Over the past several years, considerable efforts have been expended to develop methods to identify the specific sites of histone modifications. Mass spectrometry (MS) coupled to liquid chromatography (LC) is the dominant technique for their characterization (7–14). However, because histone proteins contain up to nearly 35% basic amino acids, the analysis of histone peptides is still problematic, as digestion with many commonly used enzymes (e.g. trypsin, Lys-C, etc.) causes the formation of many short and polar peptides that poorly interact with the reverse-phase (RP)1 material and go undetected by conventional liquid chromatography electrospray ionization mass spectrometry (LC-ESI-MS). To overcome this problem, chemical derivatization such as propionylation is often applied (15, 16).
Capillary electrophoresis (CE) overcomes this disadvantage; this technique allows separations based on the mass-to-charge ratio of peptides and does not utilize their hydrophobic nature as a separation principle. The methods of electrophoresis and LC and their applicability for histone analysis have been reviewed in detail by Lindner (17). CE has proven to be a remarkably powerful method for separating individual histones and their modified forms based on their different electrophoretic mobilities. Using a bare fused silica capillary and hydroxypropylmethyl cellulose (HPMC) as a buffer additive in order to avoid undesired protein adsorption, different core and linker histones and their multiply phosphorylated and acetylated forms were successfully separated via capillary zone electrophoresis (CZE) (18–22). So far, no data have been published about the identification of histone modifications by means of capillary electrophoresis electrospray ionization mass spectrometry (CESI-MS). LC is given preference over CE because of the difficulty of achieving on-line interfacing of CE with MS that allows stable electrospray processes without compromising the quality of separation or the detection sensitivity. However, CE-MS is a promising technique with constantly increasing importance, as documented by numerous articles (23–26).
Various interfaces have been constructed to improve CESI-MS coupling (27, 28). Sheathflow interfaces are the most widely used, and although the drawback of having to dilute the analyte is inherent in this kind of interface, they offer stable electrophoretic separations and allow greater versatility in the choice of background electrolyte (BGE) and the range of flow rates (29–32). Sheathless interfaces have generated interest because no sheath liquid is added, which leads to enhanced detection sensitivity (33, 34). However, they have not been used frequently because of their limited robustness and lack of well-established interfaces and routine analysis protocols. The most widely used method for establishing the terminating electrical contact is coating the outer surface of the CE capillary tip with a conductive material (35–37). Unfortunately, the lifetimes of such coatings are generally very limited, as they suffer from deterioration under the influence of the high voltages applied.
A recently published concept of a sheathless interface based on a separation capillary with a porous tip acting as a nanospray emitter overcomes these disadvantages (38). The capillary tip is etched using hydrofluoric acid until the capillary wall becomes so thin and porous that an electric contact can be established. The performance of this methodology, which combines the low-flow characteristics of CE with an integrated ESI source, is described in Refs. 39–41. Applications such as the analysis of intact proteins (42), protein–protein and protein–metal complexes (43), and ribosomal protein digests from E. coli (44) have been published. Method-inherent advantages of CESI-MS are highly efficient separations, low flow rates leading to reduced ion suppression, and greater sensitivity (40). In contrast to nano-LC, no column equilibration is needed, there are no gradient effects, and the instrumentation is less maintenance-intensive.
Our group recently described important features of CESI-MS and reported the comparison of this method with LC-ESI-MS for the analysis of a 5% perchloric acid extraction of rat testis consisting mainly of different histone H1 subtypes (39). The performance of both techniques was evaluated regarding analysis time, protein sequence coverage, and number and molecular mass distribution of the identified peptides. The CESI-MS method provided shorter analysis times, narrower peaks yielding high signals, and the identification of a greater number of low molecular mass range peptides than LC-ESI-MS (39).
In the current study, we investigated the analysis of post-translationally modified peptides, particularly phosphopeptides, obtained from endoproteinase Arg-C digested histones from rat testis; this organ contains the whole set of somatic and germ cell specific H1 histones, as well as numerous modified core histone proteins. CESI-MS and LC-ESI-MS were compared regarding the number and type of identified modified peptides. Without any pre-separation of the perchloric acid extraction, we found numerous known and novel modification sites in linker histones. In addition, immobilized metal-affinity chromatography (IMAC) experiments were utilized to enrich phosphopeptides prior to MS analysis. CESI-MS was also used for the rapid identification of post-translational modifications (PTMs) of rat testis core histones, which were pre-fractionated via RP-HPLC and digested with Arg-C. Using core histones from butyrate-treated mouse erythroleukemia cells, we further demonstrated that our method achieves excellent separations of intact histone subtypes and their multiply modified forms and enables the detection of the extent of PTMs in a fast and reproducible way. Our work represents the first detailed characterization of modified linker and core histone peptides and clearly demonstrates that CESI-MS is a promising alternative tool for epigenetic studies.
EXPERIMENTAL PROCEDURES
Materials
Hydrochloric acid and sodium tetraborate were purchased from Merck (Darmstadt, Germany). The polyethyleneimine (PEI) coating trimethoxysilylpropyl(polyethyleneimine) was provided by Beckman Coulter (Brea, CA), and the coating reagent M7C4I (1-(4-iodobutyl) 4-aza-1-azoniabicyclo[2,2,2] octane iodide) was prepared according to Sebastiano et al. (45). All other chemicals were purchased from Sigma-Aldrich (Vienna, Austria). Water was purified with a Milli-Q water purification system (Millipore, Vienna, Austria).
Histone Preparation
Nuclei from rat testes (Sprague-Dawley) were extracted with perchloric acid (5%, v/v) for H1 histone preparation, and this was followed by 0.2 m sulfuric acid for core histone preparation (46). Mouse erythroleukemia cells were grown and treated with 1.75 mm sodium butyrate (10 h) as described previously (47).
CZE
CZE of whole H1 histones was performed on a Beckman system P/ACE 5000 using an uncoated capillary (50 cm in length, 75 μm inner diameter) and a 0.5 m sodium phosphate buffer (pH 2.0) containing 0.02% HPMC (21). For the separation of deamidated H1.0, a 0.1 m sodium phosphate buffer (pH 3.5) containing 0.02% HPMC was used.
Enzymatic Cleavage
Histones were digested using endoproteinase Arg-C (EC 3.4.21.35) (1:20, w/w; Sigma-Aldrich) in 5 mm NH4HCO3 buffer (pH 8.0). H1 histones were incubated for 1 h at 37 °C; core histones were incubated for 30 min at 37 °C.
Phosphopeptide Enrichment
IMAC was performed using PHOS-Select™ Iron Affinity Gel (Product No. P9740) and the SigmaPrep Spin Column kit (Product No. SC1000), both obtained from Sigma-Aldrich (Vienna, Austria). 5 μg of Arg-C H1 histone digest were applied, and 140 μl 400 mm ammonium hydroxide was used as the elution solution.
CESI-MS
A Beckman Coulter prototype CESI capillary electrophoresis system equipped with a sheathless high-sensitivity porous sprayer was used for peptide separation and ionization upstream from MS characterization. Fused silica capillaries (total length, 100 cm; inner diameter, 30 μm; outer diameter, 150 μm; Beckman Coulter) with a terminal 3-cm-long porous segment were inserted into the prototype sprayer interface, enabling electric contact via a secondary capillary (length, 80 cm; inner diameter, 50 μm; outer diameter, 360 μm) filled with BGE.
The separation capillaries were modified with three different coatings; one generated a non-charged inner capillary surface, and the other two generated positively charged surfaces (PEI and M7C4I). A positively charged surface induces a reversed electroosmotic flow (EOF) that is directed to the MS orifice when a negative voltage is applied at the CE inlet. The non-charged, neutral surface suppresses EOF. The procedure for PEI coating was as follows: (i) Preconditioning: flush each for 5 min at 50 psi with methanol, MilliQ-water, 0.1 m NaOH, 0.1 m HCl, and MilliQ-water (porous tip placed in MilliQ-water during this procedure). (ii) Coating: rinse with methanol (10 min), air (20 min), and 20% (v/v) coating solution in pure methanol (20 min) at 50 psi (porous tip placed in methanol). The coating solution was left in the capillary for 12 h. (iii) Postconditioning (next day): flush each for 20 min at 50 psi with air, methanol, and MilliQ-water. Coating with M7C4I was performed according to Elhamili et al. (48), with slight modifications. The capillary was treated for 8 min with 0.1 m NaOH and 2 min with 25 mm sodium tetraborate buffer at pH 9, followed by treatment with 4 mm M7C4I modifier solution in 25 mm sodium tetraborate buffer at pH 9 for 20 min. All steps were carried out at 50 psi. The capillary was kept dry until use. The neutral capillary was provided by Beckman Coulter, Inc.
CE conditions were as follows: The separation capillary and the conductive liquid capillary were rinsed with BGE to refresh the buffer. The sample was injected for 10 s at 5 psi (7.5 nl), and this was followed by an injection plug of BGE (5 psi for 5 s). Using positively charged capillaries, the separation was performed at −12.5 kV or −25 kV applied in a 0.5 min-ramp (reversed polarity mode); 0.1% to 0.6% (v/v) formic acid was used as the BGE. Using neutral coated capillaries, the separation was performed at +30 kV applied in a 1-min ramp (normal polarity mode), and a pressure gradient was applied at the capillary inlet. The gradient profile was as follows: 0–43 min, 0.5 psi; 43–51 min, 2 psi; and 51–60 min, 5 psi. Acetic acid 10% (v/v) was used as the BGE for separations using neutral coated capillaries.
Nano-HPLC
Protein digests were analyzed using an UltiMate 3000 nano-HPLC system (Dionex, Germering, Germany) coupled to an LTQ Orbitrap XL mass spectrometer equipped with a nanospray ionization source. A homemade fritless fused silica microcapillary column (75 μm inner diameter × 280 μm outer diameter) packed with 10 cm of 3 μm RP C18 material (Reprosil) was used. The gradient (solvent A: 0.1% formic acid; solvent B: 0.1% formic acid in 85% acetonitrile) started at 4% B. The concentration of solvent B was increased linearly from 4% to 50% over 50 min and from 50% to 100% over 5 min. A flowrate of 250 nl/min was applied.
Mass Spectrometry of Arg-C Histone Digests
The LTQ Orbitrap XL mass spectrometer operated in data-dependent mode, switching among MS, MS2, and MS3 acquisition. Survey full-scan MS spectra (m/z 250–1800) were acquired in the Orbitrap with a resolution of r = 15,000 (Fourier transform MS). Up to three of the most intense ions detected in the full-scan MS were isolated and fragmented in the linear ion trap (LTQ) using collision-induced dissociation. An activation time of 30 ms was applied in MS/MS acquisitions. The normalized collision energy was set at 35%. The ion selection threshold was 1000 counts with an activation q = 0.25.
Single charged ions were excluded from MS/MS. A neutral loss of 49, 32.66, or 24.5 detected in one of the three most intense ions in MS2 was decisive for MS3, which was performed to reaffirm the peptide sequence. Dynamic exclusion was enabled with a repeat count of 2 over a duration of 3 s and an exclusion window of 30 s.
Database Search
MS/MS and MS3 spectra were searched against a rat database (rat International Protein Index, version 3.81, 39,602 entries) via Sequest, ProteomeDiscoverer (Version 1.3, Thermo Scientific). Database search criteria were set as follows: processing MSn: allowed cleavage sites, Lys and Arg; maximum number of missed cleavage sites of six (linker histone samples) or eight (core histone samples); precursor tolerance, 10 ppm; fragment mass tolerance, 0.8 Da. Variable modifications were acetylation (+42.011) at Lys and N-terminus; phosphorylation (+79.966) at Ser, Thr, and Tyr; deamidation (+0.984) at Asn; ubiquitination (+114.043) at Lys; methylation (+14.016); dimethylation (+28.031) at Lys and Arg; and trimethylation (+42.047) at Lys. Up to four modifications were allowed per peptide.
For the Sequest search, the identified peptides were further evaluated using charge state versus cross-correlation number (Xcorr). The criteria for the positive identification of histone peptides were Xcorr > 2.0 for doubly charged ions, Xcorr > 2.5 for triply charged ions, and Xcorr > 3 for 4-fold and higher charged ions. Only best matches were considered. Phosphosites were localized at a false localization rate of less than 5% using phosphoRS site probability ≥ 0.95. The searched peptides and proteins were further validated by Percolator Peptide FDR based on the q-value. Relative peptide quantification was performed using precursor ion areas, which were calculated at a mass precision of 2 ppm.
Mass Spectrometry of Intact Core Histones
Approximately 10 ng of each protein fraction pre-fractionated via RP-HPLC was analyzed using CESI-MS. Survey full-scan MS spectra (m/z 300–2000) were acquired in the Orbitrap with a resolution of r = 100,000 (Fourier transform MS). Protein masses were determined by means of deconvolution using the integrated Xcalibur Xtract software (Thermo Scientific).
RESULTS
Occurrence of H1 Subtypes in Rat Testis
CE has already proved useful for the analysis of core and linker histone proteins in order to determine both the proportion of the various subtypes and the degree of PTM (for a review, see Ref. 17). To verify the quality and the composition of the linker histone sample prepared via 5% perchloric acid extraction, we separated whole H1 histones isolated from rat testis using CZE with an uncoated capillary and a 0.5 m sodium phosphate buffer (pH 2.0) containing 0.02% HPMC (Fig. 1). Under these conditions, complete resolution of the six somatic subtypes, designated as H1a, H1b, H1c, H1d, H1e, and H1.0, as well as the testis specific subtype H1t, could be achieved (21). They are expressed at very different levels and are modified (e.g. phosphorylated) to different degrees. Using hydrophilic-interaction liquid chromatography (HILIC), we found that rat histone H1.0 consists of a mixture of intact (H1.0 Asn-3) and in vivo deamidated forms (H1.0 Asp-3, H1.0 isoAsp-3). All three forms appear acetylated and non-acetylated on their N-terminus, and both the N-terminally acetylated and the deamidated forms accumulate with aging (49, 50). By applying a 0.1 m sodium phosphate buffer and increasing the buffer pH from 2.0 to 3.5, we were able to demonstrate for the first time that CE is also capable of resolving these deamidated forms (as shown in the inset of Fig. 1). Because of their lower positive charge, the deamidated forms migrate slower than the corresponding non-deamidated protein.
Fig. 1.

CZE separation of H1 histones from rat testis carried out in 0.5 m sodium phosphate buffer at pH 2.0 containing 0.02% HPMC and (inset) the separation of histone H1.0 carried out in 0.1 m sodium phosphate buffer at pH 3.5 containing 0.02% HPMC. Running conditions were as follows: injection time, 2 s; UV detection at 200 nm; voltage, 12 kV; untreated capillary (50 cm in length; 75 μm inner diameter). ac0, ac1: non-acetylated and monoacetylated forms; p0, p1, p2: non-, mono-, di-, and triphosphorylated forms.
CESI-MS/MS Analysis of Arg-C Digested Histone H1 Peptides
Rat testis H1 histones were digested with endoproteinase Arg-C, which preferentially cleaves after arginine residues, although hydrolysis proceeds to a minor degree in most Lys-containing substrates, creating a complex mixture of highly multiply charged H1 peptides with appropriate molecular masses for ESI-MS/MS.
For CESI-MS analysis, two different types of positively charged coatings were compared, PEI and M7C4I (48). With diluted formic acid used as a BGE, both surface modifications generate a reversed EOF toward the MS inlet when working in the reversed mode. Under these conditions, the positively charged peptide ions migrate toward the cathode inlet and actually out of the capillary. However, because of the positive charge of the modified capillary surface, the magnitude of the EOF generated is much greater than the electrophoretic mobility of the peptides and therefore moves the bulk solution toward the inlet of the MS instrument.
Fig. 2A shows the base peak electropherogram of 300 fmol histone H1 digest obtained with the PEI coated capillary, 0.1% formic acid as a BGE, and a separation voltage of −25 kV. Because of the strong positively charged coating, a rather high electroosmotic flow rate of ∼120 to 135 nl/min was generated, resulting in very short migration times (39). The sample was run in triplicate, and MS/MS spectra obtained were searched against the International Protein Index rat database. Within a separation window of about 3.5 min and a total analysis time of less than 10 min, 83 histone peptides (71 unmodified and 12 modified peptides) were identified (Fig. 5A). Using the same separation conditions but an M7C4I-coated capillary, which is less positively charged than PEI and generates flow rates in the range of 96 to 110 nl/min (39), peptides could be identified within an 8.5-min separation window (Fig. 2B), yielding 110 histone peptides (92 unmodified and 18 modified peptides; Fig. 5A). The effect of varying the CE separation voltage from −25 to −10 kV was further investigated. At −12.5 kV, which was found to be the optimum value regarding spray stability and increased separation time, the total number of histone peptides identified was further improved to 127 (98 unmodified and 29 modified peptides; Fig. 5A) within a separation window of about 17.4 min (Fig. 2C).
Fig. 2.

Base peak electropherograms of rat testis H1 histones digested with endoproteinase Arg-C using positively charged capillaries. A, PEI-coated capillary, separation voltage of −25 kV. B, M7C4I-coated capillary, separation voltage of −25 kV. C, M7C4I-coated capillary, separation voltage of −12.5 kV. BGE: 0.1% (v/v) formic acid. Sample amount: 6.15 ng (300 fmol). Capillary length: 100 cm with porous tip. Inner diameter 30 μm, outer diameter 150 μm.
Fig. 5.

Number of unmodified and modified histone H1 peptides identified via CESI-MS and LC-ESI-MS/MS analysis. A, number of identified histone H1 peptides (modified and non-modified) merged from triplicate analyses. B, the total number of modified peptides and the distribution of specific types of modifications within each column is shown. The numbers presented in the diagram are the sum of unique modified peptides found in triplicate runs. The overlap of peptides identified with CESI-MS ranged from 75.0% to 84.1%; overlap with LC-ESI-MS ranged from 65.8% to 71.4%.
LC-ESI-MS/MS Analysis of Arg-C Digested Histone H1 Peptides
For comparison with HPLC, nano-LC-ESI-MS was performed using a homemade fritless column packed 10 cm with 3 μm reverse-phase C18 resin. In Fig. 3A, the base peak chromatogram of the histone H1 digest for the same amount of sample as in the CESI-MS experiments is presented. After a database search, significantly fewer peptides were identified via LC-ESI-MS than via CESI-MS because of the lower signal intensity (73 peptides total, 62 unmodified and 11 modified; Fig. 5A). As the primary advantage of LC over CE is a much higher mass loading capability, 10 times more sample (3 pmol; Fig. 3B) was loaded, permitting the identification of 114 histone H1 peptides (87 unmodified and 27 modified; Fig. 5A), similar to the CE result obtained with the 300-fmol sample. In order to identify as many H1 peptides as possible, we injected 30 pmol of the Arg-C digest (Fig. 3C), a 100-fold increase relative to the CESI-MS analyses. This resulted in broad peaks and yielded a total number of 154 H1 peptides (111 unmodified and 43 modified; Fig. 5A). This outcome was significantly better than the result obtained from CESI-MS when the M7C4I-coated capillary with 0.1% formic acid as a BGE and a separation voltage of −12.5 kV was used, and it indicates the presence of a number of peptides that could not be identified through CESI-MS.
Fig. 3.

Base peak chromatograms of rat testis H1 histones digested with endoproteinase Arg-C using LC-ESI-MS. A, sample amount: 6.15 ng (300 fmol). B, sample amount: 61.5 ng (3 pmol). C, sample amount: 615 ng (30.0 pmol). LC-ESI-MS was performed using a homemade fritless column packed 10 cm with 3 μm reversed-phase C18 (Reprosil). The gradient (solvent A: 0.1% formic acid; solvent B: 0.1% formic acid in 85% acetonitrile) started at 4% B. The concentration of solvent B was increased linearly from 4% to 50% over 50 min and from 50% to 100% over 5 min. A flow rate of 250 nl/min was applied.
Improving CESI-MS/MS Analysis of Histone H1 Peptides
In addition to the effect of surface modification and separation voltage on peptide identification via CESI-MS (shown in Fig. 2), the influence of buffer concentration was examined. Therefore, the 300-fmol histone H1 digest was analyzed by increasing the BGE concentration from 0.1% formic acid (Fig. 2C) to 0.3% (Fig. 4A) and 0.6% (Fig. 4B). As can be seen, higher buffer concentrations produced an increase in separation time, which is related to a decrease in the EOF. When 0.3% formic acid was used instead of 0.1%, peptides could be identified within a 21.5-min separation window, and the number of identified peptides was raised further to 140 different H1 peptides (108 unmodified and 32 modified peptides; Fig. 5A). A further increase to 0.6% formic acid yielded a separation window of 25.7 min and 151 identified histone peptides (112 unmodified and 39 modified peptides; Fig. 5A). This result is comparable to the one obtained when 100 times more sample was analyzed via LC-ESI-MS, which clearly shows the importance of an appropriate length of the separation window in CESI-MS because of the limited scan rate of the MS instrument.
Fig. 4.

Base peak electropherograms of rat testis H1 histones digested with endoproteinase Arg-C using (A) an M7C4I-coated capillary, a separation voltage of −12.5 kV, and a BGE of 0.3% (v/v) formic acid; (B) an M7C4I-coated capillary, a separation voltage of −12.5 kV, and a BGE of 0.6% (v/v) formic acid; and (C) a neutrally coated capillary, a separation voltage of +30 kV, and a BGE of 10% (v/v) acetic acid. Sample amount: 6.15 ng (300 fmol). Capillary length: 100 cm with porous tip. Inner diameter: 30 μm; outer diameter: 150 μm.
A further reduction of the EOF can be successfully achieved by using a neutrally coated capillary. Busnel et al. recently demonstrated that neutral capillaries are well suited for the separation of peptide mixtures using CESI-MS (40). The analysis of the 300-fmol histone H1 digest was performed using 10% acetic acid as the BGE, a separation voltage of 30 kV, and a pressure of 0.5 psi applied at the capillary inlet, which is needed to provide a stable spray over the entire duration of the experiment. The resulting base peak electropherogram is shown in Fig. 4C. Using this method, we were able to identify 157 H1 peptides within a 38.5-min separation window (105 unmodified and 52 modified peptides; Fig. 5A). In order to increase the mass loading of the system, transient isotachophoresis was integrated as an in-capillary pre-concentration procedure (40). However, applying 10 times more sample (3 pmol) did not result in any further increase in the number of peptide identifications (data not shown).
Comparing the Results of CESI-MS and LC-ESI-MS Analyses of Modified H1 Histone Peptides
The various analyses of the rat testis histone H1 sample revealed the presence of different types of PTMs, including phosphorylation, acetylation, deamidation, and Nα-terminal acetylation, which is a co-translational process on the nascent polypeptide. Fig. 5B summarizes the results regarding modified peptide identification (including Nα-terminal acetylated peptides) from six different CE and three LC experiments.
The number of modified peptides identified and the type of modification can be seen for each method. With CESI-MS, the greatest number of different modified peptides was achieved when either a neutrally coated capillary with 10% acetic acid as the BGE and a separation voltage of 30 kV (52 modified peptides) or an M7C4I coated capillary with 0.6% formic acid and −12.5 kV was applied (39 modified peptides). With LC-ESI-MS, a comparable number of peptides (154, versus 157 in CESI-MS) could be obtained only when 100 times more sample was injected than in CESI-MS, and even in that case, the number of modified peptides was significantly lower (43, versus 52 in CESI-MS). All mapped sites of PTMs of rat testis H1 histones obtained via CESI-MS and LC-ESI-MS are given in Table I. Combining all three datasets, each one comprising triplicate runs, a total of 70 different modified H1 histone peptides were identified.
Table I. List of modified H1 histone peptides identified from rat testis. The peptide confidence level (percolator q value) and the probability of the respective sites' being truly phosphorylated (pRS probability) are given. Novel modification sites are highlighted in gray.
| Histone | Peptide | PTMs | CE |
CE |
LC |
CE |
LC |
|||||
|---|---|---|---|---|---|---|---|---|---|---|---|---|
| M7C4I; 12.5 kV; 0.6% AS; 300 fmol |
Neutral; 30 kV; 10% acetic acid; 300 fmol |
30 pmol |
IMAC; M7C4I; 25 kV; 0.1% formic acid |
IMAC |
||||||||
| Peptide confidence | Phospho site confidence | Peptide confidence | Phospho site confidence | Peptide confidence | Phospho site confidence | Peptide confidence | Phospho site confidence | Peptide confidence | Phospho site confidence | |||
| H1.0 | a-TEdNSTSTPAAKPK | dN-3 | 1.000 | - | 1.000 | - | 1.000 | - | ||||
| H1.0 | TEdNSTSTPAAKPK | dN-3 | 1.000 | - | 1.000 | - | 1.000 | - | ||||
| H1.0 | KSTDHPKYpSDMIVAAIQAEKNR | pS-28 | 1.000 | 0.892 | ||||||||
| H1.0 | VGENADpSQIK | pS-65 | 0.996 | 1.000 | ||||||||
| H1.0 | VGENADpSQIKLSIK | pS-65 | 1.000 | 1.000 | 1.000 | 1.000 | 1.000 | 1.000 | ||||
| H1a | (pS)E(pT)APVPQPA(pS)VAPEKPAATK | (pS-1) or (pT-3) or (pS-11) | 0.996 | (1.000) | ||||||||
| H1a | pSEpTAPVPQPASVAPEKPAATK | pS-1 and pT-3 | 0.949 | 0.806 | ||||||||
| H1a | a-(pS)E(pT)APVPQPASVAPEKPAATK | (pS-1) or (pT-3) | 1.000 | (1.000) | 1.000 | (1.000) | 1.000 | (1.000) | ||||
| H1a | a-SETAPVPQPASVAPEaKPAATK | aK-16 | 0.999 | - | ||||||||
| H1a | KKPAGPpSVSELIVQAVSSSK | pS-40 | 1.000 | 0.095 | 1.000 | 1.000 | 1.000 | 1.000 | ||||
| H1a | KKPAGPpSVSELIVQAVSSSKER | pS-40 | 1.000 | 0.949 | 1.000 | 0.895 | 1.000 | 0.962 | 1.000 | 0.756 | 1.000 | 0.777 |
| H1a | KKPAGPpSVpSELIVQAVSSSK | pS-40 and pS-42 | 1.000 | 1.000 | 1.000 | 1.000 | ||||||
| H1a | KKPAGPpSVpSELIVQAVSSSKER | pS-40 and pS-42 | 1.000 | 1.000 | 1.000 | 1.000 | ||||||
| H1a | KSLAAAGYDVEKNNpSR | pS-79 | 0.977 | 0.941 | 1.000 | 0.997 | ||||||
| H1a | KSLAAAGYDVEKNNpSRIK | pS-79 | 1.000 | 0.997 | 1.000 | 0.948 | 1.000 | 0.998 | 1.000 | 0.999 | ||
| H1a | KSLAAAGYDVEKNNpSRIKLGLK | pS-79 | 1.000 | 0.903 | 1.000 | 0.907 | 1.000 | 0.903 | ||||
| H1a | SLAAAGYDVEKNNpSR | pS-79 | 1.000 | 1.000 | ||||||||
| H1a | SLAAAGYDVEKNNpSRIK | pS-79 | 0.998 | 0.996 | ||||||||
| H1a | KAESKA(pS)(pT)K | (pS-117) or (pT-118) or (pT-119) | 1.000 | (0.972) | ||||||||
| H1a | KAESKA(pS)(pT)(pT)KVTVK | (pS-117) or (pT-118) or (pT-119) | 0.998 | (0.999) | 0.999 | (0.963) | 0.994 | (0.996) | ||||
| H1a | A(pS)(pT)(pT)KVTVK | (pS-117) or (pT-118) or (pT-119) | 0.998 | (1.000) | ||||||||
| H1a | KTSSKpSPKKPK | pS-165 | 0.849 | 0.763 | ||||||||
| H1a | KTSSKpSKPKVVK | pS-165 | 0.865 | 0.314 | 0.999 | 0.250 | ||||||
| H1a | TSSKpSPKKPKVVK | pS-165 | 1.000 | 0.984 | 0.999 | 0.989 | 0.999 | 0.996 | ||||
| H1a | TSSKpSPKKPK | pS-165 | 0.954 | 1.000 | ||||||||
| H1a | KVAKpSAK | pS-180 | 0.976 | 1.000 | 1.000 | 1.000 | 0.959 | 1.000 | ||||
| H1a | KVAKpSPAKAK | pS-180 | 1.000 | 1.000 | 0.996 | 1.000 | ||||||
| H1a | VAKpSPAK | pS-180 | 0.995 | 1.000 | 0.986 | 1.000 | ||||||
| H1a | VAKpSPAKAK | pS-180 | 1.000 | 1.000 | ||||||||
| H1b | a-SETAPAETTAPAPVEKpSPAK | pS-17 | 1.000 | 1.000 | 1.000 | 1.000 | 1.000 | 1.000 | ||||
| H1b | SETAPAETTAPAPVEKpSPAK | pS-17 | 1.000 | 1.000 | ||||||||
| H1c | a-SETAPAAPAAPAPVEKpTPVK | pT-17 | 1.000 | 1.000 | 1.000 | 1.000 | ||||||
| H1d | a-SETAPAAPAAPAPAEaKPIK | aK-16 | 1.000 | - | 1.000 | - | ||||||
| H1d | a-(pS)E(pT)APAAPAAPAPAEK | (pS-1) or (pT-3) | 1.000 | (1.000) | ||||||||
| H1d | a-SETAPAAPAAPAPAEKpTPIK | pT-17 | 1.000 | 1.000 | 1.000 | 1.000 | 1.000 | 1.000 | 1.000 | 1.000 | ||
| H1d | a-SETAPAAPAAPAPAEKpTPIKK | pT-17 | 0.999 | 1.000 | 1.000 | 0.866 | ||||||
| H1d | KATGTApTPK | pT-145 | 1.000 | 1.000 | 1.000 | 1.000 | ||||||
| H1d | KAKpSPK | pS-171 | 0.985 | 1.000 | 0.995 | 1.000 | 0.969 | 1.000 | ||||
| H1d | KAKpSPKK | pS-171 | 0.993 | 1.000 | ||||||||
| H1d | KAPKpSPAK | pS-186 | 1.000 | 1.000 | ||||||||
| H1d | KAPKpSPAKAR | pS-186 | 0.999 | 1.000 | ||||||||
| H1e | pSETAPAAPAAAPPAEK | pS-1 | 0.993 | 0.909 | ||||||||
| H1e | a-(pS)E(pT)APAAPAAAPPAEK | (pS-1) or (pT-3) | 1.000 | (1.000) | ||||||||
| H1e | a-(pS)E(pT)APAAPAAAPPAEKAPAK | (pS-1) or (pT-3) | 1.000 | (1.000) | 1.000 | (1.000) | ||||||
| H1e | a-(pS)E(pT)APAAPAAAPPAEKAPAKK | (pS-1) or (pT-3) | 1.000 | (1.000) | ||||||||
| H1e | KATGAApTPK | pT-145 | 1.000 | 1.000 | 1.000 | 1.000 | ||||||
| H1e | KVAKpSPK | pS-172 | 0.996 | 1.000 | 0.988 | 1.000 | 1.000 | 1.000 | ||||
| H1e | KVAKpSPKK | pS-172 | 0.999 | 1.000 | 1.000 | 1.000 | ||||||
| H1e | VAKpSPK | pS-172 | 0.974 | 1.000 | ||||||||
| H1t | a-SETAPAApSSTLVPAPVEKPATK | pS-8 | 1.000 | 0.890 | 0.999 | 0.976 | 0.997 | 0.947 | 1.000 | 0.194 | 0.996 | 0.873 |
| H1t | a-SETAPAApSSTLVPAPVEKPATKR | pS-8 | 1.000 | 0.600 | 1.000 | 0.611 | ||||||
| H1t | SETPAApSSTLVPAPVEKPATK | pS-8 | 0.999 | 0.533 | ||||||||
| H1t | GFpSVSK | pS-40 | 0.969 | 1.000 | 0.991 | 1.000 | ||||||
| H1t | GFpSVSKLIPEALSMSQER | pS-40 | 1.000 | 1.000 | ||||||||
| H1t | KALAAAGYDVEKNNpSRIKLALK | pS-79 | 1.000 | 0.832 | ||||||||
| H1t | ASRpSPK | pS-140 | 0.941 | 1.000 | 0.925 | 0.999 | 0.832 | 1.000 | ||||
| H1t | ASRpSPK(pS)(pS)K(pT)K | pS-140 and (pS-143) or (pS-144) or (pT-146) | 0.898 | (0.993) | 0.917 | (0.956) | 0.981 | (0.751) | ||||
| H1t | ASRpSPK(pS)(pS)K(pT)KVVK | pS-140 and (pS-143) or (pS-144) or (pT-146) | 0.899 | (0.999) | ||||||||
| H1t | SSKTKVVKKPKApTPTK | pT-155 | 1.000 | 0.854 | ||||||||
| H1t | TKVVKKPKApTPTK | pT-155 | 1.000 | 0.996 | 1.000 | 0.979 | 1.000 | 1.000 | ||||
| H1t | VVKKPKApTPTK | pT-155 | 0.983 | 0.913 | 0.890 | 0.873 | ||||||
| H1t | KPKApTPTK | pT-155 | 0.999 | 1.000 | 0.996 | 1.000 | 1.000 | 1.000 | ||||
| H1t | KPKApTPTKGSGSR | pT-155 | 0.946 | 0.882 | ||||||||
| H1t | GAaKGLQQR | aK-170 | 1.000 | - | 0.998 | - | ||||||
| H1t | GAKGLQQRKpSPAK | pS-177 | 0.723 | 1.000 | 0.921 | 1.000 | ||||||
| H1t | GAKGLQQRKpSPAKAR | pS-177 | 1.000 | 1.000 | ||||||||
| H1t | GLQQRKpSPAK | pS-177 | 0.925 | 1.000 | 0.998 | 1.000 | 0.986 | 1.000 | ||||
| H1t | GLQQRKpSPAKAR | pS-177 | 1.000 | 1.000 | 1.000 | 1.000 | 1.000 | 1.000 | 1.000 | 1.000 | ||
| H1t | KpSPAK | pS-177 | 0.874 | 1.000 | ||||||||
| H1t | ATNpSNSGKSK | pS-186 | 0.998 | 0.996 | 0.999 | 0.993 | ||||||
| H1c, -d, -e | KApSGPPVSELITK | pS-36a | 1.000 | 1.000 | ||||||||
| H1c, -d, -e | KApSGPPVSELITKAVAASKER | pS-36a | 1.000 | 0.999 | ||||||||
| H1c, -d, -e | KASGPPVSELITKAVAASKERpSGVSLAALK | pS-55a | 1.000 | 0.727 | ||||||||
| H1c, -d, -e | AVAASKERpSGVSLAALK | pS-55a | 0.994 | 0.991 | 1.000 | 0.990 | 1.000 | 0.996 | 1.000 | 0.945 | ||
| H1c, -d, -e, -t | KALAAAGYDVEKNNpSR | pS-78a | 0.999 | 0.999 | 1.000 | 1.000 | ||||||
| H1c, -d, -e, -t | KALAAGYDVEKNNpSRIK | pS-78a | 1.000 | 0.998 | 1.000 | 1.000 | 0.994 | 0.993 | 1.000 | 0.999 | 1.000 | 0.999 |
| H1c, -d, -e | KALAAAGYDVEKNNpSRIKLGLK | pS-78a | 0.804 | 0.908 | 1.000 | 0.976 | ||||||
| H1c, -d, -e, -t | ALAAAGYDVEKNNpSR | pS-78a | 1.000 | 1.000 | 1.000 | 1.000 | ||||||
| H1c, -d, -e, -t | ALAAAGYDVEKNNpSRIK | pS-78a | 0.999 | 0.996 | ||||||||
| H1b, -d | SLVpSKGTLVQTK | pS-87b | 0.998 | 0.999 | 0.981 | 0.999 | 1.000 | 1.000 | ||||
| Histone | Peptide | Co-translational mod. | ||||||||||
| H1.0 | a-TENSTSTPAAKPK | N-term-ac | 1.000 | 1.000 | 1.000 | |||||||
| H1a | a-SETAPVPQPASVAPEKPAATK | N-term-ac | 1.000 | 1.000 | 1.000 | 1.000 | ||||||
| H1b | a-SETAPAETTAPAPVEK | N-term-ac | 1.000 | 1.000 | 1.000 | |||||||
| H1b | a-SETAPAETTAPAPVEKSPAK | N-term-ac | 1.000 | 1.000 | 1.000 | |||||||
| H1c | a-SETAPAAPAAPAPVEK | N-term-ac | 0.999 | 1.000 | ||||||||
| H1c | a-SETAPAAPAAPAPVEKTPVK | N-term-ac | 1.000 | 1.000 | 1.000 | |||||||
| H1c | a-SETAPAAPAAPAPVEKTPVKK | N-term-ac | 1.000 | 1.000 | ||||||||
| H1d | a-SETAPAAPAAPAPAEKTPIK | N-term-ac | 1.000 | 1.000 | 1.000 | |||||||
| H1d | a-SETAPAAPAAPAPAEKTPIKK | N-term-ac | 1.000 | 1.000 | 1.000 | |||||||
| H1e | a-SETAPAAPAAAPPAEK | N-term-ac | 1.000 | 1.000 | 1.000 | |||||||
| H1e | a-SETAPAAPAAAPPAEKAPAK | N-term-ac | 1.000 | 1.000 | 1.000 | |||||||
| H1e | a-SETAPAAPAAAPPAEKAPAKK | N-term-ac | 1.000 | 1.000 | 1.000 | |||||||
| H1t | a-SETAPAASSTLVPAPVEK | N-term-ac | 1.000 | |||||||||
| H1t | a-SETAPAASSTLVPAPVEKPATK | N-term-ac | 1.000 | 1.000 | 1.000 | 1.000 | ||||||
| H1t | a-SETAPAASSTLVPAPVEKPATKR | N-term-ac | 1.000 | 1.000 | 1.000 | 1.000 | ||||||
Notes: a, acetylated; p, phosphorylated; d, deamidated.
a Corresponds to H1c.
b Corresponds to H1b.
All H1 subtypes were found to be acetylated as well as non-acetylated at their N-terminus (49, 51). The function of this type of modification is still unknown. The majority of the peptides identified (50 out of 70) were phosphorylated. Some of them were common to most of the H1 subtypes, whereas others were restricted to single variants. Furthermore, some peptides were found to be post-translationally acetylated or deamidated.
When we applied CESI-MS and LC-ESI-MS/MS, the rat testis histone subtypes H1a, H1d, H1e, and H1t were found to be modified at multiple sites, whereas only a few sites were identified on H1b, H1c, and H1.0. Most of the sites could be identified with both CE and LC, but some were found with one method only. We confirmed all five of the phosphorylation sites that we recently reported for rat H1t (14) and identified three additional, novel phosphorylation sites in this subtype. Two of these sites could be assigned unambiguously to Ser-40 and Ser-79. Two diphosphorylated peptides of different lengths (ASRSPKSSKTK and ASRSPKSSKTKVVK) were observed. One already known phosphorylation site was detected on Ser-140. The second site, however, could not be distinguished, but it was localized to one of three possible amino acids (Ser-143, Ser-144, and Thr-146). Furthermore, a novel acetylation site on Lys-170 of H1t was detected. The novel phosphorylation site on Ser-79 (H1t residue numbering) also was found for histones H1a, -c, -d, and -e. This site is outside of the consensus motif of CDK1 ((S/T)PXK), as most of the phosphorylation sites identified in these experiments were found outside CDK-consensus sequences. This further strengthens the notion that histone phosphorylation is mediated by additional kinases targeting still unknown motifs (16, 51). The same is true for a novel non-motif phosphorylation site found on Ser-28 on H1.0.
On the basis of the peptide identifications obtained (Table I), we investigated the overlap of the total peptides and of the modified peptides identified in different experiments. First, the overlap of peptides identified with CESI-MS was investigated. As can be seen in Fig. 6, the overlap was about 66% for total (Fig. 6A) and 54% for modified peptides (Fig. 6B) using either M7C4I/−12.5 kV/0.6% formic acid or neutral/30 kV/10% acetic acid. When the CESI-MS results were compared with the LC-ESI-MS analysis of the 30-pmol sample, the overlap was only 46% (M7C4I) and 47% (neutral), respectively, for total peptides (Fig. 6A) and 37% (M7C4I) and 51% (neutral), respectively, for modified peptides (Fig. 6B). Out of the 70 modified H1 histone peptides, 22 peptides could be identified either way; an additional 7 were identified with CESI-MS using the M7C4I coating, 10 with CESI-MS using the neutral capillary, and 11 with LC-ESI-MS. With this approach, we identified 33 modification sites, including 8 novel histone marks on rat testis H1 histones (Table I, highlighted in gray). Out of these 33 sites, 6 sites were identified only by CESI-MS using the neutral capillary, just 1 with the M7C4I coated capillary, and 5 solely by LC-ESI-MS (Fig. 6C). These results suggest that both techniques possess complementary properties and that no one of the investigated methods alone is sufficient for a comprehensive analysis of peptide modifications.
Fig. 6.
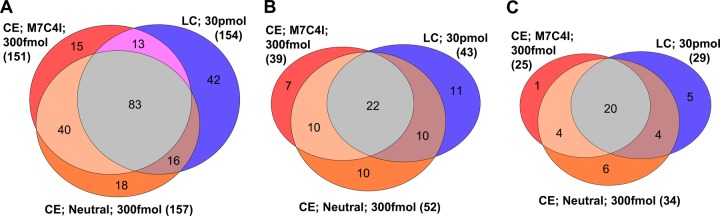
Venn diagram showing the overlap of (A) total histone H1 peptides, (B) modified H1 peptides, and (C) modification sites identified by means of CESI-MS and LC-ESI-MS from triplicate runs.
PTM Sites on Non-histone Proteins
The histone H1 sample contained other modified proteins that were co-extracted with linker histones, including Hmgn1, HMG-I/HMG-Y, nuclear ubiquitous casein and cyclin-dependent kinase substrate 1, Trip12 protein, PC4 and SFRS1-interacting protein, serine/arginine repetitive matrix protein 1, and 5′-nucleotidase cytosolic IB. A list of phosphorylated peptides found in the non-histone fraction is shown in supplemental Table S1. Despite the fact that 100 times more material was injected, the highest number of phosphopeptides was again achieved by CESI-MS using the neutral capillary (27 phosphopeptides), whereas the high-sample-load LC-ESI-MS analysis yielded just 9 phosphopeptides. As a result of this investigation, several phosphorylation sites that have been reported in other species but not in rat were identified. Moreover, two novel phosphorylation sites on 5′-nucleotidase cytosolic IB were detected (details shown in supplemental Table S1). In order to compare relative peptide signal intensities, eight phosphopeptides identified with both CE- and LC-MS were evaluated (supplemental Fig. S1). With one exception, the peptide intensities were lowest in the CESI-MS runs using the M7C4I-coated capillary and highest in LC-ESI-MS. A detailed comparison of complementary peptide identifications in CE and nano-LC is presented in the “Discussion” section.
Comparison of CESI-MS and LC-ESI-MS Analysis of IMAC Enriched Phosphopeptides
We have also studied the suitability of CESI-MS for the analysis of phosphopeptides isolated via IMAC. For this purpose, 5 μg Arg-C digested rat testis H1 histones were further purified with IMAC-Fe(III). Because of the low sample complexity, the fast CESI-MS method involving an M7C4I-coated capillary, 0.1% formic acid as the BGE, and a separation voltage of −25 kV was used (data not shown). With triplicate runs, 36 different phosphopeptides were identified (Table I). The results obtained via CE were compared with the LC-ESI-MS results (data not shown), applying the same method as shown in Fig. 3. Eleven times more sample was injected in LC than in CE, and as a result 33 phosphopeptides were obtained (Table I). Merging the results of CESI-MS and LC-ESI-MS, a total number of 55 phosphopeptides were identified—14 by both methods, 19 by LC only, and 22 solely by CE. Two additional phosphorylation sites of H1d were identified, which were found only with IMAC enrichment. One of which, Ser-186, was found on two low-mass peptides by CESI-MS only, and the other, Ser-1 or Thr-3, which could not be unambiguously identified, by LC-ESI-MS only.
Very recently, we were able to demonstrate that CESI-MS is especially effective in analyzing low-molecular-weight peptides. These interact poorly with the RP material and elute in the void volume, so they cannot be detected via LC-ESI-MS (39). This effect should be even more pronounced with small and hydrophilic phosphopeptides. In Fig. 7, the number of identified phosphopeptides obtained by means of CESI-MS and LC-ESI-MS with IMAC is plotted against their molecular mass. As can be seen clearly, more selective isolation of low molecular mass range peptides was observed with CESI-MS than with LC-MS; for example, in the mass range from 600 to 1400 Da, 21 peptides were detected with CESI-MS, versus 4 with LC-MS. LC-MS preferentially enriched larger phosphopeptides (e.g. in the mass range from 1400 to 2400 Da, 27 peptides versus 11).
Fig. 7.

Mass distribution of histone H1 phosphopeptides obtained with IMAC enrichment using CESI-MS and LC-ESI-MS. Data originate from Table I. Each analysis was performed three times.
When we compared the number of phosphopeptides identified, we found that the result was only slightly better than without IMAC enrichment, when 50 phosphopeptides were identified. However, a different set of phosphopeptides was apparently enriched. Out of the 75 phosphopeptides identified in rat testis H1 histone sample, 25 were detected only by IMAC (Table I). Taking all results together, 29 phosphopeptides were obtained by both LC and CE, 20 by LC only, and 26 by CE only. Out of the 23 small phosphopeptides in the low-mass range from 600 to 1200 Da, 19 could be identified by CESI-MS only. This result also clearly demonstrates that CESI-MS complements LC-ESI-MS in an ideal manner.
CESI-MS/MS Analysis of Arg-C Digested Core Histone Peptides
For the analysis of core histones, we chose a different strategy in which the first step was to pre-separate the sulfuric-acid-extracted core histones from rat testis using RP-HPLC (supplemental Fig. S2) (46). This procedure allows the separation of the complex core histone family into individual subtypes but permits no resolution of post-translationally modified histones, which elute together with the unmodified parent proteins (52). The collected fractions were subjected to Arg-C digestion, and the resulting peptides were analyzed by means of bottom-up mass spectrometry applying CESI-MS using an M7C4I-coated capillary, 0.1% formic acid as the BGE, and a separation voltage of −25 kV. For each sample, ∼10 ng were injected into the capillary and analyzed in a single run of about 20 min (data not shown). The identified histones were H3.1, H3.1t, H3.3, H4, and several H2A and H2B subtypes. CESI-MS analysis yielded individual sequence coverages between 61% (H3.1t) and 98.4% (H2A.Z). In total, 77 modified peptides were identified consisting of 54 peptides modified only by acetylation, 1 peptide modified by phosphorylation, 14 peptides modified by methylation only, and 8 peptides that were both acetylated and methylated (supplemental Table S2). In summary, we identified and located 42 different modification sites including acetylation (lysine and Nα-terminal) and mono-, di-, and trimethylation. The phosphorylation site was identified at Ser-139 of H2A.X.
CESI-MS Analysis of Intact Core Histones
It is an important challenge to detect the degree of modification using larger core histone peptides, or even intact proteins. It has been demonstrated by our group that CE offers excellent separation of, for example, multiply acetylated intact core histones (17, 18). We were interested, therefore, in developing a fast and reproducible analytical approach for identifying and measuring intact histone variants and the extent of their PTMs, which is crucial when comparing modification states under different biological conditions. In contrast to histones from organs like liver, kidney, testis, etc., which exhibit only a minor degree of acetylation, for this investigation core histones were used from a mouse tumor cell line treated with the deacetylase inhibitor sodium butyrate, which produces hyperacetylated species (47). The proteins were isolated using RP-HPLC as shown in supplemental Fig. S2 and further resolved via CESI-MS using the same conditions as described for the core histone peptide analysis.
Intact histone H4 was clearly resolved into five peaks within 18 min by CESI-MS (Fig. 8A). The average deconvoluted intact mass of each peak revealed that CE separated H4 solely by acetylation state into its non-, mono-, di-, tri-, and tetraacetylated forms (Fig. 8B). As acetylation diminishes the positive charge of the protein, the non-acetylated form has the highest electrophoretic mobility; however, because of the reversed polarity of the separation voltage applied and the countercurrent EOF, it shows the slowest migration time. The non-, mono-, di-, and trimethylated forms were observed to co-migrate with the different acetylated states, as increasing methyl addition does not significantly alter the net positive charge of the histone molecule. The selectivity of this separation not only leads to less complicated MS spectra but enables the assignment of isobaric trimethyl and acetyl modifications without the requirement of high-resolution MS, as they can be confidently distinguished because of their different migration times. The application of CESI-MS enables a fast evaluation and quantification of the methylation and acetylation status of H4. Peak 5 consists of non-acetylated H4 that is mainly dimethylated but also mono- and trimethylated to a minor extent. Peak 4, which consists of monoacetylated H4, closely resembles peak 5. With increasing acetylation, the methylation status changes significantly (Fig. 9). The higher acetylated peaks (peaks 1–3) consist of less trimethylated forms, but a substantial increase of non- and monomethylated forms is observed. These results are in accordance with previous studies by our group that demonstrated a decrease in the abundance of trimethylation (47) and an increase in monomethylation with hyperacetylated H4 (53). The RP-CESI-MS assay's reproducibility was tested through triplicate analysis of histone H4. We were able to quantify the differently acetylated proteoforms according to their MS1 precursor intensities with a standard deviation of less than 3.5% (supplemental Table S3A), corresponding to a relative standard deviation ranging from 4.7% to 16.0%. The differently methylated H4 forms present in a single peak were quantified with a standard deviation of less than 2% (supplemental Table S3B) based on their deconvolution result. The relative standard deviation ranged from 0.3% to 16.6%, depending on the signal height. As a result, the developed CESI-MS methodology has proved to be very reproducible and efficient for assessing the degree of modification of intact H4 (Fig. 9).
Fig. 8.

CESI-MS analysis of intact hyperacetylated core histones using an M7C4I-coated capillary (conditions as described in Fig. 2B). A, base peak electropherogram of intact H4. B, mass deconvoluted spectra of individual H4 peaks (1–5). Average mass of histone H4 calculated for ac0me2: 11,330.27 Da (UniProt accession P62806). C, base peak electropherogram of intact H2A.2. D, base peak electropherogram of intact H2A.1. E, base peak electropherogram of intact H2B. F, base peak electropherogram of intact H3.2 + H3.3. ac0, ac1, ac2, ac3, ac4: non-, mono-, di-, tri-, and tetraacetylated forms; me0, me1, me2, me3: non-, mono-, di-, and trimethylated forms.
Fig. 9.

Acetylation (A) and methylation (B) levels of hyperacetylated histone H4 in mouse erythroleukemia cells. Acetylation levels were determined by integrating the peak areas of MS1 precursors shown in Fig. 8A and were calculated as the percent area relative to the entire area of H4. The methylation status of each acetylated proteoform was determined individually by computing the monoisotopic mass intensities for the non-, mono-, di-, and trimethylated H4 present in each peak. Analyses are based on triplicate runs.
Using the same approach, the H2A.2 fraction was separated into four peaks (Fig. 8C). Determination of the molecular masses revealed the presence of the H2A.2 variants H2A.2A, H2A.2B, and H2A.2C. In detail, peak 4 contained non-acetylated H2A.2A; peak 3 contained monoacetylated H2A.2A, which was not well separated from non-acetylated H2A.2C; peak 2 contained diacetylated H2A.2A, monoacetylated H2A.2C, and non-acetylated H2A.2B; and peak 1 contained diacetylated H2A.2C and monoacetylated H2A.2B (supplemental Fig. S3). The CE procedure allowed the separation of the variants and their acetylated forms, as well as the determination of the relative proportions of the different forms.
A similar result was obtained when the H2A.1 fraction was subjected to CESI-MS (Fig. 8D). In addition to H2A.1, this fraction contained the variants H2A.1H and H2A.X, which elute as a single peak in RP-HPLC. In CE, the three variants were baseline separated from one another and from their different acetylated forms. H2A.1 was found to be mainly non- and monoacetylated; a diacetylated form was detected in very small amounts (supplemental Fig. S4). H2A.X was also non-, mono-, and diacetylated. H2A.1H, present in very small amounts, was still identifiable as non- and monoacetylated.
CESI-MS of intact H2B resulted in six well-separated peaks according to their acetylation status (Fig. 8E). The four major molecular masses observed in each peak were very close in mass (separated by 14 to 16 Da), suggesting the possibility that this fraction contained multiple variants of H2B or forms bearing multiple methylations. Top-down MS of human H2B isoforms performed by Siuti et al. (54) proved that the heterogeneity of H2B is due to amino acid sequence, and not to methylation. They detected five major molecular masses containing seven distinct H2B variants. The four molecular masses observed in our study can be assigned to the H2B forms H2B.1C, H2B.1F, H2B.1B, and H2B.2B, which differ by only one or two amino acids. Treatment with sodium butyrate resulted in increased acetylation of each of the four major peaks. The pattern of increased acetylation of the H2B isoforms was very similar regarding mono- to di-, tri-, and tetraacetylation (supplemental Fig. S5). The pentaacetylated pattern differed among the H2B isoforms but was present in minute amounts only.
Finally, the HPLC fraction containing H3.2 and H3.3 was subjected to CESI-MS. The base-peak electropherogram is shown in Fig. 8F. The CE analysis revealed six well-separated peaks corresponding to the non-, mono-, di-, tri-, tetra-, and pentaacetylated forms of the protein. However, when analyzing each peak spectrum with Xtract, we found that the extreme diversity of H3 modified forms precluded assignment of most of the molecular masses detected (supplemental Fig. S6). However, some lower methylated forms (e.g. dimethylated H3.2 ac0-ac5 and trimethylated H3.3 ac4-ac5) could be designated.
DISCUSSION
In this study, the suitability of CESI-MS for the identification of post-translational modifications of histones was evaluated for the first time. Moreover, to date no proteomic analysis of purified H1 and core histones from rat testis has been performed. A porous, sheathless CESI-MS interface in combination with a Thermo Scientific LTQ Orbitrap XL was used. For the analysis of H1 histones, the CESI-MS method developed was compared with nano-LC-ESI-MS. The results clearly demonstrate that more modified peptides and more modification sites were found by CESI-MS. However, the methods complement each other. Modified peptides from biological samples are often present in minute amounts only. Therefore, the sensitivity of the instrument configuration is an important issue for the analysis of these compounds. Generally, sensitivity increases with decreasing flow rates. For example, Busnel et al. obtained a 20-fold increase in sensitivity by decreasing the flow rate from 330 nl/min to 10 nl/min (40). Another advantage of minimal flow rates below 20 nl/min is the operation in the mass sensitive range of the ESI process, resulting in significantly reduced analyte suppression and improved sensitivity (55, 56). However, in LC, void volumes and instrument specifications usually limit the broad application possibilities of flow rates below 100 nl/min. In addition, co-elution with the unmodified form associated with ion suppression effects might also affect sensitive detection of the modified species in an adverse manner. The CE-MS configuration used for this investigation does not suffer from these limitations. There is no dead volume, and the flow rate generated by the EOF can be manipulated easily in a wide range from almost 0 to over 100 nl/min through appropriate capillary surface modification. As many covalent modifications such as phosphorylation and acetylation alter the charge of peptides and thus their mobility, co-migration with their unmodified form, and hence possible ion-suppression effects, usually does not occur.
Interestingly, linker histone methylation and ubiquitination were not observed. In a previous study on PTMs of H1 histones across different mouse tissues, a range of modifications including methylation, ubiquitination, and formylation was found (51, 57). These modifications were detected mainly in mouse spleen and other tissues such as brain or kidney, but none were detected in mouse testis. The testis is an organ composed of many different cell types performing a variety of distinct functions, including various types of somatic cells (e.g. Sertoli cells, Leydig cells, and peritubular cells) and germ cells, and this could be a reason for the lack or underrepresentation of certain modifications. Even with pre-fractionation of the linker histone subtypes via RP-HPLC before enzymatic digestion, very few modifications were identified in mouse testis by LC-MS. These few included three phosphorylation sites on H1.1 (Ser-1, Thr-3, and Ser-43), one on H1.3 (Thr-18), one on H1.4 (Thr-18), and one on H1.5 (Ser-18), and one acetylation site on H1.1 (Lys-87) (51).
In contrast to these results, we were able to identify 33 modification sites in rat testis via CESI-MS without pre-separation of individual H1 subtypes via RP-HPLC. In addition, for low-concentration phosphopeptide analysis of rat H1 histones, IMAC enrichment was applied, which increased the number of modification sites to as many as 35. Thus, this investigation showed that CESI-MS significantly increases the detection of phosphopeptides in the low-molecular-mass range. Even in the high sample load analysis, LC-ESI-MS was not able to detect this group of peptides. Some of the larger phosphopeptides, however, were preferentially detected in LC-MS. Our group recently described this effect for unmodified H1 peptides. We found that low-molecular-mass peptides (below 1400 Da) were preferentially identified by CESI-MS, because these peptides interact poorly with the RP material in the nano-LC system and therefore are washed out (39).
In order to further evaluate the different outcomes of both techniques, we compared relative peptide abundances across the best CE and LC analyses (shown in supplemental Fig. S7). A heat map of the relative peptide abundances was generated and illustrates that there is not only a substantial difference between CE and LC methods, but also a difference between the two CE methods, albeit a lesser one. The divergent peptide identifications among both CESI methods are mainly due to the different separation conditions of positive and neutral capillaries. In a positively coated capillary, the positively charged peptide ions migrate toward the cathode CE inlet. Because the magnitude of the EOF generated is much greater than the oppositely directed electrophoretic mobility of the peptides, they are carried by the EOF toward the inlet of the MS instrument. Under these conditions, peptides with low m/z values (implying high electrophoretic mobility and, therefore, long migration times) are well separated from each other and from other peptides, which improves their identification and quantification (supplemental Fig. S7, peptide groups 1 and 5). In contrast, a neutral capillary results in almost complete suppression of the EOF, and when working in normal CE mode (+30 kV), a low flow rate (10 nl/min) toward the MS can be obtained. In this case, peptides with low m/z values are the fastest migrating peptides and therefore are less well separated, which favors the identification and quantification of peptides with high m/z values (supplemental Fig. S7, peptide groups 2 and 6). This also includes phosphopeptides (peptide group 2) and Nα-terminal acetylated peptides (peptide group 6) because of their reduced charge states.
When comparing CESI-MS with LC-ESI-MS, we found a clear bias of CE toward low-molecular-mass peptides and phosphopeptides. Because of their poor interaction with the column support, many of these peptides were not even detected in LC-MS, even though 100 times more sample was injected. This can be seen clearly in supplemental Fig. S7, in which the relative peptide signal intensities are color-coded. The most significant difference in signal intensities between LC-MS and CESI-MS was found for peptide group 4, reflecting the 100-fold increase in sample amount injected in LC. This group comprises low abundant longer peptides and peptides that do not profit from the gain in sensitivity usually seen in CESI-MS.
Similar complementary peptide identification was found in recent CE and nano-LC studies by our group and other researchers (32, 39, 58). CE shows a clear bias toward basic, hydrophilic peptides of low molecular mass. Additionally, the Yates Lab attributed gains in sensitivity to lower noise levels with CE, illustrated by better signal-to-noise ratios of peptide precursor ions and associated higher XCorr values of identified peptides relative to LC (58). These trends may be also explained by the difference in electrospray conditions between the methods. The increasing organic composition of the solvent throughout the LC separation is known to affect the ESI response of different peptide hydrophobicities, whereas CE-MS conditions are essentially constant. However, the results also show that the complementary natures of the two techniques are of great value for comprehensive analysis of peptide modifications.
CESI analysis can be adjusted easily according to the sample complexity by using different types of coated capillaries. Wtih positively coated capillaries, very fast separations suitable for low-complexity samples can be achieved, as shown for phosphopeptides enriched by IMAC, for intact core histones and for mapping core histone modifications. Neutrally coated capillaries result in increased separation windows suitable for medium-complexity samples. In general, CESI-MS analyses are faster than LC-MS because no column equilibration time is necessary. Depending on the surface modification of the capillary, a total cycle time between 16 min (PEI) and 70 min (neutral) was found. In contrast, the nano-LC method used for the linker histone analysis required a total cycle time of 82 min, including 25 min for washing and re-equilibration. It is also important to note in this context that the carryover between analyses can be a major problem in LC-MS requiring additional time-consuming wash steps and analyses, which might increase the total analysis time substantially. In CESI-MS, after the application of a 1-min wash step with methanol and BGE, carryover is actually not observable.
The second part of the present study evaluated the potential of CESI-MS for the characterization of core histone subtypes and their modifications. Rat testis core histone fractions pre-separated via RP-HPLC were analyzed by means of bottom-up CESI-MS using a positively coated capillary, which enabled fast separations, allowing the annotation of acetylated, methylated, and phosphorylated histone peptides. A large number of modification sites known from human and mouse core histones were experimentally proved on rat core histones for the first time. Many of the recently reported most frequent PTMs found in mouse brain core histones were also found with this approach (59). Moreover, several sites on testis-specific subtypes like H2B1A and H3.1t were detected, as well as specific sites not found in mouse brain. CESI-MS resulted in the identification of 77 modified peptides corresponding to 42 sites, supporting the efficiency, sensitivity, and specificity of the CESI technique. In order to learn about the presence of multiple modifications that can co-occur on different histone residues, one must analyze larger peptides or intact proteins that encompass more modified sites. Only recently have new technological advances based on electron-transfer dissociation and electron-capture dissociation fragmentation begun to permit these studies. Top-down proteomics has been successfully applied for the characterization and quantitation of histone forms and PTMs by Kelleher and coworkers. Histone H2A, H2B, and H3 variants were identified via the use of high-mass-accuracy Fourier transform ion cyclotron resonance MS, as were their changes in relative expression and modifications during the cell cycle (54, 60, 61). To increase the throughput and sensitivity of comprehensive histone modification characterization, two-dimensional liquid chromatography is advantageous prior to mass spectrometric investigation. It turned out that a HILIC method developed by our group for the separation of histone variants and their modified forms (62, 63) was very well suited for combination with top-down MS (64–66). HILIC is a powerful tool for separating PTMs of proteins. Combining HILIC and RP-HPLC enabled us to isolate various H2A variants and their acetylated forms (63), as well as methylated and acetylated H4 forms with high purity, whose identities were determined by using offline MS detection (46, 47). The method was successfully applied for the characterization of combinatorial histone codes by the Kelleher and Garcia groups (64–66). They also showed that more detailed PTM occupancy information can be obtained from longer peptides derived via Asp-N or Glu-C digestion using middle-down MS (66). This strategy was found to be especially important for the analysis of highly modified histone H3, which has proven to be a significantly more difficult analytical problem than H2A, H2B, or H4. This problem also occurred with our CESI-MS analysis of intact H3, as shown in supplemental Fig. S6. The peaks obtained were found to differ in the number of acetyl groups, but the complex pattern of modified forms present within each peak did not allow the assignment of all individual H3 forms. Recently, Young et al. presented an MS-friendly version of this HILIC chromatography utilizing “saltless” pH gradient chromatography online-coupled with MS that resulted in improved analysis time, sample consumption, and dynamic range (67).
Our study on intact histone analysis presents an alternative method to HILIC. In contrast to HILIC, the CE method separates the histone proteins solely by acetylation state—the non-, mono-, di-, and trimethylated forms co-migrate with the different acetylated species. Nevertheless, CESI-MS also allows confident assignment between isobaric modifications such as acetylation and trimethylation without the requirement of high-resolution mass spectrometry, as they can be confidently distinguished because of their different migration times. The combined use of CE and MS has the potential to permit the characterization of complex mixtures such as hypermodified histones and should couple nicely with electron-transfer dissociation to make this method amenable to bench-top MS instruments. Although CESI-MS detection of histone modifications is limited by the mass loading capacity of the system, it has the advantage of providing a rapid overview of the modification status of intact proteins, allowing fast and reproducible comparisons between treated and untreated cells or different cell phases. Advances in several areas will be needed in order to further increase the range of potential CE applications in this field, including continued improvements in sensitivity, the resolution of high molecular masses, and the scan rates of MS instruments. It is noteworthy in this context that combining CE with MS reveals another advantage: CE shows a separation efficiency for high-molecular-mass compounds like larger peptides and proteins that is remarkably higher than that seen with any LC method.
Based on the results obtained, we envision the “CESI-method” being used in a broad range of applications, not only for epigenetic studies of histones, but also for modified peptide identification in general.
Supplementary Material
Acknowledgments
We thank Beckman Coulter, Inc., for providing the sheathless high sensitive porous sprayer interface. We kindly thank Astrid Devich for excellent technical assistance and Jim Thorn for his help with the manuscript.
Footnotes
 This article contains supplemental material.
1 The abbreviations used are::
- BGE
- background electrolyte
- CE
- capillary electrophoresis
- CESI-MS
- capillary electrophoresis electrospray ionization mass spectrometry
- CZE
- capillary zone electrophoresis
- EOF
- electroosmotic flow
- HILIC
- hydrophilic interaction liquid chromatography
- HPMC
- hydroxypropylmethyl cellulose
- IMAC
- immobilized metal-affinity chromatography
- LC-ESI-MS
- liquid chromatography electrospray ionization mass spectrometry
- PEI
- polyethyleneimine
- PTM
- post-translational modification
- RP
- reverse-phase.
REFERENCES
- 1. Izzo A., Kamieniarz K., Schneider R. (2008) The histone H1 family: specific members, specific functions? Biol. Chem. 389, 333–343 [DOI] [PubMed] [Google Scholar]
- 2. Happel N., Doenecke D. (2009) Histone H1 and its isoforms: contribution to chromatin structure and function. Gene 431, 1–12 [DOI] [PubMed] [Google Scholar]
- 3. Lindner H., Helliger W., Puschendorf B. (1990) Separation of rat tissue histone H1 subtypes by reverse-phase h.p.l.c. identification and assignment to a standard H1 nomenclature. Biochem. J. 269, 359–363 [DOI] [PMC free article] [PubMed] [Google Scholar]
- 4. Wood C., Snijders A., Williamson J., Reynolds C., Baldwin J., Dickman M. (2009) Post-translational modifications of the linker histone variants and their association with cell mechanisms. FEBS J. 276, 3685–3697 [DOI] [PubMed] [Google Scholar]
- 5. Turner B. M. (2000) Histone acetylation and an epigenetic code. Bioessays 22, 836–845 [DOI] [PubMed] [Google Scholar]
- 6. Jenuwein T., Allis C. D. (2001) Translating the histone code. Science 293, 1074–1080 [DOI] [PubMed] [Google Scholar]
- 7. Su X., Ren C., Freitas M. A. (2007) Mass spectrometry-based strategies for characterization of histones and their post-translational modifications. Exp. Rev. Proteomics 4, 211–225 [DOI] [PMC free article] [PubMed] [Google Scholar]
- 8. Bonenfant D., Coulot M., Towbin H., Schindler P., van Oostrum J. (2006) Characterization of histone H2A and H2B variants and their post-translational modifications by mass spectrometry. Mol. Cell. Proteomics 5, 541–552 [DOI] [PubMed] [Google Scholar]
- 9. Villar-Garea A., Imhof A. (2006) The analysis of histone modifications. Biochim. Biophys. Acta 1764, 1932–1939 [DOI] [PubMed] [Google Scholar]
- 10. Garcia B. A., Shabanowitz J., Hunt D. F. (2007) Characterization of histones and their post-translational modifications by mass spectrometry. Curr. Opin. Chem. Biol. 11, 66–73 [DOI] [PubMed] [Google Scholar]
- 11. Pesavento J. J., Garcia B. A., Streeky J. A., Kelleher N. L., Mizzen C. A. (2007) Mild performic acid oxidation enhances chromatographic and top down mass spectrometric analyses of histones. Mol. Cell. Proteomics 6, 1510–1526 [DOI] [PubMed] [Google Scholar]
- 12. Su X., Jacob N. K., Amunugama R., Lucas D. M., Knapp A. R., Ren C., Davis M. E., Marcucci G., Parthun M. R., Byrd J. C., Fishel R., Freitas M. A. (2007) Liquid chromatography mass spectrometry profiling of histones. J. Chromatogr. B Analyt. Technol. Biomed. Life Sci. 850, 440–454 [DOI] [PMC free article] [PubMed] [Google Scholar]
- 13. Sarg B., Helliger W., Talasz H., Forg B., Lindner H. H. (2006) Histone H1 phosphorylation occurs site-specifically during interphase and mitosis: identification of a novel phosphorylation site on histone H1. J. Biol. Chem. 281, 6573–6580 [DOI] [PubMed] [Google Scholar]
- 14. Sarg B., Chwatal S., Talasz H., Lindner H. H. (2009) Testis-specific linker histone H1t is multiply phosphorylated during spermatogenesis. Identification of phosphorylation sites. J. Biol. Chem. 284, 3610–3618 [DOI] [PubMed] [Google Scholar]
- 15. Garcia B. A., Mollah S., Ueberheide B. M., Busby S. A., Muratore T. L., Shabanowitz J., Hunt D. F. (2007) Chemical derivatization of histones for facilitated analysis by mass spectrometry. Nat. Protoc. 2, 933–938 [DOI] [PMC free article] [PubMed] [Google Scholar]
- 16. Garcia B. A., Joshi S., Thomas C. E., Chitta R. K., Diaz R. L., Busby S. A., Andrews P. C., Ogorzalek Loo R. R., Shabanowitz J., Kelleher N. L., Mizzen C. A., Allis C. D., Hunt D. F. (2006) Comprehensive phosphoprotein analysis of linker histone H1 from Tetrahymena thermophila. Mol. Cell. Proteomics 5, 1593–1609 [DOI] [PubMed] [Google Scholar]
- 17. Lindner H. H. (2008) Analysis of histones, histone variants, and their post-translationally modified forms. Electrophoresis 29, 2516–2532 [DOI] [PubMed] [Google Scholar]
- 18. Lindner H., Helliger W., Dirschlmayer A., Jaquemar M., Puschendorf B. (1992) High-performance capillary electrophoresis of core histones and their acetylated modified derivatives. Biochem. J. 283 (Pt 2), 467–471 [DOI] [PMC free article] [PubMed] [Google Scholar]
- 19. Lindner H., Helliger W., Dirschlmayer A., Talasz H., Wurm M., Sarg B., Jaquemar M., Puschendorf B. (1992) Separation of phosphorylated histone H1 variants by high-performance capillary electrophoresis. J. Chromatogr. 608, 211–216 [DOI] [PubMed] [Google Scholar]
- 20. Lindner H., Helliger W., Sarg B., Meraner C. (1995) Effect of buffer composition on the migration order and separation of histone H1 subtypes. Electrophoresis 16, 604–610 [DOI] [PubMed] [Google Scholar]
- 21. Lindner H., Wurm M., Dirschlmayer A., Sarg B., Helliger W. (1993) Application of high-performance capillary electrophoresis to the analysis of H1 histones. Electrophoresis 14, 480–485 [DOI] [PubMed] [Google Scholar]
- 22. Sarg B., Helliger W., Hoertnagl B., Puschendorf B., Lindner H. (1999) The N-terminally acetylated form of mammalian histone H1(o), but not that of avian histone H5, increases with age. Arch. Biochem. Biophys. 372, 333–339 [DOI] [PubMed] [Google Scholar]
- 23. Good D. M., Zurbig P., Argiles A., Bauer H. W., Behrens G., Coon J. J., Dakna M., Decramer S., Delles C., Dominiczak A. F., Ehrich J. H., Eitner F., Fliser D., Frommberger M., Ganser A., Girolami M. A., Golovko I., Gwinner W., Haubitz M., Herget-Rosenthal S., Jankowski J., Jahn H., Jerums G., Julian B. A., Kellmann M., Kliem V., Kolch W., Krolewski A. S., Luppi M., Massy Z., Melter M., Neususs C., Novak J., Peter K., Rossing K., Rupprecht H., Schanstra J. P., Schiffer E., Stolzenburg J. U., Tarnow L., Theodorescu D., Thongboonkerd V., Vanholder R., Weissinger E. M., Mischak H., Schmitt-Kopplin P. (2010) Naturally occurring human urinary peptides for use in diagnosis of chronic kidney disease. Mol. Cell. Proteomics 9, 2424–2437 [DOI] [PMC free article] [PubMed] [Google Scholar]
- 24. Zimmerli L. U., Schiffer E., Zurbig P., Good D. M., Kellmann M., Mouls L., Pitt A. R., Coon J. J., Schmieder R. E., Peter K. H., Mischak H., Kolch W., Delles C., Dominiczak A. F. (2008) Urinary proteomic biomarkers in coronary artery disease. Mol. Cell. Proteomics 7, 290–298 [DOI] [PubMed] [Google Scholar]
- 25. Hirayama A., Kami K., Sugimoto M., Sugawara M., Toki N., Onozuka H., Kinoshita T., Saito N., Ochiai A., Tomita M., Esumi H., Soga T. (2009) Quantitative metabolome profiling of colon and stomach cancer microenvironment by capillary electrophoresis time-of-flight mass spectrometry. Cancer Res. 69, 4918–4925 [DOI] [PubMed] [Google Scholar]
- 26. Sugimoto M., Wong D. T., Hirayama A., Soga T., Tomita M. (2010) Capillary electrophoresis mass spectrometry-based saliva metabolomics identified oral, breast and pancreatic cancer-specific profiles. Metabolomics 6, 78–95 [DOI] [PMC free article] [PubMed] [Google Scholar]
- 27. Maxwell E. J., Chen D. D. (2008) Twenty years of interface development for capillary electrophoresis-electrospray ionization-mass spectrometry. Anal. Chim. Acta 627, 25–33 [DOI] [PubMed] [Google Scholar]
- 28. Pantuckova P., Gebauer P., Bocek P., Krivankova L. (2011) Recent advances in CE-MS: synergy of wet chemistry and instrumentation innovations. Electrophoresis 32, 43–51 [DOI] [PubMed] [Google Scholar]
- 29. von Brocke A., Nicholson G., Bayer E. (2001) Recent advances in capillary electrophoresis/electrospray-mass spectrometry. Electrophoresis 22, 1251–1266 [DOI] [PubMed] [Google Scholar]
- 30. Maxwell E. J., Zhong X., Zhang H., van Zeijl N., Chen D. D. (2010) Decoupling CE and ESI for a more robust interface with MS. Electrophoresis 31, 25–33 [DOI] [PubMed] [Google Scholar]
- 31. Wojcik R., Dada O. O., Sadilek M., Dovichi N. J. (2010) Simplified capillary electrophoresis nanospray sheath-flow interface for high efficiency and sensitive peptide analysis. Rapid Commun. Mass Spectrom. 24, 2554–2560 [DOI] [PubMed] [Google Scholar]
- 32. Li Y., Champion M. M., Sun L., Champion P. A., Wojcik R., Dovichi N. J. (2012) Capillary zone electrophoresis-electrospray ionization-tandem mass spectrometry as an alternative proteomics platform to ultraperformance liquid chromatography-electrospray ionization-tandem mass spectrometry for samples of intermediate complexity. Anal. Chem. 84, 1617–1622 [DOI] [PMC free article] [PubMed] [Google Scholar]
- 33. Zamfir A. D. (2007) Recent advances in sheathless interfacing of capillary electrophoresis and electrospray ionization mass spectrometry. J. Chromatogr. 1159, 2–13 [DOI] [PubMed] [Google Scholar]
- 34. Issaq H. J., Janini G. M., Chan K. C., Veenstra T. D. (2004) Sheathless electrospray ionization interfaces for capillary electrophoresis-mass spectrometric detection advantages and limitations. J. Chromatogr. 1053, 37–42 [PubMed] [Google Scholar]
- 35. Zamfir A. D., Dinca N., Sisu E., Peter-Katalinic J. (2006) Copper-coated microsprayer interface for on-line sheathless capillary electrophoresis electrospray mass spectrometry of carbohydrates. J. Separation Sci. 29, 414–422 [DOI] [PubMed] [Google Scholar]
- 36. Kele Z., Ferenc G., Klement E., Toth G. K., Janaky T. (2005) Design and performance of a sheathless capillary electrophoresis/mass spectrometry interface by combining fused-silica capillaries with gold-coated nanoelectrospray tips. Rapid Commun. Mass Spectrom. 19, 881–885 [DOI] [PubMed] [Google Scholar]
- 37. Dahlin A. P., Wetterhall M., Liljegren G., Bergstrom S. K., Andren P., Nyholm L., Markides K. E., Bergquist J. (2005) Capillary electrophoresis coupled to mass spectrometry from a polymer modified poly(dimethylsiloxane) microchip with an integrated graphite electrospray tip. Analyst 130, 193–199 [DOI] [PubMed] [Google Scholar]
- 38. Moini M. (2007) Simplifying CE-MS operation. 2. Interfacing low-flow separation techniques to mass spectrometry using a porous tip. Anal. Chem. 79, 4241–4246 [DOI] [PubMed] [Google Scholar]
- 39. Faserl K., Sarg B., Kremser L., Lindner H. (2011) Optimization and evaluation of a sheathless capillary electrophoresis-electrospray ionization mass spectrometry platform for peptide analysis: comparison to liquid chromatography-electrospray ionization mass spectrometry. Anal. Chem. 83, 7297–7305 [DOI] [PubMed] [Google Scholar]
- 40. Busnel J. M., Schoenmaker B., Ramautar R., Carrasco-Pancorbo A., Ratnayake C., Feitelson J. S., Chapman J. D., Deelder A. M., Mayboroda O. A. (2010) High capacity capillary electrophoresis-electrospray ionization mass spectrometry: coupling a porous sheathless interface with transient-isotachophoresis. Anal. Chem. 82, 9476–9483 [DOI] [PubMed] [Google Scholar]
- 41. Ramautar R., Heemskerk A. A., Hensbergen P. J., Deelder A. M., Busnel J. M., Mayboroda O. A. (2012) CE-MS for proteomics: advances in interface development and application. J. Proteomics 75, 3814–3828 [DOI] [PubMed] [Google Scholar]
- 42. Haselberg R., Ratnayake C. K., de Jong G. J., Somsen G. W. (2010) Performance of a sheathless porous tip sprayer for capillary electrophoresis-electrospray ionization-mass spectrometry of intact proteins. J. Chromatogr. 1217, 7605–7611 [DOI] [PubMed] [Google Scholar]
- 43. Nguyen A., Moini M. (2008) Analysis of major protein-protein and protein-metal complexes of erythrocytes directly from cell lysate utilizing capillary electrophoresis mass spectrometry. Anal. Chem. 80, 7169–7173 [DOI] [PubMed] [Google Scholar]
- 44. Garza S., Moini M. (2006) Analysis of complex protein mixtures with improved sequence coverage using (CE-MS/MS)n. Anal. Chem. 78, 7309–7316 [DOI] [PubMed] [Google Scholar]
- 45. Sebastiano R., Gelfi C., Righetti P. G., Citterio A. (2001) Omega-iodoalkylammonium salts as permanent capillary silica wall modifiers. Comparative analysis of their structural parameters and substituent effects. J. Chromatogr. 924, 71–81 [DOI] [PubMed] [Google Scholar]
- 46. Sarg B., Koutzamani E., Helliger W., Rundquist I., Lindner H. H. (2002) Postsynthetic trimethylation of histone H4 at lysine 20 in mammalian tissues is associated with aging. J. Biol. Chem. 277, 39195–39201 [DOI] [PubMed] [Google Scholar]
- 47. Sarg B., Helliger W., Talasz H., Koutzamani E., Lindner H. H. (2004) Histone H4 hyperacetylation precludes histone H4 lysine 20 trimethylation. J. Biol. Chem. 279, 53458–53464 [DOI] [PubMed] [Google Scholar]
- 48. Elhamili A., Wetterhall M., Arvidsson B., Sebastiano R., Righetti P. G., Bergquist J. (2008) Rapid capillary electrophoresis time-of-flight mass spectrometry separations of peptides and proteins using a monoquaternarized piperazine compound (M7C4I) for capillary coatings. Electrophoresis 29, 1619–1625 [DOI] [PubMed] [Google Scholar]
- 49. Lindner H., Sarg B., Hoertnagl B., Helliger W. (1998) The microheterogeneity of the mammalian H1(0) histone. Evidence for an age-dependent deamidation. J. Biol. Chem. 273, 13324–13330 [DOI] [PubMed] [Google Scholar]
- 50. Lindner H., Sarg B., Grunicke H., Helliger W. (1999) Age-dependent deamidation of H1(0) histones in chromatin of mammalian tissues. J. Cancer Res. Clin. Oncol. 125, 182–186 [DOI] [PMC free article] [PubMed] [Google Scholar]
- 51. Wisniewski J. R., Zougman A., Kruger S., Mann M. (2007) Mass spectrometric mapping of linker histone H1 variants reveals multiple acetylations, methylations, and phosphorylation as well as differences between cell culture and tissue. Mol. Cell. Proteomics 6, 72–87 [DOI] [PubMed] [Google Scholar]
- 52. Lindner H., Wesierska-Gadek J., Helliger W., Puschendorf B., Sauermann G. (1989) Identification of ADP-ribosylated histones by the combined use of high-performance liquid chromatography and electrophoresis. J. Chromatogr. 472, 243–249 [DOI] [PubMed] [Google Scholar]
- 53. Talasz H., Lindner H. H., Sarg B., Helliger W. (2005) Histone H4-lysine 20 monomethylation is increased in promoter and coding regions of active genes and correlates with hyperacetylation. J. Biol. Chem. 280, 38814–38822 [DOI] [PubMed] [Google Scholar]
- 54. Siuti N., Roth M. J., Mizzen C. A., Kelleher N. L., Pesavento J. J. (2006) Gene-specific characterization of human histone H2B by electron capture dissociation. J. Proteome Res. 5, 233–239 [DOI] [PubMed] [Google Scholar]
- 55. Kelly R. T., Page J. S., Zhao R., Qian W. J., Mottaz H. M., Tang K., Smith R. D. (2008) Capillary-based multi nanoelectrospray emitters: improvements in ion transmission efficiency and implementation with capillary reversed-phase LC-ESI-MS. Anal. Chem. 80, 143–149 [DOI] [PMC free article] [PubMed] [Google Scholar]
- 56. Schmidt A., Karas M., Dulcks T. (2003) Effect of different solution flow rates on analyte ion signals in nano-ESI MS, or: when does ESI turn into nano-ESI? J. Am. Soc. Mass Spectrom. 14, 492–500 [DOI] [PubMed] [Google Scholar]
- 57. Tweedie-Cullen R. Y., Reck J. M., Mansuy I. M. (2009) Comprehensive mapping of post-translational modifications on synaptic, nuclear, and histone proteins in the adult mouse brain. J. Proteome Res. 8, 4966–4982 [DOI] [PubMed] [Google Scholar]
- 58. Wang Y., Fonslow B. R., Wong C. C., Nakorchevsky A., Yates J. R., 3rd (2012) Improving the comprehensiveness and sensitivity of sheathless capillary electrophoresis-tandem mass spectrometry for proteomic analysis. Anal. Chem. 84, 8505–8513 [DOI] [PMC free article] [PubMed] [Google Scholar]
- 59. Tweedie-Cullen R. Y., Brunner A. M., Grossmann J., Mohanna S., Sichau D., Nanni P., Panse C., Mansuy I. M. (2012) Identification of combinatorial patterns of post-translational modifications on individual histones in the mouse brain. PloS One 7, e36980. [DOI] [PMC free article] [PubMed] [Google Scholar]
- 60. Thomas C. E., Kelleher N. L., Mizzen C. A. (2006) Mass spectrometric characterization of human histone H3: a bird's eye view. J. Proteome Res. 5, 240–247 [DOI] [PubMed] [Google Scholar]
- 61. Boyne M. T., 2nd, Pesavento J. J., Mizzen C. A., Kelleher N. L. (2006) Precise characterization of human histones in the H2A gene family by top down mass spectrometry. J. Proteome Res. 5, 248–253 [DOI] [PubMed] [Google Scholar]
- 62. Lindner H., Sarg B., Helliger W. (1997) Application of hydrophilic-interaction liquid chromatography to the separation of phosphorylated H1 histones. J. Chromatogr. 782, 55–62 [DOI] [PubMed] [Google Scholar]
- 63. Lindner H., Sarg B., Meraner C., Helliger W. (1996) Separation of acetylated core histones by hydrophilic-interaction liquid chromatography. J. Chromatogr. 743, 137–144 [DOI] [PubMed] [Google Scholar]
- 64. Pesavento J. J., Mizzen C. A., Kelleher N. L. (2006) Quantitative analysis of modified proteins and their positional isomers by tandem mass spectrometry: human histone H4. Anal. Chem. 78, 4271–4280 [DOI] [PubMed] [Google Scholar]
- 65. Pesavento J. J., Bullock C. R., LeDuc R. D., Mizzen C. A., Kelleher N. L. (2008) Combinatorial modification of human histone H4 quantitated by two-dimensional liquid chromatography coupled with top down mass spectrometry. J. Biol. Chem. 283, 14927–14937 [DOI] [PMC free article] [PubMed] [Google Scholar]
- 66. Garcia B. A., Pesavento J. J., Mizzen C. A., Kelleher N. L. (2007) Pervasive combinatorial modification of histone H3 in human cells. Nat. Methods 4, 487–489 [DOI] [PubMed] [Google Scholar]
- 67. Young N. L., DiMaggio P. A., Plazas-Mayorca M. D., Baliban R. C., Floudas C. A., Garcia B. A. (2009) High throughput characterization of combinatorial histone codes. Mol. Cell. Proteomics 8, 2266–2284 [DOI] [PMC free article] [PubMed] [Google Scholar]
Associated Data
This section collects any data citations, data availability statements, or supplementary materials included in this article.