Abstract
Over the last 20 years, cochlear implants (CIs) have become what is arguably the most successful neural prosthesis to date. Despite this success, a significant number of CI recipients experience marginal hearing restoration, and, even among the best performers, restoration to normal fidelity is rare. In this article, we present image processing techniques that can be used to detect, for the first time, the positions of implanted CI electrodes and the nerves they stimulate for individual CI users. These techniques permit development of new, customized CI stimulation strategies. We present one such strategy and show that it leads to significant hearing improvement in an experiment conducted with 11 CI recipients. These results indicate that image-guidance can be used to improve hearing outcomes for many existing CI recipients without requiring additional surgical procedures.
Index Terms: auditory nerve, cochlear implant, image-guidance, spiral ganglion, stimulation strategy
I. Introduction
Cochlear implants (CIs) are surgically implanted neural prosthetic devices used to treat severe-to-profound hearing loss [1]. Over the last few decades, the design of CIs has evolved to produce what is arguably the most successful neural prosthesis to date. CIs induce hearing sensation by stimulating auditory nerve pathways within the cochlea using an implanted electrode array. The CI processor, typically worn behind the ear, is programmed to process sound received through a microphone and to send instructions to each electrode. CI programming begins with selection of a general signal processing strategy, e.g., continuous interleaved sampling [9]. Then, the audiologist defines what is referred to as the “MAP,” which is the set of CI processor instructions. The MAP is tuned by specifying stimulation levels for each electrode based on measures of the user’s perceived loudness and by selecting a frequency allocation table, which defines which electrodes should be activated when specific frequencies are in the detected sound. The number of electrodes in the intracochlear array ranges from 12 to 22, depending on the manufacturer. Electrode activation stimulates spiral ganglion (SG) nerves, the nerve pathways that branch to the cochlea from the auditory nerve (see Figure 1).
Fig. 1.
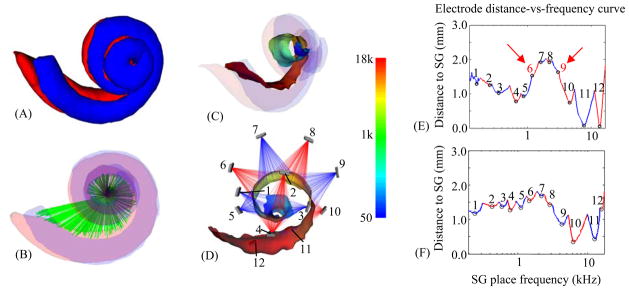
Spatial analysis of an implanted subject. The scala tympani (red) and scala vestibuli (blue), the two principal cavities of the cochlea, are shown in (A–C). In (B), also shown is a rendering of the auditory nerve bundles of the SG in green. In (C–D), the AR (the surface representing the interface between the nerves of the SG and the intra-cochlear cavities) is colorcoded with the tonotopic place frequencies of the SG in Hz. Also shown in (D) are the implanted electrodes of the CI, numbered 1–12. An illustration of current spread from each electrode is rendered transparently in red and blue, with the color alternating between neighboring electrodes. Electrode distance-vs.-frequency curves, shown as a sequence of blue and red segments, are plotted in (E), which corresponds to the ear shown in (D), and (F), which is the curve for the better performing contra-lateral ear of the same subject.
CI devices available today lead to remarkable results in the vast majority of users with average postoperative sentence recognition reaching over 70% correct for unilaterally implanted recipients and over 80% correct for bilateral implant recipients [31]. Despite this success, a significant number of users receive marginal benefit, and restoration to normal fidelity is rare even among the best performers. This is due, in part, to several well-known issues with electrical stimulation that prevent CIs from accurately simulating natural acoustic hearing. Electrode interaction is an example of one such issue that, despite significant improvements made by advances in hardware and signal processing, remains challenging [4, 5]. In natural hearing, a nerve pathway is activated when the characteristic frequency associated with that pathway is present in the incoming sound. Neural pathways are tonotopically ordered by decreasing characteristic frequency along the length of the cochlea, and this precisely tuned spatial organization is well known (see Figure 1c) [10]. CI electrode arrays are designed such that when placement is optimal, each electrode stimulates nerve pathways corresponding to a pre-defined frequency bandwidth [3]. However, in surgery the array is blindly threaded into the cochlea with its insertion path guided only by the walls of the spiral-shaped intra-cochlear cavities. Since the final positions of the electrodes are generally unknown, the only option when designing the MAP has been to assume the electrodes are optimally situated in the cochlea and use a default frequency allocation table. Because MAP efficacy is sensitive to sub-optimal electrode positioning [2, 3], which can lead to, e.g., electrode channel interactions [4, 5], more effective MAPs could be selected if the positions of the electrodes were known. In this article, we show how new image processing techniques we have developed can be used to visualize, for the first time, the positions of the SG nerves and the electrodes for individual users. This enables the design of processor programming strategies that more closely mimic natural hearing by leveraging this user-specific spatial information. We implement and test one such strategy that aims to reduce interaction of electrode stimulation patterns.
In the following sections, we first present the image processing techniques we use to identify the positions of the electrodes and the SG nerves they stimulate for individual CI recipients. Then in Section III, we present our approach for visualizing and analyzing the spatial relationship between the electrodes and the SG to facilitate the design of image-guided processor programming strategies, and we introduce one programming strategy that uses this user-specific spatial information to reduce interaction of electrode stimulation patterns. In Section IV, we present results that demonstrate the accuracy of our image-processing techniques and that show how our methods lead to significant hearing improvement in an experiment conducted with 11 CI users. Finally, these results are discussed in Section V.
II. Identifying the position of cochlear implant electrodes and the spiral ganglion
A. Overview
The major obstacle for determining the spatial relationship between the electrodes and the SG lies in identifying the SG nerve cells. Identifying the SG in vivo is difficult because nerve fibers have diameter on the order of microns and are too small to be visible in CT, which is the preferred modality for cochlear imaging due to its otherwise superior resolution. Since the SG lacks any contrast in CT, we cannot segment it directly. However, the external walls of the cochlea are well contrasted in CT, and, as shown in [6], external cochlear anatomy can be used to estimate the location of intra-cochlear anatomy using a statistical shape model (SSM). Extending that method, the goal with the approach we present in this paper is to use the location of external cochlear features as landmarks to estimate the position of the SG. To do this, we have constructed a SSM of cochlear anatomy that includes the SG.
The data set we have used to construct the SSM consists of images of six cadaveric cochlea specimens. For each specimen, we acquired a μCT image volume with a SCANCO μCT. The voxel dimensions in these images are 36 μm isotropic. We also acquired CTs of the specimens with a Xoran xCAT® fpVCT (flat panel volumetric computed tomography) scanner. In these volumes, voxels are 0.3 mm isotropic. In each of the μCT volumes, the scala vestibuli, scala tympani, and SG were manually segmented. Figure 2 shows an example of a conventional fpVCT image and its corresponding μCT image.
Fig. 2.
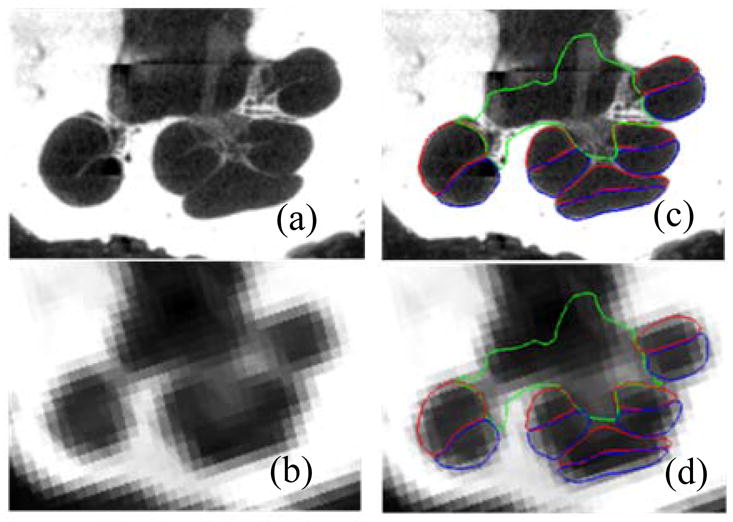
Shown in (a) and (b) are a slice of a μCT and a CT of a human cochlea. In (c) and (d), the scala tympani (red), scala vestibuli (blue), and bundle of nerve cells of the SG (green) are delineated in the same slice.
Prior to constructing the SSM, we identify which points in the manual segmentations correspond to strong cochlear edges in CT. To those points we arbitrarily assign an importance weighting of 1. To all others we assign a lesser weighting of 0.01. These weights are used to construct a point distribution model (PDM) on the registered manual segmentation surfaces for weighted active shape model (wASM) segmentation [24]. To segment a new image, the SSM is iteratively fitted in a weighted-least-squares sense to features in the target image. The edge points with their weight of 1 are fitted to strong edges in the CT. The non-edge points with low weight are fitted to the positions determined by non-rigid registration with an atlas image. With the weights that we have chosen, the non-edge points provide enough weak influence on the optimization to ensure that the wASM stays near the atlas-based initialization position, while the edge points strongly influence the whole wASM towards a local image gradient-based optimum for a highly accurate result.
During model construction, the set of SG points in the model that interface with intra-cochlear anatomy were also identified. These points are referred to as the active region (AR) since they correspond to the region most likely to be stimulated by an implanted electrode (see Figure 1). The tonotopic mapping of each point in the AR in the reference volume is computed using known equations that relate cochlear place frequency and angular depth [10]. Once segmentation is completed, the tonotopic frequency labels from the model are transferred to the target image. While the position of each of the electrodes is identified in post-operative CT, the SG is segmented in the pre-operative CT where there are no CI-related metallic artifacts in the image. The transformation that registers the pre- and post-operative CTs is used to project the positions of the electrodes and the SG into the same space [8]. These methods are detailed in the following sub-sections.
B. Model Creation
To model cochlear structures, we: (1) establish a point correspondence between the structure surfaces that were manually segmented in μCT, (2) use these points to register the surfaces to each other with a 7 degrees of freedom similarity transformation (rigid plus isotropic scaling), and (3) compute the eigenvectors of the registered points’ covariance matrix. Point correspondence is determined using the approach described in [6]. Briefly, non-rigid registration is used to map the set of training volumes to one of the training volumes chosen as a reference, and any errors seen in the results are manually corrected. Then, a correspondence is established between each point on the reference surface with the closest point in each of the registered training surfaces. Once correspondence is established, each of the training surfaces is point registered to the reference surface. Since the cochlear edge points will be the highest weighted points for the wASM segmentation, identical weights are used to register the training shapes in a weighted-least-squares sense using standard point registration techniques [26] prior to computation of the eigenspace so that the model will best capture the shape variations at these points.
To build the model, the principal modes of shape variation are extracted from the registered training shapes. This is computed according to the procedure described by Cootes et. al. [25]: First, the covariance matrix of the registered training shapes is computed as
| (1) |
where the v⃗j’s are the individual shape vectors and v̄ is the mean shape. The shape vectors are constructed by stacking the 3D coordinates of all the points composing each structure into a vector. The modes of variation in the training set are then computed as the eigenvectors {u⃗j} of the covariance matrix,
| (2) |
These modes of variation are extracted for the combined shape of the scala tympani, scala vestibuli, and SG for all the samples in the training set.
C. Weighted Active Shape Model Segmentation
The procedure we use for segmentation with a wASM follows the traditional approach, i.e., (1) the model is placed in the image to initialize the segmentation; (2) better solutions are found while deforming the shape using weighted-least-squares fitting; and (3) eventually, after iterative shape adjustments, the shape converges, and the segmentation is complete. Initialization is performed using the atlas-based methods proposed in [6].
Once initialized, the optimal solution is found using an iterative searching procedure. At each search iteration, an adjustment is found for each model point, and the model is fitted in a weighted-least-squares sense, as described below, to this set of candidate adjustment points. To find the candidate points, two approaches are used. For cochlear edge points, candidates are found using line searches to locate strong edges. At each external point y⃗i, a search is performed along the vector normal to the surface at that point. The new candidate point is chosen to be the point with the largest intensity gradient over the range of −1 to 1 mm from y⃗j along this vector. For all other points, it is impossible to determine the best adjustment using local image features alone because there are no contrasting features at these points in CT. Therefore, the original initialization positions for these points, which were provided by atlas-based methods, are used as the candidate positions. With the weights that we have chosen, information from the atlas weakly influences the wASM to stay near the initialization position, while the edge points strongly influence the whole wASM towards a local image gradient-based optimum.
The next step is to fit the shape model to the candidate points. We do this in the conventional wASM manner. A standard 7 degree of freedom weighted point registration is performed, creating similarity transformation T, between the set of candidate points {y⃗i′} and the mean shape {v̄i}, where v̄j are the 3D coordinates of the ith point in the mean shape. Then, the residuals
| (3) |
are computed. To obtain the weighted-least-squares fit coordinates in the SSM’s eigenspace, we compute,
| (4) |
where d⃗ is composed of {d⃗i }stacked into a single vector, is the matrix of eigenvectors that correspond to non-trivial eigenvalues, and W is a diagonal matrix with the importance point weightings in the appropriate entries along the diagonal. This equation results in a vector b⃗ that represents the coordinates in the SSM space corresponding to a weighted-least-squares fit of the model to the candidate points. The final approximation to the shape is computed by passing the sum of the scaled eigenvectors plus the mean shape through the inverse transformation, equivalently,
| (5) |
where u⃗j,i is the ith 3D coordinate of the jth eigenvector. As suggested by Cootes, the magnitude of the bj’s are constrained such that
| (6) |
which enforces the Mahalanobis distance between the fitted shape and the mean shape to be no greater than 3.
At each iteration, new candidate positions are found and the model is re-fitted to those candidates. The wASM converges when re-fitting the model results in no change to the surface. The tonotopic mapping of the SG points in the model, computed when the model was built, are directly transferred to the target image via the corresponding points in the converged solution. An example result of this mapping process is shown in Figure 1C–D.
D. Electrode Identification
Identifying the position of electrodes in arrays manufactured by Med El and Advanced Bionics is straightforward since the individual contacts, which are spaced further than 1 mm apart, are well contrasted in post-operative CT. However, the contacts in arrays manufactured by Cochlear are not well contrasted from each other because the space between contacts, which ranges from 0.4 to 0.8 mm, is relatively small. To identify these electrodes, we use techniques we have previously presented [8]. First, the centerline of the image artifact created by the array is identified. This is straightforward since the array is very bright in the image. Then, using a model of the array that describes the spacing between contacts, points representing the centers of each contact are sampled along the extracted centerline.
To permit analysis of the spatial relationship between the electrodes and the SG, the last step of the electrode identification procedure is to use the transformation that registers the subject’s pre- and post-operative CTs to bring the extracted electrode positions and the segmented SG surface into the same space.
III. Image-guided cochlear implant programming
A. Spatial visualization and analysis
Once the positions of the electrodes and the SG are identified, analysis of their spatial relationship is necessary to extract programming-relevant information. Thus, to support the design of new image-guided MAPping methods, we have also developed a new technique for visualizing programming-relevant spatial information that we call the electrode distance-vs.-frequency curve, an example of which is shown in Figure 1E. This plot summarizes the important information our new image processing techniques provide. The height of the curve on the vertical axis shows the distance from SG nerve pathways, organized by characteristic frequency along the horizontal axis, to the closest electrode. The label above each of the curve segments, which alternate color between red and blue, indicates which electrode is the closest in the frequency region spanned by that segment. Using this new visualization method, not only is it easy to infer the region of the SG that a specific electrode will best stimulate, e.g., the nerve pathways with characteristic frequencies around 1 kHz are closest to electrode 5; but also it is easy to detect when two electrodes stimulate the same region. For instance, the absence of local minima in curve segments associated with electrodes 6 and 9 indicates that the neural pathways stimulated by these two electrodes are receiving overlapping stimulation from neighboring electrodes, and hence are affected by channel interaction. The electrode distance-vs.-frequency curve for this subject’s contra-lateral ear is shown in Figure 1F. While electrode interactions are only one of many factors that could affect CI performance, it is interesting to note that for this particular subject, the curves indicate that channel interactions are less likely to be occurring in the better performing ear in (F) than in the poorer performing ear (E).
B. Image-guided MAPping strategy
To demonstrate the utility of the new information we provide, we have tested one example image-guided MAPping strategy. Our approach incorporates the continuous interleaved sampling (CIS) signal processing strategy introduced by Wilson et al. [9]. Since its introduction, CIS has been widely adopted, and all CI manufacturers today use CIS-based strategies [2]. By using non-simultaneous, interleaved pulses, CIS decreases cross-electrode electric field channel interactions without precise knowledge of the relative location of the neural pathways and the electrodes. But, by integrating spatial information provided by our image-processing techniques, we can extend this concept to decrease electrode interactions at the neural level, i.e., reduce the cross-electrode neural stimulation overlap. In our experiments, the MAP adjustment strategy is simple. We deactivate electrodes that are likely to cause stimulation overlap, which, as discussed above, can be inferred from our distance-vs.-frequency curve. Conveniently, this approach does not conflict with existing signal processing strategies, and thus the MAP adjustments do not require major processing changes. Electrode deactivation schemes are not new, e.g., some groups have experimented with randomly deactivating a number of electrodes and found little effect on speech recognition as long as more than 4–8 electrodes are active [11, 12]. Other groups deactivated electrodes based on psychoacoustics measures, resulting in detectable increases in a sub-set of the measures of speech recognition reported by the authors [13, 14]. However, the deactivation scheme we present is the first that uses image-guidance. In our experiments, after identified electrodes are deactivated, the sound spectrum is simply remapped to the remaining active electrodes using the CI manufacturer’s clinical software. No other programming variables are adjusted.
IV. Results
A. Spiral ganglion segmentation results
The SG segmentation approach was tested on CTs of the set of cochlea specimens. The experiments were conducted using a leave-one-out approach, i.e., the specimen being segmented is left out of the model. A CT was not available for one of the six specimens, and its μCT was used as the model reference volume to simplify the leave-one-out validation study. Thus, in the validation study, we measured segmentation error on the remaining five specimens when using PDMs with four modes of variation. Because these samples were excised specimens, rather than whole heads, the atlas-based initialization process required manual intervention; however, when applied to whole head CTs, the approach is fully automatic.
To validate the results, we again rely on information provided by the set of corresponding μCT volumes. Each CT was rigidly registered to the corresponding μCT of the same specimen. The automatic segmentations were then projected from CT to μCT space. Finally, Dice index of volume overlap [27] and surface errors were computed between the registered automatic segmentations and the manual segmentations to validate the accuracy of our results. Figure 3 shows the overall distributions of these recorded values. Surface errors were recorded between the whole SGs (WSG) and also between the active regions (AR). Dice indices were not computed for the AR because it is not a closed surface and does not represent a volumetric region. The green bars, red bars, blue rectangles, and black I-bars denote the median, mean, one standard deviation from the mean, and the overall range of the data set, respectively. As can be seen in the figure, the wASM achieves mean dice indices of approximately 0.77. For typical structures, a Dice index of 0.8 or greater is considered good [28]. Here, we consistently achieve Dice indices close to 0.8 for segmentation of a structure that is atypically small and lacks any contrast in the image. Mean surface errors are approximately 0.15 mm for both the WSG and the AR, which is about a half a voxel’s distance in the segmented CT. Maximum surface errors are above 1 mm for the WSG but are all sub-millimetric for the AR.
Fig. 3.
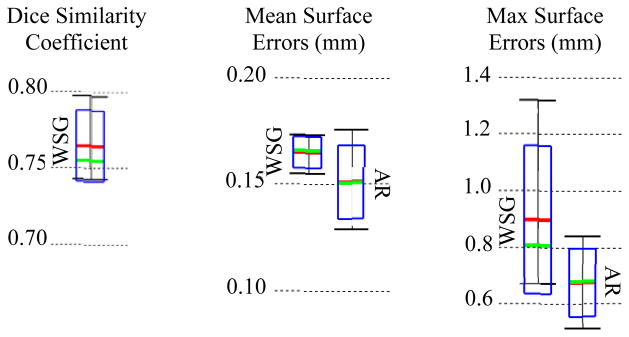
Segmentation error distributions of Dice similarity scores for the whole SG (WSG) and mean and max symmetric surface error distributions for the WSG and in the active region (AR).
Segmentations for all 5 specimens are shown color encoded with surface error in Figure 4. It can be seen that the wASM results in mean surface errors under 0.15 mm for the majority of the SG with average maximum errors of about 0.7 mm (<3 voxels). As can be seen in the figure, errors in the AR above 0.5 mm are rare and highly localized. Shown in Figure 5 are contours of a representative automatic segmentation overlaid with the CT (the volume on which segmentation was performed) and the corresponding registered μCT. It can be seen from the figure that the contours achieved by automatic segmentation of the CT are in excellent agreement with contours manually delineated in the high resolution μCT, especially in the AR. Localization errors that are apparent in the μCT are less than 2 voxels width in the CT.
Fig. 4.
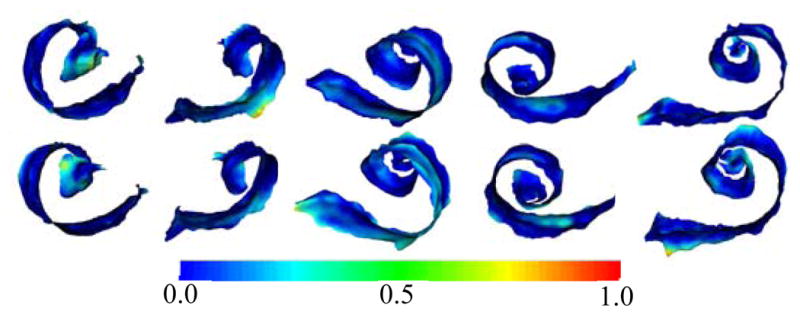
Automatic (top row) and manual (bottom row) segmentations of the active region of the SG in the 5 test volumes (left-to-right) color encoded with error distance (mm).
Fig. 5.
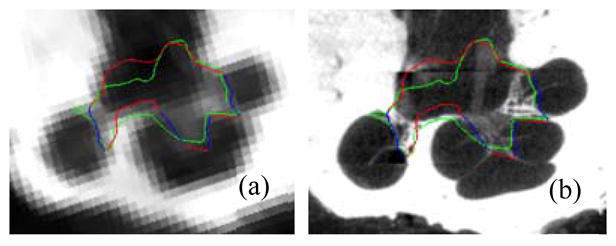
Delineations of the automatic (red/blue) and manual (green) segmentation of the SG in the CT (a) and μCT (b) slice from Figure 2. The active region is shown in blue.
B. Spiral ganglion segmentation results
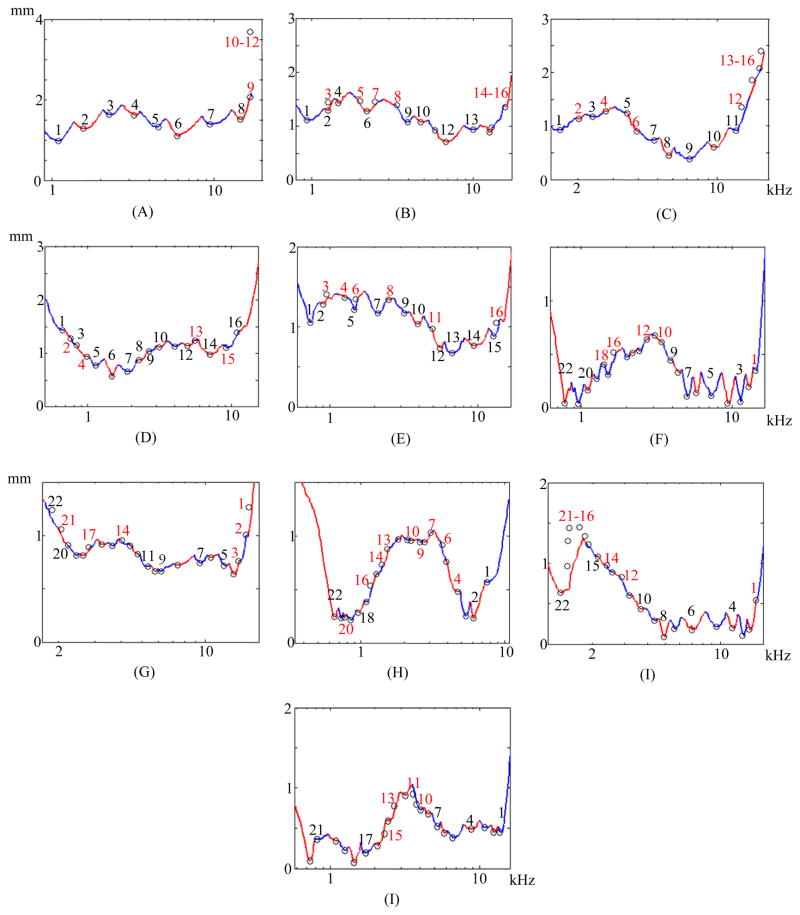
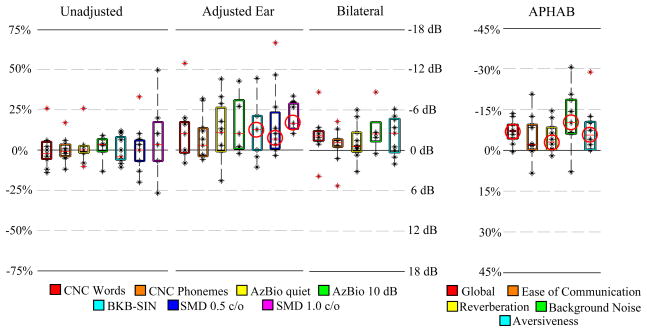
Eleven bilaterally implanted, long-term CI users participated in the image-guided programming experiment. Prior to this study, each of these subjects had undergone several iterations of traditional programming adjustments and was considered by an expert audiologist to have achieved the best hearing performance possible using the traditional behavioral programming approach. Length of CI use among subjects ranged from 0.8 to 8.9 years with an average of 3.4 years. For each subject, a battery of hearing and speech recognition tests was performed on both ears individually as well as in the bilateral condition. Then, the MAP for the poorer performing ear was manipulated according to our electrode deactivation scheme described above. The electrode distance-vs-frequency curves and deactivation plans are shown in Figure 1e for subject 1 and Figure 6 for the remaining subjects. Each subject returned for post-adjustment re-testing 3–4 weeks following the image-guided MAPping. Several widely used speech recognition metrics were measured including Consonant Nucleus Consonant (CNC) [15] word and phoneme scores (% correct), AzBio sentence recognition [16] in quiet and at a +10 dB signal-to-noise ratio (% correct), and the Bamford-Kowal-Bench Speech-In-Noise (BKB-SIN) test (dB SNR) [17]. Additionally, we assessed spectral modulation detection (SMD), which is a non-speech based hearing performance metric that provides a psychoacoustic estimate of spectral resolution, i.e., the ability of the auditory system to decompose a complex spectral stimulus into its individual frequency components [18–20]. The spectral modulation detection task used a 3-interval, forced-choice procedure to contrast flat-spectrum noises with spectrally modulated noises. The task included a fixed number of trials at fixed spectral modulation depths ranging from 8 to 16 dB in 2-dB steps and was thus not an adaptive, iterative process but rather incorporated a methodology based upon the method of constant stimuli [29]. Sixty trials were presented at both 0.5 and 1.0 cycle per octave (c/o), and performance was expressed in % correct. All speech and non-speech testing was conducted at a calibrated presentation level of 60 dB SPL using a single loudspeaker presented at 0° azimuth at a distance of 1 meter. In Figure 7, a box plot for each hearing performance metric shows the distribution across subjects of pre-adjustment scores subtracted from post-adjustment scores. As seen in the figure, results of the pre- and post-adjustment tests performed on the unadjusted ear alone show no detectable change on average. In contrast, the group average test results for the adjusted ear improve dramatically for all measures. While it is difficult to detect significance for measures that are not normally distributed with sample sizes this small (N≤11), it is notable that we were able to detect statistically significant differences for the BKB-SIN and SMD measures using the Wilcoxon signed rank test [21] at p<0.05 (indicated in the plot by red circles). In the bilateral condition, each of the measures also improves on average. In both the pre- and post-adjustment condition, each subject was also asked to complete an Abbreviated Profile of Hearing Aid Benefit (APHAB) [22] questionnaire that measures several aspects of hearing-related communication effectiveness. These results are shown in a similar box plot on the right. The APHAB questionnaire is scored as the percentage of problems with overall ease of communication, reverberation, background noise, aversiveness, and a global score that incorporates all problem types. The plot shows that the group average of each APHAB score decreases for the post-adjustment questionnaires, and the improvements in 4 of 5 of these measures reach statistical significance measured using the Wilcoxon signed rank test at the p<0.05 level. The most significant qualitative improvement may be performance in background noise. This is also reflected in the quantitative results, where in the adjusted ear, measures that include noise, i.e., AzBio +10 dB, BKB-SIN, and SMD at both modulation rates all substantially increase on average from pre- to post-adjustment tests.
Fig. 6.
Electrode distance-vs.-frequency curves for each test subject. (A)–(I) Show the electrode distance-vs.-frequency curves, similarly to Figure 1e, for subjects 2–10. Electrodes deactivated in our experiments are shown in red.
Fig. 7.
Box plots of the difference between post- and pre-adjustment scores of each hearing performance measure. Shown are the interquartile range (box), median (red line), individual data points (black dots). Whiskers extend to data points that lie within 2 times the interquartile range from the mean. Outlier points that lie beyond the whiskers are highlighted in red. Measures that reach statistical significance are indicated by red circles.
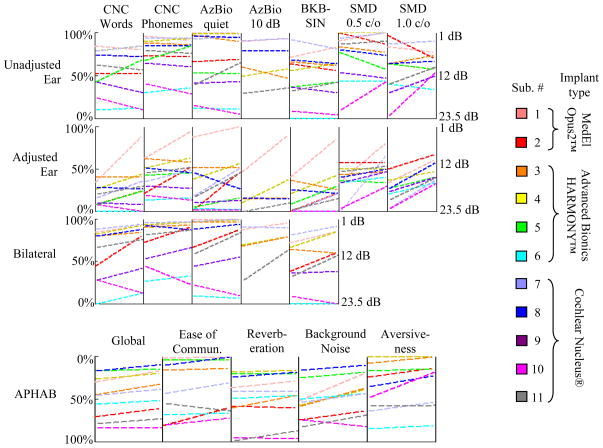
Results color-coded by individual subject are shown in as line plots in Figure 8. Lines with positive slope indicate scores that have improved from pre- to post-adjustment. For APHAB scores, a lower value indicates better hearing performance. To keep a similar visual convention with the other plots, the y-axis for APHAB results on the bottom row is reversed relative to the top rows. Due to some logistical constraints, not all measures were tested for every subject, and lines corresponding to measurements that were not tested are omitted from the plot. Although we did not exclude the results for subject 10 in any of our results, we believe they are outlier measurements as there are substantial differences in scores for the unadjusted ear, and the adjusted ear appears to follow the same trend. It was noted during testing that this subject exhibited signs of cognitive decline, but in this study we did not administer any screening instruments designed to identify those at risk for cognitive impairment. Several subjects experienced remarkable improvement in scores for their adjusted ear, e.g., CNC word scores for subjects 1, 2, 3, 5, and 7 more than or almost doubled. Performance improvement for subjects 1, 2, 3, 5, 7, and 11 reached statistical significance at the individual level measured using a binomial distribution statistic for CNC monosyllables [30] and AzBio sentences [16]. SMD at 1.0 cycle/oct improved for every subject and almost double on average. This finding alone is substantial, as few developments in strategy in the past 20 years have been shown to significantly improve spectral resolution for CI recipients [20].
Fig. 8.
Individual hearing performance results for all ten subjects shown as line plots. The left and right ends of each line plot show pre- and post-adjustment results for the indicated subject and hearing performance measure, respectively.
Improvements in bilateral performance may not seem substantial at first glance. However, with the exception of subjects 2, 9, and 11, all of the subjects already had very high scores due to their better performing ear (1, 3, 4, 7, and 8) or had very low overall scores (6 and 10), and thus the change in performance could be masked in these quantitative scores by effects of range saturation of the measures we used. Bilateral scores for subjects 2, 9, and 11 on the other hand improved substantially. The quality of overall changes is best reflected in the APHAB scores. With the exception of subject 10, performance in background noise substantially improves for all subjects. This is especially significant considering that speech recognition in noise is one of the most common problems even among the best performing CI users [4]. All other measures of sound quality either also improve or, at worst, are approximately unchanged post-adjustment. With the exception of subjects 6 and 10, each subject requested no further changes to their adjusted ear and elected to keep their experimental MAPs following these experiments.
V. Discussion & Conclusions
In this work, we have presented a set of novel methods that facilitate image-guided CI programming. Our approach is to extract programming-relevant information in the form of electrode distance-vs.-frequency curves by analyzing the spatial relationship between the CI electrodes and the SG nerves they stimulate. We also have presented an example image-guided MAPping strategy and have shown that it leads to significant improvement in hearing outcomes.
The biggest obstacle for user-specific CI spatial analysis is to identify the SG, which lacks any contrast in conventional CT. To do this, we have used a weighted active shape model-based approach. This approach accurately locates the SG by using the exterior walls of the cochlea as landmarks. We have relied on high resolution images of cadaveric specimens to serve two functions. First, they provided information necessary to construct an SSM of the structure, permitting segmentation of the structure in conventional imaging for the first time. Second, the high resolution images were used to validate the results. This was performed by transferring the automatically segmented structures from the conventional images to the corresponding high resolution images and comparing those structures to manual segmentations. Our approach achieves dice indices of approximately 0.77 and sub-millimetric maximum error distance in the region of interest for CI stimulation.
The results of our image-guided MAPping tests show that our image-guidance techniques can be used to significantly improve hearing outcomes with CIs. Since the MAP strategy we presented only requires deactivating electrodes, it is simple to integrate with existing sound processing strategies, such as CIS, using the existing clinical software provided by CI manufacturers. Typically when changes to a MAP are made, quantitative and qualitative hearing scores tend to favor the original MAP [23]. Thus, it is remarkable that the majority of the subjects in our experiments noted substantial improvement in sound quality immediately after re-programming, and these improvements are reflected in our quantitative results. It is likely that long-term experience with the new MAP will result in further improvements in hearing performance. According to the NIDCD, over 200,000 people have received CIs as of 2010 [1]. Our electrode deactivation strategy could improve hearing in many of these CI users, thus improving their communication abilities and hearing-related quality of life, without requiring additional surgical procedures. Our results show that image-guided, personalized approaches to CI programming can indeed improve spectral resolution and speech recognition in quiet and noise. However, the electrode deactivation strategy we present exploits only a small fraction of the programming relevant information captured by the image processing and analysis techniques we propose. Thus, we believe that this study presents just the first of many new and significant user-customized stimulation strategies that will be developed now that analysis of the spatial relationship between electrodes and stimulation targets is possible.
Acknowledgments
This work was supported in part by grants R21DC012620, R01DC008408, and R01DC009404 from the National Institute on Deafness and Other Communication Disorders and UL1TR000011 from the National Center for Advancing Translational Sciences. The content is solely the responsibility of the authors and does not necessarily represent the official views of these institutes.
The authors would like to acknowledge Andrea Hedley-Williams, AuD., for assisting with data acquisition, Mary S. Dietrich, Ph.D., for advice on statistical analysis, and Anthony J. Spahr, Ph.D., for providing spectral modulation detection testing software.
Biographies
 Jack H. Noble (S’07–M’11) received the B.E., M.S., and Ph.D. degrees in electrical engineering from Vanderbilt University, Nashville, TN, in 2007, 2008, and 2011, respectively.
Since 2011, he has been a Research Assistant Professor in the Department of Electrical Engineering and Computer Science, Vanderbilt University. His primary research interests include medical image processing, image segmentation, registration, statistical modeling, and image-guided surgery techniques, with emphasis on methods for image-guided cochlear implant surgery and programming.
 Robert F. Labadie received the B.S. degree in mechanical engineering from the University of Notre Dame, Notre Dame, IN, in 1988, the Ph.D. degree in bioengineering and M.D. degree from the University of Pittsburgh, PA, in 1995 and 1996, respectively. In 2001, he joined the faculty of Vanderbilt University in Nashville, Tennessee where he is currently a tenured professor in the Department of Otolaryngology/Head and Neck Surgery with a joint appointment in the Department of Biomedical Engineering.
His clinical specialty is otology with emphasis on surgical rehabilitation of the hearing impaired. His research has focused on developing image-guidance and robotic surgical technologies.
 René H. Gifford received the B.S. degree at Arizona State University in 1995 and the M.S. degree at Vanderbilt University in 1997 in Hearing and Speech, and the Ph.D. at Arizona State University in 2003 in Psychoacoustics.
Her research focuses on speech perception and psychophysical properties of acoustic hearing and the combination of electric and acoustic hearing in adults and children with cochlear implants and hearing aids. The goal of her research is to improve speech perception and communication abilities for adults and children with hearing loss.
 Benoit M. Dawant (M’88–SM’03–F’10) received the M.S.E.E. degree from the University of Louvain, Leuven, Belgium, in 1983, and the Ph.D. degree from the University of Houston, Houston, TX, in 1988.
Since 1988, he has been with the Faculty of the Electrical Engineering and Computer Science Department, Vanderbilt University, Nashville, TN, where he is currently a Cornelius Vanderbilt Professor of Engineering. His main research interests include image-guided surgery and medical image processing, segmentation, and registration.
Current domains of application include the development of algorithms and systems to assist in the placement and programming of deep brain stimulators used for the treatment of Parkinson’s disease and other movement disorders and the placement and programming of cochlear implants used to treat hearing disorders.
Footnotes
This paragraph of the first footnote will contain the date on which you submitted your paper for review. It will also contain support information, including sponsor and financial support acknowledgment.
Contributor Information
Jack H. Noble, Email: jack.h.noble@vanderbilt.edu, Department of Electrical Engineering and Computer Science, Vanderbilt University, Nashville, TN 37235 USA.
Robert F. Labadie, Email: robert.labadie@vanderbilt.edu, Department of Otolaryngology – Head & Neck Surgery, Vanderbilt University Medical Center, Nashville, TN 37235 USA
René H. Gifford, Email: rene.h.gifford@vanderbilt.edu, Department of Hearing and Speech Sciences, Vanderbilt University Medical Center, Nashville, TN 37235 USA
Benoit M. Dawant, Email: benoit.dawant@vanderbilt.edu, Department of Electrical Engineering and Computer Science, Vanderbilt University, Nashville, TN 37235 USA.
References
- 1.National Institute on Deafness and Other Communication Disorders, No 11-4798. 2011. Cochlear Implants. [Google Scholar]
- 2.Rubenstein JT. How cochlear implants encode speech. Curr Opin Otolaryngol Head Neck Surg. 2004;12(5):444–8. doi: 10.1097/01.moo.0000134452.24819.c0. [DOI] [PubMed] [Google Scholar]
- 3.Wilson BS, Dorman MF. Cochlear implants: Current designs and future possibilities. J Rehab Res Dev. 2008;45(5):695–730. doi: 10.1682/jrrd.2007.10.0173. [DOI] [PubMed] [Google Scholar]
- 4.Fu QJ, Nogaki G. Noise susceptibility of cochlear implant users: The role of spectral resolution and smearing. J Assoc Res Otolaryngol. 2005;6(1):19–27. doi: 10.1007/s10162-004-5024-3. [DOI] [PMC free article] [PubMed] [Google Scholar]
- 5.Boex C, de Balthasar C, Kos MI, Pelizzone M. Electrical field interactions in different cochlear implant systems. J Acoust Soc Am. 2003;114:2049–2057. doi: 10.1121/1.1610451. [DOI] [PubMed] [Google Scholar]
- 6.Noble JH, Labadie RF, Majdani O, Dawant BM. Automatic segmentation of intra-cochlear anatomy in conventional CT. IEEE Trans on Biomedical Eng. 2011;58(9):2625–32. doi: 10.1109/TBME.2011.2160262. [DOI] [PMC free article] [PubMed] [Google Scholar]
- 7.Noble JH, Gifford RH, Labadie RF, Dawant BM. Statistical Shape Model Segmentation and Frequency Mapping of Cochlear Implant Stimulation Targets in CT. In: Ayache N, et al., editors. MICCAI 2012, Part II, LNCS 7511. 2012. pp. 421–428. [DOI] [PMC free article] [PubMed] [Google Scholar]
- 8.Noble JH, Schuman A, Wright CG, Labadie RF, Dawant BM. Automatic Identification of Cochlear Implant Electrode Arrays for Post-Operative Assessment. Proc of the SPIE conf on Med Imag. 2011;7962:796217. doi: 10.1117/12.878490. [DOI] [PMC free article] [PubMed] [Google Scholar]
- 9.Wilson BS, Finley CC, Lawson DT, Wolford RD, Eddington DK, Rabinowitz WM. Better speech recognition with cochlear implants. Nature. 1991;352:236–238. doi: 10.1038/352236a0. [DOI] [PubMed] [Google Scholar]
- 10.Stakhovskaya O, Spridhar D, Bonham BH, Leake PA. Frequency Map for the Human Cochlear Spiral Ganglion: Implications for Cochlear Implants. J Assoc Res Otol. 2007;8:220–33. doi: 10.1007/s10162-007-0076-9. [DOI] [PMC free article] [PubMed] [Google Scholar]
- 11.Friesen LM, Shannon RV, Baskent D, Wang X. Speech recognition in noise as a function of the number of spectral channels: Comparison of acoustic hearing and cochlear implants. J Acoust Soc Am. 2001;110(2):1150–63. doi: 10.1121/1.1381538. [DOI] [PubMed] [Google Scholar]
- 12.Garnham C, O’Driscoll M, Ramsden R, Saeed S. Speech understanding in noise with a Med-El COMBI 40+ cochlear implant using reduced channel sets. Ear Hear. 2002;23(6):540–52. doi: 10.1097/00003446-200212000-00005. [DOI] [PubMed] [Google Scholar]
- 13.Zwolan TA, Collins LM, Wakefiled GH. Electrode discrimination and speech recognition in postlingually deafened adult cochlear implant subjects. J Acoust Soc Am. 1997;102(6):3673–85. doi: 10.1121/1.420401. [DOI] [PubMed] [Google Scholar]
- 14.Garadat SN, Zwolan TA, Pfingst BE. Across-site patterns of modulation detection: Relation to speech recognition. J Acoust Soc Am. 2012;131(5):4030–41. doi: 10.1121/1.3701879. [DOI] [PMC free article] [PubMed] [Google Scholar]
- 15.Peterson GE, Lehiste I. Revised CNC lists for audiotory tests. J Speech and Hear Dis. 1962;27:62–70. doi: 10.1044/jshd.2701.62. [DOI] [PubMed] [Google Scholar]
- 16.Spahr AJ, Dorman MF, Litvak LM, Van Wie S, Gifford RH, Loizou PC, Loiselle LM, Oakes T, Cook S. Development and validation of the AzBio sentence lists. Ear Hear. 2012;33(1):112–7. doi: 10.1097/AUD.0b013e31822c2549. [DOI] [PMC free article] [PubMed] [Google Scholar]
- 17.Bench J, Kowal A, Bamford J. The BKB (Bamford-Kowal-Bench) sentences lists for partially-hearing children. Br J Audiol. 1979;13:108–12. doi: 10.3109/03005367909078884. [DOI] [PubMed] [Google Scholar]
- 18.Saoji AA, Litvak LM, Spahr AJ, Eddins DA. Spectral modulation detection and vowel and consonant identifications in cochlear implant listeners. J Acoust Soc Am. 2009;126(3):955–8. doi: 10.1121/1.3179670. [DOI] [PubMed] [Google Scholar]
- 19.Henry BA, Turner CW. The resolution of complex spectral patterns by cochlear implant and normal-hearing listeners. J Acoust Soc Am. 2003;113(5):2861–73. doi: 10.1121/1.1561900. [DOI] [PubMed] [Google Scholar]
- 20.Drennan WR, Won JH, Nie K, Jameyson E, Rubinstein JT. Sensitivity of psychophysical measures to signal processor modifications in cochlear implant users. Hear Res. 2010;262:1–8. doi: 10.1016/j.heares.2010.02.003. [DOI] [PMC free article] [PubMed] [Google Scholar]
- 21.Wilcoxon F. Individual comparisons by ranking methods. Biometrics Bulletin. 1945;1(6):80–83. [Google Scholar]
- 22.Cox RM, Alexander GC. The abbreviated profile of hearing aid benefit. Ear Hear. 1995;16(2):176–86. doi: 10.1097/00003446-199504000-00005. [DOI] [PubMed] [Google Scholar]
- 23.Tyler RS, Preece JP, Lansing CR, Otto SR, Gantz BJ. Previous experience as a confounding factor in comparing cochlear-implant processing schemes. J Speech Hear Res. 1986;29:282–7. doi: 10.1044/jshr.2902.282. [DOI] [PubMed] [Google Scholar]
- 24.Rogers M, Graham J. Robust Active Shape Model Search. ECCV 2002, LNCS. 2002;2353:517–53. [Google Scholar]
- 25.Cootes TF, Taylor CJ, Cooper DH, Graham J. Active Shape Models—Their Training and Application. Comp Vis Image Unders. 1995;61(1):39–59. [Google Scholar]
- 26.Green BF. The orthogonal approximation of an oblique structure in factor analysis. Psychometrika. 1952;17:429–440. [Google Scholar]
- 27.Dice LR. Measures of the amount of ecologic association between species. Ecology. 1945;26:297–302. [Google Scholar]
- 28.Zijdenbos AP, Dawant BM, Margolin R. Morphometric Analysis of White Matter Lesions in MR Images: Method and Validation. IEEE Trans on Med Imag. 1994;13(4):716–724. doi: 10.1109/42.363096. [DOI] [PubMed] [Google Scholar]
- 29.Fechner GT. Elemente der Psychophysik. In: Rand B, editor. The Classical Psychologists. Boston: Houghton Mifflin; 1912. pp. 562–572. [Google Scholar]
- 30.Thornton AR, Raffin MJ. Speech-discrimination scores modeled as a binomial variable. J Speech Hear Res. 1978;21:507–518. doi: 10.1044/jshr.2103.507. [DOI] [PubMed] [Google Scholar]
- 31.Gifford RH, Shallop JK, Peterson AM. Speech Recognition Materials and Ceiling Effects: Considerations for Cochlear Implant Programs. Audiol Neurotol. 2008;13:193–205. doi: 10.1159/000113510. [DOI] [PubMed] [Google Scholar]


