

Abstract
Measurement of vessel caliber by Magnetic Resonance Imaging (MRI) is a valuable technique for in vivo monitoring of hemodynamic status and vascular development, especially in the brain. Here, we introduce a new paradigm in MRI coined as Vessel Architectural Imaging (VAI) that exploits an intriguing and overlooked temporal shift in the MR signal forming the basis for vessel caliber estimation and show how this phenomenon can reveal new information on vessel type and function not assessed by any other non-invasive imaging technique. We also show how this biomarker can provide novel biological insights into the treatment of cancer patients. As an example, we demonstrate using VAI that anti-angiogenic therapy can improve microcirculation and oxygen saturation levels and reduce vessel calibers in patients with recurrent glioblastomas, and more crucially, that patients with these responses have prolonged survival. Thus, VAI has the potential to identify patients who would benefit from therapies.
Keywords: Vessel caliber, perfusion MRI, cerebral hemodynamics, glioblastoma, anti-VEGF
INTRODUCTION
Anti-angiogenic therapeutic agents target solid tumors by vessel pruning and normalization of vascular structure and function thereby contributing to improved outcome of simultaneously administered chemo-, radiation- and immuno-therapies1–3. In a trial using cediranib, an oral pan-VEGF (vascular endothelial growth factor) receptor kinase inhibitor4, patients with recurrent glioblastomas whose tumor perfusion increased during treatment survived approximately 6 months longer compared to those whose perfusion did not increase5. Although promising, the exact microvascular mechanism by which these drugs increase perfusion and subsequently improve survival in patients is not fully understood. In the brain, magnetic resonance imaging (MRI) is the modality of choice for soft tissue imaging in vivo. In addition to measures of perfusion and blood volume, newer MRI techniques can estimate microvascular vessel caliber, thereby providing further insight into tissue microvascularity6–9. Vessel caliber is estimated by comparing the changes in observed proton relaxation from simultaneously acquired contrast agent-enhanced gradient-echo and spin-echo MRI6, 7, 9. The gradient-echo and spin-echo readouts have different sensitivity to the so-called susceptibility effect, the magnetization induced in a medium when exposed to a magnetic field and the highly susceptibility-sensitive gradient-echo images are sensitive to both microscopic and macroscopic vessels, whereas spin-echo images are predominantly sensitive to microscopic vessels (radius < 10 μm)7, 10, 11.
Here we build on this concept and exploit an overlooked temporal shift in the MR signal that forms the basis for vessel caliber estimation and have coined the technique Vessel Architectural Imaging (VAI). In practice, cerebral vessel caliber by MRI is assessed using the quotient of gradient-echo to spin-echo blood volume or direct assessment of the point-by-point difference in the contrast agent-enhanced relaxation rate curves4, 9, 12, 13. However, depending on the hemodynamic properties of the tissue, the different sensitivities of the gradient-echo and spin-echo images to the susceptibility effect will result in an apparent variation in the respective MRI signal readouts (Fig. 1a–d). The outcome of this is a relative shift in the shapes and peak positions of the two relaxation rate curves. When visualized in a parametric plot, depending on tissue type, the pair-wise gradient-echo and spin-echo data points may form a vortex curve of a certain shape and transverse in a clockwise or counter-clockwise direction9.
Figure 1.
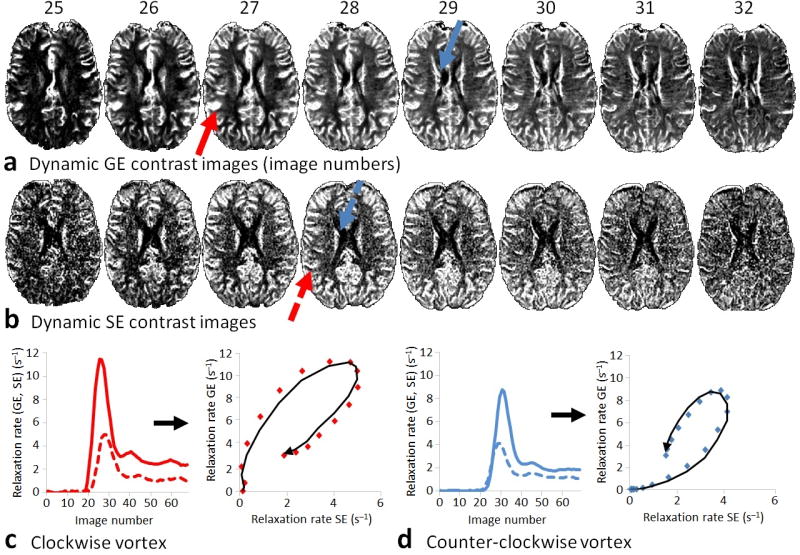
Vessel architectural imaging in a healthy volunteer. Simultaneously acquired (a) gradient-echo (GE) and (b) spin-echo (SE) contrast enhanced relaxation rate images showing the gradient-echo and spin-echo MR signals peaking at different image readouts during the contrast agent bolus passage. Typically, in areas with fast inflow of the contrast agent, such as in the feeding branches of the middle cerebral artery (red arrows), the gradient-echo signal peaks earlier than the spin-echo signal resulting in a clockwise vortex when plotting the relaxation rate curves in a point-by-point parametric plot (c). Correspondingly, in slow inflow areas, for example in the venules leading to the internal cerebral veins (blue arrows), the spin-echo signal peaks earlier than the gradient-echo signal resulting in a counter-clockwise vortex (d). The contrast agent-induced relaxation rates in (c–d) are scaled relative to their baseline rates (prior to contrast agent arrival), and will increase and decrease with a full-width half-maximum proportional to the mean transit time. Volume fraction (Vf) is defined as the area under the relaxation rate curves (percentage of blood in the image voxel ~ blood volume), whereas perfusion (~ flow) can be estimated using the central volume principle stating that Vf is the product of flow and mean transit time.
The origin of this phenomenon, its exact relationship to the underlying tissue and its implication for imaging in cancer patients have not been described to date. Here, we first illustrate the power of the VAI technique in a range of vessel types under different conditions by using Monte Carlo simulations and then show data from subjects with recurrent glioblastomas. Using VAI, we found that anti-angiogenic therapy led to a reduction in tumor vessel calibers, improved hemodynamic efficiency and oxygen saturation levels, and more importantly, that subjects with these responses had prolonged survival.
RESULTS
Intravascular magnetic susceptibility perturbations in VAI
To gain insight into the VAI technique for different vessel types and calibers, we conducted Monte Carlo simulations to derive parametric vessel vortex curves for physiologically meaningful capillary vessels of 3.5 μm radius and non-capillary vessels with radii ranging from 7.5 μm to 40 μm (Fig. 2). Note that the vessel vortices transverse in a counter-clockwise direction if, and only if, the vascular system contains both slow inflow, larger-caliber venule-like vessel components and faster inflow, smaller-caliber arteriole-like or capillary-like vessel components. In contradistinction, if the vascular system consists of arterioles and capillaries only – or, for some geometrical, pathological or physiological reason, fast inflow arterioles with larger calibers than venules8, 14 - the vessel vortices transverse in a clockwise direction. For vessels of identical calibers, because of differences in tissue-specific oxygen saturation (SO2) levels15, 16, the vessel vortices transverse in a counter-clockwise direction if both arterioles and venules are included. However, if all vessels have identical calibers and SO2 levels, there is no vortex (shown for capillaries in Fig. 2). Similarly, if a vascular system with a fixed SO2 level contains arterioles, capillaries or venular structures only, there is no vortex - even if the vessels have different radii (Supplementary Fig. 1a).
Figure 2.

Parametric vessel vortex curves for different vessel combinations. Monte Carlo simulation showing the resulting point-by-point parametric vessel vortex curves from the gradient-echo (GE) and spin-echo (SE) relaxation rate curves following a theoretical contrast agent injection at different combinations of vessel radii and type. The vessel vortex curves vary in size, shape and direction (clockwise versus counter-clockwise) depending on the combination of vessel type and caliber. For vortex direction, a counter-clockwise vortex is observed only if slower inflow, venule-like vessels with larger calibers than the other vessel components (arterioles or capillaries) are included in the system. Compared to arterioles, healthy venules are typically characterized by larger vessel calibers with longer mean transit times and slower inflow. For all vessel combinations, Vf was kept at 3.5%, where an increase in vessel caliber (distension) implies a subsequent reduction in vessel density (negative recruitment). The SO2 levels were kept at normal values (arterioles at 90 – 95%, capillaries and venules at 50%)15, 16.
The shape of the vessel vortex curve depends not only on the vessel types included, but also on their relative difference in vessel radius as discussed below (Supplementary Fig. 1b–c). The slope of the vortex curve is assumed proportional to the vessel caliber, and tilted towards the gradient-echo axis for vascular systems with larger average vessel calibers9. We provide a schematic illustration of the VAI analysis procedure, including an explanation of how the various parameters are derived from the vessel vortex curves (Supplementary Fig. 2).
VAI response to changes in volume fraction and SO2 levels
We used Monte Carlo simulations to gain insight into the VAI technique for different blood volume fractions (Vf ~ blood volume, Fig. 1c–d), and for varying levels of SO2. Increased Vf by vessel recruitment (Supplementary Fig. 3a) results in; a proportional increase in the length of the long axis of the vessel vortex curve16 (Supplementary Fig. 4a), exponential decrease in slope value (Supplementary Fig. 4d) and a proportional increase in the corrected vessel vortex area (Supplementary Fig. 4g). For vessel distention (Supplementary Fig. 3b) similar, although less pronounced effects are observed (Supplementary Fig. 4b,e,h). The only exception is an exponential increase in slope value with increased Vf for tissue without functioning or missing capillary vessels or for vessel shunting. The vessel vortex direction was not affected by the induced changes in vessel recruitment nor distention.
The resulting vessel vortex curves for varying levels of SO2 were assessed using different combinations of arterioles, capillaries and venules (Fig. 3a,b). Here, the length of the long axis and the slope of the vessel vortex curve increase with increasing levels of deoxygenated blood (Supplementary Fig. 4c,f). In a vascular system with relatively unchanged or fixed vessel calibers and inflow rates, the corrected vessel vortex area reflects the different baseline susceptibility states in oxygenated and deoxygenated blood and thus SO2 levels. Here, under normal conditions (venule calibers > arteriole calibers), the corrected vessel vortex area shows a Gaussian, bell-shaped response to changes in SO2 levels (Supplementary Fig. 4i) expressed by an increase in the corrected vessel vortex area for increased absolute differences in SO2 levels between well-saturated, oxygenated arterioles (SO2 > 90%) and deoxygenated capillaries and venules (SO2 < 90%). Correspondingly, for anoxic SO2 levels and towards a theoretical and fully deoxygenated hemodynamic environment (arterioles; SO2 < 75%, capillaries and venules; SO2 = 0%), the corrected vessel vortex area decreases.
Figure 3.

Responses in parametric vessel vortex curves to changes in oxygen saturation. Monte Carlo simulations showing resulting parametric vessel vortex curves for a uniform system of arterioles (R = 10 μm), capillaries (R = 3.5 μm) and venules (R = 10 μm) from changes in SO2 levels (Vf fixed at 3.5%). In (a), the SO2 levels in the arterioles are kept at 93% with capillary- and venule SO2 levels ranging from 93% (no consumption, i.e. from local shunting) to 0% (full consumption). In (b), the SO2 levels in the arterioles range from 93% to 0% with capillaries and venules SO2 levels fixed at 0%. Note that the slope, as would be identified by a linear fit of the vessel vortex curve and historically used as a measure proportional of vessel caliber9, is higher in (b) compared to (a) at pathologic levels of SO2 even though the vessel caliber is unchanged (shown for 0% - 0% and 93% - 93%, respectively, with trend lines indicating no vortex curves). (GE = gradient-echo, SE = spin-echo).
Improved tumor microcirculation prolong survival
We show a clinical application of VAI by retrospective analysis of 30 human subjects with recurrent glioblastomas enrolled in a Phase II clinical trial of cediranib4, 17. Collectively, a significant increase (pair-wise Wilcoxons Signed Ranks test; P < 0.05) in the relative number of image voxels with a clockwise vortex direction in the tumor after therapy onset was observed thereby mimicking normal-appearing tissue values (Supplementary Fig. 5a and Supplementary Table 1). A more dominant effect was seen in the tumor center (pair-wise Wilcoxons Signed Rank test; P < 0.01) compared to the tumor edge (Supplementary Fig. 5b). Ten subjects were identified as responders to the anti-angiogenic therapy by a relative increase in image voxels with a clockwise vortex direction compared to the arithmetic mean of all subjects, and at a minimum of two consecutive imaging time points (Fig. 4a–d and Supplementary Fig. 5c). Twelve subjects were identified as non-responders by a relative decrease in image voxels with a clockwise vortex direction (Supplementary Figs. 6 and 5d).
Figure 4.

Parametric vessel vortex curves of a responding subject with recurrent glioblastoma. (a) Contrast agent enhanced MRI (T1-weighted) at baseline (days −5 and −1) and during anti-angiogenic therapy (days 1, 28, 56 and 112). (b) Contrast enhancing tumor regions outlined on MRI showing tumor center (blue) and tumor edge (red). (c) Vessel caliber MRI. (d) Corresponding average vessel vortex curves from all pair-wise gradient-echo (GE) and spin-echo (SE) relaxation rate curves in the tumor center (blue vortex curves) and tumor edge (red vortex curves). Following anti-angiogenic drug administration, the contrast agent-enhanced tumor area recede while the average vessel vortex direction change from being predominantly counter-clockwise at baseline to a clockwise vortex direction during treatment (days 1 and 28), before reversing at day 56. This effect is most prominent in the tumor center and the subject was identified as a responder to the anti-angiogenic therapy by a relative increase image voxels with a clockwise vortex direction compared to the arithmetic mean of all subjects. (GEref, SEref = scaled to GE and SE reference curves, respectively).
Median overall survival for responding subjects was 341 d compared to 146 d for non-responders (Fig. 5a–c). Using Cox regression with time dependent covariates, the relative increase in clockwise vessel vortices during anti-angiogenic therapy was an independent predictor of progression-free survival and overall survival (P < 0.01) and also reflected in significant reductions in the contrast enhanced and FLAIR tumor volumes at day 28 (Mann-Whitney tests; P < 0.05; Supplementary Fig. 7a,b). In addition to Vf, no differences in vessel calibers, permeability, spin-echo and gradient-echo perfusion (flow) or spin-echo and gradient-echo mean transit times were observed between the two groups (Supplementary Fig. 7c–h). For responding subjects and compared to pre-treatment, significant reductions in whole-tumor vessel calibers (pair-wise Wilcoxons Signed Rank test; P < 0.01) and subsequent reductions in Vf and corrected vessel vortex area in the tumor center were observed (pair-wise Wilcoxons Signed Rank tests; P < 0.01). Reproducibility analysis showed minimal variability (Supplementary Fig. 5e,f).
Figure 5.

Vessel architectural imaging during anti-angiogenic therapy in subjects with recurrent glioblastomas. (a) Example anatomical MRI and VAI of a subject with recurrent glioblastoma at baseline (day −1) and at day 28 after therapy onset. The images show (top-to-bottom); anatomical contrast enhanced T1-weighted images, volume fraction maps, vessel caliber maps, vessel vortex area maps and vessel vortex direction maps, respectively. At baseline, larger vessel calibers are observed in the tumor center compared to the tumor edge, with low oxygen extraction (low vessel vortex area values) and few voxels with a clockwise vessel vortex direction. (b) Corresponding vessel architecture in tumor edge, tumor center and reference tissue at baseline and day 28, respectively. The resulting vessel structures are based on average values from all 30 subjects, including vessel caliber, Vf, vessel vortex direction and vessel vortex area (Supplemental Table 1). Responding subjects (n = 10) show a move towards a more competent microcirculation during therapy identified by a relative increase in image voxels with a clockwise vessel vortex direction in the tumor center, with reduced vessel calibers and improved SO2 levels. Similar to normal tissue, red-to-violet-to-blue colors indicate normal appearing arteriole, capillary and venule hemodynamic status, respectively. (c) Kaplan-Meier survival curves show prolonged survival for responding subjects (median PFS = 153 d, OS = 341 d) compared to non-responding subjects (n = 12; median PFS = 64 d, OS = 146 d), the latter identified by a relative decrease in voxels with a clockwise vessel vortex direction.
DISCUSSION
Assessment of the topological and structural heterogeneity of tumor microcirculation is important for monitoring of disease progression and treatment response. Tumor vessels are characterized by increases leakiness and regional, inefficient closed or blind vascular pathways with or without hypoxia2, 18–22. The VAI technique described in our study is capable of measuring these effects in vivo, ranging from well-functioning, well-oxygenated normal-appearing tissue to the vascular collapse observed in anoxic tumor tissue. Our results provide several new insights. Overall, the temporal shift in the MR signal can be readily observed with a standard combined gradient-echo and spin-echo contrast enhanced MRI acquisition technique. In normal tissue, the resulting vessel vortex curve propagates in a counter-clockwise direction if large, slow inflow vessels and faster inflow vessels with smaller calibers are present. The slope of the vessel vortex curve is indeed influenced by the average vessel caliber of the tissue9, but the traditional view of increasing slope values for bigger vessel calibers is dependent on changes in Vf and SO2 levels. The highest slope values were observed for theoretical vessel systems with local shunting, where big disorganized, fast-flow arterioles aberrantly connect to disorganized venous structures19, 23. Contrary to vascular systems with functioning capillaries, local shunting will also depict a relatively constant corrected vessel vortex area indicative of little or no difference in oxygen saturation between the tissue types.
The subnormal vascular function and non-uniform branching hierarchy of recurrent glioblastomas2, 20 was identified by a higher relative ratio of larger-caliber, deoxygenated venule-like vessel compared to other vessel types. This was more pronounced towards the tumor center and in line with a vascular gradient moving from a neoangiogenic tumor border of normal- or dilated vessels towards a hypoxic or anoxic core with scarce, inefficient and very large vessels1, 22, 24. During anti-angiogenic therapy, a higher ratio of image voxels with a clockwise vortex direction was observed in responding subjects, mimicking the ratio seen in normal-appearing tissue. This change in vessel vortex direction requires a higher quantity of vessels with fast inflow rates combined with a reduction of large vessels with slow inflow. This is consistent with data from studies in animal and human solid tumors where proper doses of anti-angiogenic drugs lead to improved tumor microenvironment and more effective delivery of exogenously administered therapeutics by reduced tumor hyperpermeability and vessel calibers, hypoxia and interstitial fluid pressure and increased vascular pericyte coverage2, 5, 25–27. Correspondingly, the improved microcirculation identified by the VAI technique was predictive of progression-free survival and overall survival. Interestingly, although perfusion plays a key role in the response to therapy5, average perfusion values alone could not explain the observed difference between responders and non-responders. This is in line with previous work showing that changes in perfusion are not likely to have a substantial influence on the relaxation rate curves7 (i.e. vessel vortex curves) and indicates that VAI is a different and potentially more sensitive biomarker than traditional MRI. This may, in part, be explained by the VAI’s apparent sensitivity to changes in SO2 levels. For responding subjects at day one of treatment, the average vessel vortex curve slope did not increase even though the average Vf decreased –which at a hypothetical fixed SO2 level should have resulted in an increased slope value (Supplementary Fig. 4d–f). This suggests that anti-angiogenic therapy improves and normalizes oxygen concentrations thereby providing benefit to these subjects2, 19, 23, 27.
In summary, while traditional MRI of cancer in vivo is confounded by haphazard and heterogeneous vessel architecture with limited or redundant perfusion, the VAI technique exploits these properties and provides further insights into the complex nature of tumor vascularity.
ONLINE METHODS
Monte Carlo simulations
We performed Monte Carlo simulations in Matlab (MathWorks) to assess variations in transverse relaxation rates for the gradient-echo and spin-echo signals as a function of contrast agent concentration and microvascular structure. The general theory behind the relaxation rate simulations has been previously described7. In short, the intravascular fraction of tissue is approximated by randomly oriented water impermeable cylinders with a defined blood volume fraction (Vf), radius (R), water diffusion (D) and susceptibility difference (Δχ) between the intra-cylindrical and extra-cylindrical space. Vessels were modeled as infinite cylinders under the assumption that the average proton diffusion length during the observation time, equal to the echo-time (TE) of the respective gradient-echo and spin-echo sequences, is much shorter than the typical vessel segment length. The z-component of the magnetic field perturbation of the external magnetic field B0 (oriented along the horizontal z-axis of the MR magnet) due to each segment can then be approximated by:
| (1) |
where θ is the angle between B0 and the cylinder axis and (ϕ, r) are the polar coordinates of the proton location relative to the projection of B0 in a plane orthogonal to the cylinder axis.
A single proton was placed at the origin of the closed simulation space and allowed to randomly diffuse in a plane orthogonal to B0 through the intra- or extra-cylindrical space with total diffusion duration equal to the echo-time. The random walk was simulated by arbitrarily changing the orientation of the spin every 0.1 ms using a Gaussian displacement distribution (with mean; μ = 0 and variance; ) along the orthogonal directions at each time step. The magnetic field perturbation at the proton position from a predefined set of cylinders, and the corresponding phase shift, were recorded every 0.5 ms. This procedure was repeated for n = 5000 protons and the complex signal due to the accumulated phase of all protons were defined as:8
| (2) |
where φn (t) is the phase of the n-th proton at time t. The proton phase accumulated during a time step from the presence of each cylinder was given by Δφn (t) = γΔBzΔt, where γ is the gyromagnetic ratio.
For estimations of Δχ as a function of contrast agent concentration, the baseline magnetic susceptibility of fully oxygenated blood and tissue was assumed to be equal and Δχ directly proportional to [C]χGd, where [C] is the intravascular gadolinium concentration and χGd = 0.32*10−6 mM−1 as previously shown28. The transverse relaxation effect due to deoxygenated blood was modeled by inclusion of an additional intra- and extra-vascular susceptibility difference in the resulting arterial, capillary and venous relaxation rate curves which could be varied between ΔχdHb = 2.5*10−6 for fully deoxygenated blood and ΔχdHb = 0 for fully oxygenated blood16, 29. The relationship between arteriole and venule brain hematocrit were considered linear for our data and thus negligible30. The corresponding change in relaxation rate (shown for gradient-echo) was estimated by assuming a mono-exponential signal decay as a function of diffusion time:
| (3) |
where | | is the modulus of the signal. For estimation of spin-echo relaxation rate changes, the phase dispersion was inverted at t = TE/2 to account for the refocusing effect of the 180 ° radio frequency pulse. The spin-echo signal decay was then similarly measured at time TE and converted to the corresponding change in relaxation rate according to equation [3]. The effect of red blood cell velocity combined was not included in our simulations. Unlike normal tissue, blood velocities in tumor do not strictly depend on vessel calibers31. However, previous simulations suggest that the effect of red blood cell velocity is expected to be equal for the gradient-echo and spin-echo relaxation rate curves with minimal variance for changes in velocity about or above physiologic capillary velocities7 (≥ 0.2 cm s−1). Furthermore, it should be noted that the random walk model is limited in that it only simulates relaxation effects due to proton diffusion orthogonal to the external magnetic field and does not model the full effect of three-dimensional displacements. However, given the random orientation of capillaries, the induced relaxation effect can be assumed to be independent of z-position (position along B0) and the two-dimensional model has previously been shown to provide relaxation rate estimates in very good agreement with in vivo data obtained with an intravascular contrast agent in a rat model7.
Representative relaxation rate curves following a simulated contrast agent injection (similar to the curves in Fig. 1c–d) were estimated by coupling the resulting gradient-echo and spin-echo relaxation rates at physiologically meaningful values of Vf, radius and water diffusion32 to synthetic and typical arterial, capillary and venous shaped curves using JSim (National Simulation Resource Physiome initiative)33. Parametric vessel vortex curves were derived by point-by-point parametric plots of the gradient-echo and spin-echo relaxation rate curves (Fig. 1c–d and Supplemental Fig. 2)9, 34. The effect of contrast agent extravasation due to disrupted blood-brain-barrier was assumed negligible or corrected for.
Human subjects
The study was approved by the institutional review board and informed consent was obtained from all subjects17. Subject data included 13 females and 17 males diagnosed with a recurrent glioblastoma, average age 52 years, range 20–78 years. After study termination, nine subjects received one subsequent cycle of salvage chemotherapy, eight subjects received two cycles, one subject received three cycles, two subjects had undisclosed information on salvage chemotherapy and one subject received stereotactic radiosurgery.
MRI acquisition
Baseline MRI examinations were acquired prior to therapy onset (days −5 and −1), and then repeated on days 1, 28, 56 and 112 after cediranib (AstraZeneca Pharmaceuticals) anti-angiogenic therapy onset or until disease progression according to the Macdonald criteria4, 35. All imaging were performed on a 3 Tesla Magnetom Trio MRI system (Siemens Medical Solutions) as follows:
T1-weighted images. Axial images acquired prior to, and after, contrast agent injection (gadopentetate-dimeglumine, Gd-DTPA, Magnevist, Bayer Schering Pharma AG). Repetition-time 600 ms, echo-time 12 ms, slice-thickness 5 mm, inter-slice distance 1 mm, in-plane resolution 0.45:0.45 mm, matrix size 384:512 and 23 slices.
T2-weighted (FLAIR) images. Axial images with repetition-time 10 s, echo-time 70 ms, slice-thickness 5 mm, inter-slice distance 1 mm, in-plane resolution 0.60:0.45 mm, matrix size 384:512 and 23 slices.
Dynamic contrast enhanced (DCE) images. Axial, fast gradient-echo images with repetition-time 5.7 ms, echo-time 2.73 ms, slice-thickness 2.1 mm, inter-slice distance 0.4 mm, in-plane resolution 2.90:2.00 mm, matrix size 128:87 and 20 slices. After approximately 52 s of imaging, a 0.1 mmol kg−1 dose of Gd-DTPA was injected at 5 cc s−1. Also, spoiled gradient recalled-echo images with five different flip angles (2, 5, 10, 15 and 30 °) were initially acquired for T1-mapping.
Dynamic susceptibility contrast (DSC) perfusion images. Axial dual-echo echo-planar images with repetition-time 1.33 s, echo-times 34 ms and 103 ms, slice-thickness 5 mm, inter-slice distance 2.5 mm, in-plane resolution 1.70:1.70 mm, matrix size 128:128, 10 slices and 120 volumes. After approximately 85 s of imaging, a 0.2 mmol kg−1 dose of Gd-DTPA was injected at 5 cc s−1.
MRI post-processing
An experienced neuroradiologist identified tumor by outlining enhancing regions on the contrast-enhanced T1-weighted images and peritumoral vasogenic edema on the FLAIR images4. The anatomical MR images were realigned to the DSC and DCE images using normalized mutual information coregistration. On the T1-weighted tumor outlines, areas corresponding to the tumor center and edge were derived using three-dimensional connectivity morphologic analysis in Matlab where an image voxel was assumed to be a center voxel if all neighboring cubical voxels were also outlined as tumor.
The DCE data were processed using custom-made software in Matlab, applying standard approaches to create Ktrans maps4, a measure of the permeability that roughly corresponds to wash-in rates of the contrast agent in tissue.
We obtained relaxation rate curves for VAI analysis, perfusion values, blood volumes and mean transit times using established tracer kinetic models on the DSC images, corrected for contrast agent leakage (from blood-brain-barrier breakdown or resection)36 and fitted to a gamma-variate curve for better visualization of vessel vortex effects. It has been speculated that contrast agent leakage is the reason for the clockwise vortex effect9. Not correcting for leakage resulted in an average 5% drop in the clockwise to counter-clockwise vortex direction ratio with minimal influence on our results. Here, the pre-dose of Gd-DTPA during DCE imaging saturated potential leaky tumor tissue in the DSC images thereby minimizing the influence of leakage-induced T1-shortening effects. Relaxation rate curves not suited for analysis, conveying highly fluctuating time-courses from partial volume effects, voxel shifts and physiological pulsations were excluded from further analysis. Across all 30 subjects, an average of 78.21% ± 12.78% (standard deviation) of all tumor voxels met the inclusion criteria. To account for potential global systemic effects from hypertension, tumor relaxation rate curves were scaled with corresponding slice-specific mean, normal-tissue reference curves. In all figures showing vessel vortex curves, the tails of the vortex curves have been cut short to better visualize vortex direction. VAI analysis was performed using custom-made software in Matlab and traditional MRI was analyzed in nordicICE (NordicNeuroLab AS).
Statistical analysis
A subject was assumed to have an increase (decrease) in voxels with a clockwise vortex direction if the clockwise- to counter-clockwise ratio was higher (lower) than the 95% confidence interval of the population arithmetic mean for two consecutive imaging time points. Subjects who did not meet this criterion were treated as having no change in vortex direction ratio. Differences in VAI parameters during therapy were assessed using pairwise Wilcoxons Signed Rank test. Differences in tumor volumes, vessel caliber, permeability, perfusion and mean transit times were assessed using Mann-Whitney tests. Associations between changes in vessel vortex direction ratios and progression-free survival and overall survival were assessed using multinomial logistic regression, Kaplan-Meier survival analysis and Cox regression after adjustments for age, extent of resection, neurological performance, salvage chemotherapy and stereotactic radiosurgery after study termination as well as changes in permeability (Ktrans), T1-weighted contrast-enhanced tumor volume and T2-weighted FLAIR tumor volume prior to, and during, anti-angiogenic therapy. For all tests, P = .05 was considered significant (with Holm-Bonferroni correction for multiple comparisons) and pixel values below a 5% percentile and above a 95% percentile were removed prior to analysis to reduce the influence of outliers. Reproducibility tests were assessed using Spearman Rank correlations and Bland-Altman plots. Statistical analysis was performed using SPSS 17 (SPSS Inc.).
Supplementary Material
Acknowledgments
Financial support
USPHS grants R21CA117079, S10RR023401, S10RR019307, S10RR019254, S10RR023043, S10RR021110, R01CA137254, R01CA129371, 5R01NS060918, K24CA125440, P01CA80124, K25AG029415.
National Cancer Institute (Clinicaltrails.gov, NCT00035656), SAIC-Frederick Inc. grant 26XS263, Norwegian Research Council grant 191088/F20, South-Eastern Norway Regional Health Authority Grant 2013069, Danish Research Foundation (CFIN), Ministry of Science, Innovation and Technology, Denmark (UNIK), Sigrid Juselius Foundation, The Instrumentarium Research Foundation, The Academy of Finland, The Paulo Foundation and The Finnish Medical Foundation, Harvard Catalyst grant M01-RR-01066 and NIH Award #UL1 RR 025758.
The authors thank T. Stylianopoulos (Department of Mechanical and Manufacturing Engineering, University of Cyprus, Cyprus) and J.W. Baish (Department of Mechanical and Biomedical Engineering, Bucknell University, Lewisburg, Pennsylvania, USA) for critical reading of this manuscript.
This work was conducted with support from Harvard Catalyst | The Harvard Clinical and Translational Science Center (US National Institutes of Health Award #UL1 RR 025758, M01-RR-01066 and financial contributions from Harvard University and its affiliated academic health care centers). The content is solely the responsibility of the authors and does not necessarily represent the official views of Harvard Catalyst, Harvard University and its affiliated academic health care centers, the US National Center for Research Resources, or the US National Institutes of Health.
Footnotes
AUTHOR CONTRIBUTIONS
K.E.E. wrote the manuscript. K.E.E., K.M., A.B., P.Y.W., P.I., T.T.B., B.R.R., R.K.J. and A.G.S. designed the study. D.J., B.R.R. and A.G.S. acquired all MRI data. P.Y.W. and T.T.B. acquired all clinical data. K.E.E. and A.B. performed the Matlab simulations. K.E.E., K.M., A.B., C.T.F., D.J., R.J.H.B., B.R.R., R.K.J. and A.G.S. analyzed and interpreted the simulations and human data. K.E.E. performed the statistical analysis. K.E.E., K.M., A.B., C.T.F., D.J., R.J.H.B., P.Y.W., P.I., T.T.B., B.R.R., R.K.J. and A.G.S. revised the manuscript critically. K.E.E., K.M., A.B., C.T.F., D.J., R.J.H.B., P.Y.W., P.I., T.T.B., B.R.R., R.K.J. and A.G.S. approved the final version of the manuscript.
CONFLICTS OF INTERESTS
KEE: Licensed patents: NordicNeuroLab AS.
KM: No potential conflicts of interest
AB: Board member: NordicNeuroLab AS. Licensed patents: NordicNeuroLab AS.
CTF: No potential conflicts of interest
DJ: No potential conflicts of interest
RJHB: No potential conflicts of interest
PYW: Research Support: Merck, Sanofi-Aventis, Genentech, Novartis, Medimmune, AstraZeneca, Amgen, Vascular Biogenics, Genzyme
PI: No potential conflicts of interest
TTB: Consultant/Advisory boards: Merck & Co., Inc., Roche, Kirin Pharmaceuticals, Champions Biotechnology, Advance Medical. Grant support: Pfizer, Astra Zeneca, Millenium
BR: Consultant/Advisory Board: Siemens Medical
RKJ: Grant support: Dyax, MedImmune, Roche. Consultant/Advisory boards: Dyax, Noxxon Pharma, SynDevRx. Equity and Board of Directors: Xtuit.
AGS: CEO, Siemens HealthCare USA. Grant support: Sanofi-aventis, Exelixis, Inc, Schering-Plough, Takeda Pharmaceutical Company Limited. Consultant/Advisory boards: Sanofi-aventis, Bayer AG, Mitsubishi, Biogen Idec Inc.
References
- 1.Carmeliet P, Jain RK. Molecular mechanisms and clinical applications of angiogenesis. Nature. 2011;473:298–307. doi: 10.1038/nature10144. [DOI] [PMC free article] [PubMed] [Google Scholar]
- 2.Goel S, et al. Normalization of the vasculature for treatment of cancer and other diseases. Physiological Reviews. 2011;91:1071–1121. doi: 10.1152/physrev.00038.2010. [DOI] [PMC free article] [PubMed] [Google Scholar]
- 3.Willett CG, et al. Direct evidence that the VEGF-specific antibody bevacizumab has antivascular effects in human rectal cancer. Nat Med. 2004;10:145–147. doi: 10.1038/nm988. [DOI] [PMC free article] [PubMed] [Google Scholar]
- 4.Batchelor TT, et al. AZD2171, a pan-VEGF receptor tyrosine kinase inhibitor, normalizes tumor vasculature and alleviates edema in glioblastoma patients. Cancer Cell. 2007;11:83–95. doi: 10.1016/j.ccr.2006.11.021. [DOI] [PMC free article] [PubMed] [Google Scholar]
- 5.Sorensen AG, et al. Increased Survival of Glioblastoma Patients Who Respond to Antiangiogenic Therapy with Elevated Blood Perfusion. Cancer Res. 2012;72:402–407. doi: 10.1158/0008-5472.CAN-11-2464. [DOI] [PMC free article] [PubMed] [Google Scholar]
- 6.Dennie J, et al. NMR imaging of changes in vascular morphology due to tumor angiogenesis. Magn Reson Med. 1998;40:793–799. doi: 10.1002/mrm.1910400602. [DOI] [PubMed] [Google Scholar]
- 7.Boxerman JL, Hamberg LM, Rosen BR, Weisskoff RM. MR contrast due to intravascular magnetic susceptibility perturbations. Magn Reson Med. 1995;34:555–566. doi: 10.1002/mrm.1910340412. [DOI] [PubMed] [Google Scholar]
- 8.Weisskoff RM, Zuo CS, Boxerman JL, Rosen BR. Microscopic susceptibility variation and transverse relaxation: theory and experiment. Magn Reson Med. 1994;31:601–610. doi: 10.1002/mrm.1910310605. [DOI] [PubMed] [Google Scholar]
- 9.Kiselev VG, Strecker R, Ziyeh S, Speck O, Hennig J. Vessel size imaging in humans. Magn Reson Med. 2005;53:553–563. doi: 10.1002/mrm.20383. [DOI] [PubMed] [Google Scholar]
- 10.Kennan RP, Zhong J, Gore JC. Intravascular susceptibility contrast mechanisms in tissues. Magn Reson Med. 1994;31:9–21. doi: 10.1002/mrm.1910310103. [DOI] [PubMed] [Google Scholar]
- 11.Fisel CR, et al. MR contrast due to microscopically heterogeneous magnetic susceptibility: numerical simulations and applications to cerebral physiology. Magn Reson Med. 1991;17:336–347. doi: 10.1002/mrm.1910170206. [DOI] [PubMed] [Google Scholar]
- 12.Beaumont M, et al. Characterization of tumor angiogenesis in rat brain using iron-based vessel size index MRI in combination with gadolinium-based dynamic contrast-enhanced MRI. J Cereb Blood Flow Metab. 2009;29:1714–1726. doi: 10.1038/jcbfm.2009.86. [DOI] [PMC free article] [PubMed] [Google Scholar]
- 13.Schmainda KM, et al. Characterization of a first-pass gradient-echo spin-echo method to predict brain tumor grade and angiogenesis. AJNR Am J Neuroradiol. 2004;25:1524–1532. [PMC free article] [PubMed] [Google Scholar]
- 14.Weisskoff RM, Chesler D, Boxerman JL, Rosen BR. Pitfalls in MR measurement of tissue blood flow with intravascular tracers: which mean transit time? Magn Reson Med. 1993;29:553–558. doi: 10.1002/mrm.1910290420. [DOI] [PubMed] [Google Scholar]
- 15.Tsai AG, Johnson PC, Intaglietta M. Oxygen gradients in the microcirculation. Physiol Rev. 2003;83:933–963. doi: 10.1152/physrev.00034.2002. [DOI] [PubMed] [Google Scholar]
- 16.Sharan M, Jones MD, Jr, Koehler RC, Traystman RJ, Popel AS. A compartmental model for oxygen transport in brain microcirculation. Ann Biomed Eng. 1989;17:13–38. doi: 10.1007/BF02364271. [DOI] [PubMed] [Google Scholar]
- 17.Batchelor TT, et al. Phase II study of cediranib, an oral pan-vascular endothelial growth factor receptor tyrosine kinase inhibitor, in patients with recurrent glioblastoma. J Clin Oncol. 2010;28:2817–2823. doi: 10.1200/JCO.2009.26.3988. [DOI] [PMC free article] [PubMed] [Google Scholar]
- 18.Less JR, Skalak TC, Sevick EM, Jain RK. Microvascular architecture in a mammary carcinoma: branching patterns and vessel dimensions. Cancer Res. 1991;51:265–273. [PubMed] [Google Scholar]
- 19.Helmlinger G, Yuan F, Dellian M, Jain RK. Interstitial pH and pO2 gradients in solid tumors in vivo: high-resolution measurements reveal a lack of correlation. Nat Med. 1997;3:177–182. doi: 10.1038/nm0297-177. [DOI] [PubMed] [Google Scholar]
- 20.Wilson WR, Hay MP. Targeting hypoxia in cancer therapy. Nat Rev Cancer. 2011;11:393–410. doi: 10.1038/nrc3064. [DOI] [PubMed] [Google Scholar]
- 21.Dvorak HF, Brown LF, Detmar M, Dvorak AM. Vascular permeability factor/vascular endothelial growth factor, microvascular hyperpermeability, and angiogenesis. Am J Pathol. 1995;146:1029–1039. [PMC free article] [PubMed] [Google Scholar]
- 22.Stylianopoulos T, et al. Causes, consequences, and remedies for growth-induced solid stress in murine and human tumors. Proc Natl Acad Sci U S A. 2012;109:15101–15108. doi: 10.1073/pnas.1213353109. [DOI] [PMC free article] [PubMed] [Google Scholar]
- 23.Pries AR, Hopfner M, le Noble F, Dewhirst MW, Secomb TW. The shunt problem: control of functional shunting in normal and tumour vasculature. Nat Rev Cancer. 2010;10:587–593. doi: 10.1038/nrc2895. [DOI] [PMC free article] [PubMed] [Google Scholar]
- 24.Bulnes S, Bilbao J, Lafuente JV. Microvascular adaptive changes in experimental endogenous brain gliomas. Histol Histopathol. 2009;24:693–706. doi: 10.14670/HH-24.693. [DOI] [PubMed] [Google Scholar]
- 25.Zwick S, et al. Assessment of vascular remodeling under antiangiogenic therapy using DCE-MRI and vessel size imaging. J Magn Reson Imaging. 2009;29:1125–1133. doi: 10.1002/jmri.21710. [DOI] [PubMed] [Google Scholar]
- 26.Kamoun WS, et al. Edema control by cediranib, a vascular endothelial growth factor receptor-targeted kinase inhibitor, prolongs survival despite persistent brain tumor growth in mice. J Clin Oncol. 2009;27:2542–2552. doi: 10.1200/JCO.2008.19.9356. [DOI] [PMC free article] [PubMed] [Google Scholar]
- 27.Huang Y, et al. Vascular normalizing doses of antiangiogenic treatment reprogram the immunosuppressive tumor microenvironment and enhance immunotherapy. Proc Natl Acad Sci U S A. 2012;109:17561–17566. doi: 10.1073/pnas.1215397109. [DOI] [PMC free article] [PubMed] [Google Scholar]
- 28.Bjornerud A, Briley-Saebo K, Johansson LO, Kellar KE. Effect of NC100150 injection on the (1)H NMR linewidth of human whole blood ex vivo: dependency on blood oxygen tension. Magn Reson Med. 2000;44:803–807. doi: 10.1002/1522-2594(200011)44:5<803::aid-mrm19>3.0.co;2-k. [DOI] [PubMed] [Google Scholar]
- 29.Thulborn KR, Waterton JC, Matthews PM, Radda GK. Oxygenation dependence of the transverse relaxation time of water protons in whole blood at high field. Biochim Biophys Acta. 1982;714:265–270. doi: 10.1016/0304-4165(82)90333-6. [DOI] [PubMed] [Google Scholar]
- 30.Larsen OA, Lassen NA. Cerebral hematocrit in normal man. J Appl Physiol. 1964;19:571–574. doi: 10.1152/jappl.1964.19.4.571. [DOI] [PubMed] [Google Scholar]
- 31.Yuan F, et al. Vascular permeability and microcirculation of gliomas and mammary carcinomas transplanted in rat and mouse cranial windows. Cancer Res. 1994;54:4564–4568. [PubMed] [Google Scholar]
- 32.Duvernoy H, Delon S, Vannson JL. The vascularization of the human cerebellar cortex. Brain Res Bull. 1983;11:419–480. doi: 10.1016/0361-9230(83)90116-8. [DOI] [PubMed] [Google Scholar]
- 33.Barboriak DP, MacFall JR, Viglianti BL, Dewhirst Dvm MW. Comparison of three physiologically-based pharmacokinetic models for the prediction of contrast agent distribution measured by dynamic MR imaging. J Magn Reson Imaging. 2008;27:1388–1398. doi: 10.1002/jmri.21344. [DOI] [PMC free article] [PubMed] [Google Scholar]
- 34.Jensen JH, Chandra R. MR imaging of microvasculature. Magn Reson Med. 2000;44:224–230. doi: 10.1002/1522-2594(200008)44:2<224::aid-mrm9>3.0.co;2-m. [DOI] [PubMed] [Google Scholar]
- 35.Macdonald DR, Cascino TL, Schold SC, Jr, Cairncross JG. Response criteria for phase II studies of supratentorial malignant glioma. J Clin Oncol. 1990;8:1277–1280. doi: 10.1200/JCO.1990.8.7.1277. [DOI] [PubMed] [Google Scholar]
- 36.Bjornerud A, Emblem KE. A fully automated method for quantitative cerebral hemodynamic analysis using DSC-MRI. J Cereb Blood Flow Metab. 2010;30:1066–1078. doi: 10.1038/jcbfm.2010.4. [DOI] [PMC free article] [PubMed] [Google Scholar]
Associated Data
This section collects any data citations, data availability statements, or supplementary materials included in this article.