

Abstract
High resolution electron microscopy has been applied to study the structure of metallic nanoparticles. These have sparked considerable interest as contrast agents in the field of biological imaging, including in magnetic resonance imaging (MRI) and computed tomography (CT). Here, we describe a method of synthesizing sub-10nm superparamagnetic metal and alloy nanoparticles by reduction of metallic salts. Annealing at 900°C in a methane/hydrogen environment forms a thin graphitic-carbon shell which is expected to improve stability, biocompatibility, and functionalization. Subsequent high resolution electron microscopy verifies graphitization and allows for crystallographic analysis. Most particles consist of single crystals in the phase predicted for the bulk material at the annealing temperature. Electron energy loss spectroscopy, energy dispersive X-ray spectroscopy and lattice constant measurements show large variation in composition for alloy nanoparticles from a single synthesis. The magnetization relaxation time (T2) measurements demonstrate that Fe and AuFe nanoparticles compete with commercially available iron oxide MRI contrast agents. X-ray attenuation measurements of an AuFe alloy nanoparticle solution gave a relative radiodensity of 280 Hounsfield Units, demonstrating promise as a dual-purpose contrast agent in CT and MRI. Long term stability in an atmospheric environment was also tested, with no signs of corrosion or oxidation after several years of storage.
Keywords: Metallic nanoparticles, HREM, Computed tomography, Magnetic resonance imaging
1. Introduction
There are increasing possibilities for the application of nano-particles for medical applications such as cancer detection or therapy [1–4]. Important means of locating nano-materials associated with tumors or circulating tumor cells (CTC’s) include magnetic sifting [5] and surface enhanced Raman spectroscopic imaging [6]. For the former, iron oxide particles provide the primary source owing to their good magnetic properties, stability, and low toxicity. In this study, we consider ferromagnetic metallic nanoparticles as possible alternatives. On the one hand their magnetic properties can be superior to those of iron oxides, but on the other their stability in vivo and their likely toxicity effects have not yet been exhaustively studied.
In order to address the latter concerns, we have synthesized the nanoparticles by a process which includes a final step to encapsulate them with a protective graphitic carbon coating. This is a modification of a scheme to produce carbon nanotubes [7]. The small particle diameters are designed to ensure that they are in the superparamagnetic size range to avoid magnetic interactions between them. To characterize both their structure and the degree of graphitization, only high resolution transmission electron microscopy (HREM) is applicable, and this paper therefore describes the results which have been obtained [8–10].
2. Experimental procedures
2.1 Sample synthesis and preparation
The nanoparticles are fabricated by reduction of a suitable metallic salt, often a nitrate, which has been dispersed on a high surface area medium. The graphitization is carried out by a modification of a process from growing carbon nanotubes, by heating in a methane hydrogen mixture at 900°C[7–10].
The procedure for iron nanoparticles is as follows. Fumed silica is impregnated with a solution of Fe(NO3)3 in methanol. The material is placed in a glass vial and sonicated. Next, the vial is heated on a hot plate to evaporate the solvent. The remaining solid is ground using a mortar and pestle. The powder is inserted into a tube furnace for reduction and for chemical vapor deposition of carbon. A mixture of methane and hydrogen gas is flowed through the tube for 1 minute to purge the atmosphere in the furnace. The furnace is ramped to 900°C in about 14 minutes, while flowing H2 at a rate of 500 standard cubic centimeters per minute (SCCM). Once heated, 500 SCCM each of H2 and CH4 are flowed through the tube for 10 minutes. The CH4 gas flow is turned off and cooling is performed in a hydrogen atmosphere over about 15 minutes. The resulting material is put into a solution of HF and allowed to soak overnight to etch away the fumed silica. Finally, the nanoparticles are centrifuged and washed several times to remove the etching solution.
For cobalt nanoparticles the process is the same, using Co(NO3)2 as a starting solution. Fe-Co alloys were produced using a 1:1 ratio of the same two precursors. For Au-Fe alloys HAuCl4 and Fe(NO3)3 were used in a variety of ratios.
Specimens for HREM are made by suspending the samples in a solution of water and phospholipids via sonication for 1 hour. The suspension is dropped onto a holey carbon TEM grid (Ted Pella PELCO© 200 mesh copper) and allowed to air dry. Further details regarding synthesis and characterization can be found in [8–10].
2.2 Characterization
The HREM was largely carried out at facilities at the National Center for Electron Microscopy (NCEM), and most of the images presented here were obtained on the Philips CM30/FEG/UT (Cs=0.6mm, Cc=1.2mm, λ=1.97pm). The nanoparticle array was examined for particles close to a low index zone axis, which were then chosen for high resolution imaging. While this only provides a statistically small number of particles for examination within a reasonable observation time, it does ensure the ability to identify the particle structure and the extent of graphite encapsulation.
Composition analysis of alloy nanoparticles was carried out by standard X-ray energy dispersive or electron energy loss spectroscopy (EELS) methods. EDS was performed on a Philips CM200 at 200 keV, using gun lens 5, spot size 4, C1 aperture 2 and C2 aperture 4, while EELS measurements were taken using a Gatan image filter on the Libra microscope, both at NCEM. EDS quantification was performed using the Cliff-Lorimer equation kA*CA/kB*CB=IA/IB, where k is an efficiency factor, C is the concentration, and I is the intensity for two species A and B. The k factors were taken from ES Vision™ software using known standards. The same TEM conditions and analysis were used for the standards and the samples. EELS quantification was performed in DigitalMicrograph™ and using the standard equation CA/CB=(IA(β,Δ)σB(β,Δ))/(IB(β,Δ)σA(β,Δ)), where β is the collection semiangle of the spectrometer, Δ is the peak integration width, and σ is the cross section, calculated using theory based on the Hartree-Slater model. [11]
Magnetic measurements were performed by a superconducting quantum interference device (SQUID). The device measures the magnetic flux through a superconducting ring by tracking voltage changes. The work in this paper was carried out using a Quantum Design MPMS-XP direct current SQUID.
Zero field cooling (ZFC) and field cooling (FC) tests were performed in the SQUID. In the first, the samples are cooled to 2 K without the presence of a magnetic field. A 1000 Oe field is applied and the net magnetization of the sample is measured during a slow (1 K/min) warming back to room temperature. FC monitors magnetization during another cooling step, this time under a 1000 Oe field.
In Magnetic Resonance Imaging (MRI), a magnetic field is applied to a patient in a direction Z and a radio frequency pulse is applied to change the net magnetization to a direction orthogonal to the applied field. The T1 value of a material describes the rate at which the magnetization reverts to the Z direction after the pulse, while T2 describes the demagnetization rate in the orthogonal direction. Samples for MRI tests were generated by suspending the nanoparticles in a solution of 0.1mg/mL phospholipids in water and sonicating for 30 minutes. The sample was placed in a 1.5 Tesla MRI machine at the Magnetic Resonance System Research Laboratory at Stanford University. Spin echo pulsing with inversion was applied, and the signal vs time plot fitted to exponential curves to find the T1 and T2 parameters.
X-ray attenuation coefficients of solutions were measured to evaluate the applicability of the Au-Fe particles as contrast agents for computer tomography (CT) scanning. CT scans are a reconstruction using a series of X-ray images of the body. Contrast can be improved by adding materials that strongly attenuate X-rays to the material of interest. The results are in Hounsfield Units, defined as HU=1000*[(μ−μw)/μw]where μ is the attenuation coefficient of the sample and μw is the attenuation coefficient of water. Measurements were taken by placing samples in a CT scanner and measuring the intensity of the transmitted X-ray signal.
3. Experimental results
The nanoparticles studied here were elemental iron and cobalt, and Fe-Co and Au-Fe alloys. A comparison of the bulk saturation magnetizations compared to iron oxide is shown in Table 1, indicating that the properties of metallic materials can be superior.
Table 1.
Saturation magnetizations for various bulk materials. Note that iron oxide has a lower saturation magnetization than the metals and alloys listed.
| Material | Bulk Saturation Magnetization (emu/cc) |
|---|---|
| γ-Fe2O3 | 340 |
| Fe3O4 | 420 |
| FePt | 1140 |
| Co | 1422 |
| Fe | 1714 |
| CoFe | 1950 |
3.1 Iron nanoparticles
Figure 1a shows a bright field image of the iron nanoparticles, whereby it can be seen that they are in the 4–11nm size range (Fig. 1b). The graphite encapsulation is readily seen using a TEM defocus condition to bring out the graphite basal planar spacings (0.335nm) in the images (e.g. Fig 2). The magnetic hysteresis plot (Fig. 3a) is consistent with the particles being superparamagnetic i.e. a ferromagnetic saturation magnetization with effectively zero remanent magnetization and therefore no hysteresis. The saturation magnetization was measured to be 23% that of bulk iron, possibly due to the small size and FCC structure of some of the particles. Likewise the zero field cooling curves (Fig. 4a) are consistent with superparamagnetic behavior. In zero field cooling, the magnetization increases initially with increasing temperature. This corresponds with the nanoparticles becoming free to align their magnetic domains with the magnetic field. Above the blocking temperature (106 K), further increase in the temperature results in decreasing net magnetization as entropic effects in small particles compete with their ferromagnetic alignment. Field cooling results in monotonic increase in magnetization as temperature decreases and the nanoparticles gradually align with the applied field.
Figure 1.

Bright field TEM image (a) of synthesized Fe-C core-shell nanoparticles and size distribution (b) of 100 particles.
Figure 2.

HREM image of an iron nanoparticle in non-diffracting conditions encapsulated by 12 layers of graphite.
Figure 3.

Magnetic hysteresis curves for the nanoparticles at 300K measured using SQUID. (a) iron (b) cobalt (c) Au.67Fe.33. There is no remnant magnetization at zero applied field.
Figure 4.

Zero field cooling and field cooling curves for (a) Fe (b) Co (c) Au.67Fe.33. The peak in magnetization at the blocking temperature in the ZFC plot verifies the nanoparticles are superparamagnetic. The blocking temperatures are 106, 21, and 79 K respectively. Applied field is 1000Oe.
Because of the annealing temperatures and carbonaceous environment involved, it is of course of metallurgical interest as to the nature of the phase of the iron nanoparticles, i.e. FCC or BCC. In fact both phases were found in the HREM images. With a study of 15 nanoparticles in a zone axis orientation, ten were FCC particles, four were BCC particles, and one was a Fe3C particle. Thus in Fig. 5a a nanoparticle in the FCC [110] zone axis orientation is easily identifiable, as is a BCC nanoparticle in the [111] orientation in Fig. 5b. The interplanar spacings and interplanar angles are sufficient for the phase identification, and the close proximity of patches of graphite throughout the TEM samples provides an abundant supply of material for exact magnification calibration. While BCC is the stable phase in bulk iron at room temperature, the small size of FCC nanoparticles and their carbon content is likely to preclude any phase transformation on cooling from the annealing temperature.
Figure 5.
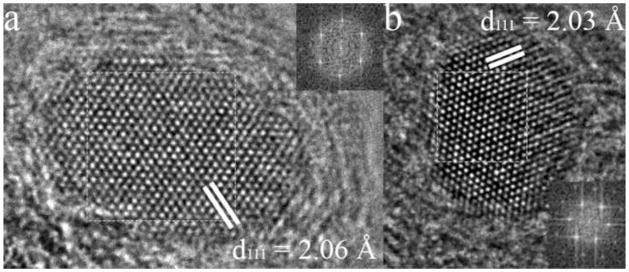
(a) HREM of a FCC Fe nanoparticle in a [110] zone axis orientation. (b) HREM of a BCC Fe nanoparticle in the [111] zone axis orientation showing the three sets of {110} planes at 60°. Inset are the FFT’s of the images.
The graphite encapsulation of the majority of the nanoparticles is more typically in the range of one to four graphite basal planes thick. The graphite is often not always clear as the defocus condition is normally optimized for the metallic crystal spacings which are smaller and there is the background amorphous carbon layer.
On occasion much larger particles were found (eg Fig. 6) which cannot be indexed as a cubic phase. In this particular case the prominent interplanar spacings and angles are consistent with the [ ] zone axis of cementite (Fe3C) which can also be expected as a product of the synthesis process. Cementite is formed for instance by reaction of iron with amorphous carbon thin films at 500°C [12]. Figure 7 also shows an interesting result whereby about half of a FCC nanoparticle exhibits HCP stacking. The HCP phase of iron has long been speculated upon, but this is the only observation that we made of any HCP particles.
Figure 6.

HREM image of a larger nanoparticle which is consistent with the [ ] zone axis of cementite (Fe3C) showing the prominent (110), (102) and (212) planes. Inset is the Fourier transform of the image.
Figure 7.

HREM image of a partially FCC Fe nanoparticle (a) showing HCP stacking of the close packed planes, magnified in (b).
3.2 Cobalt nanoparticles
The cobalt nanoparticles prepared by the present process also exhibit superparamagnetic behavior with a blocking temperature of 21 K (Figs. 3b and 4b). They are similar in size to the iron nanoparticles, are similarly encapsulated (Fig 8a) and they exclusively have the FCC structure (Fig. 8b) which is the bulk high temperature form of Co. No HCP structure nanoparticles were found although this is the stable bulk phase at room temperature and is easily formed as nano-scale crystals in sputter-deposited thin films [13]. Encapsulation is not clearly visible in Figure 8b for the reasons given above.
Figure 8.
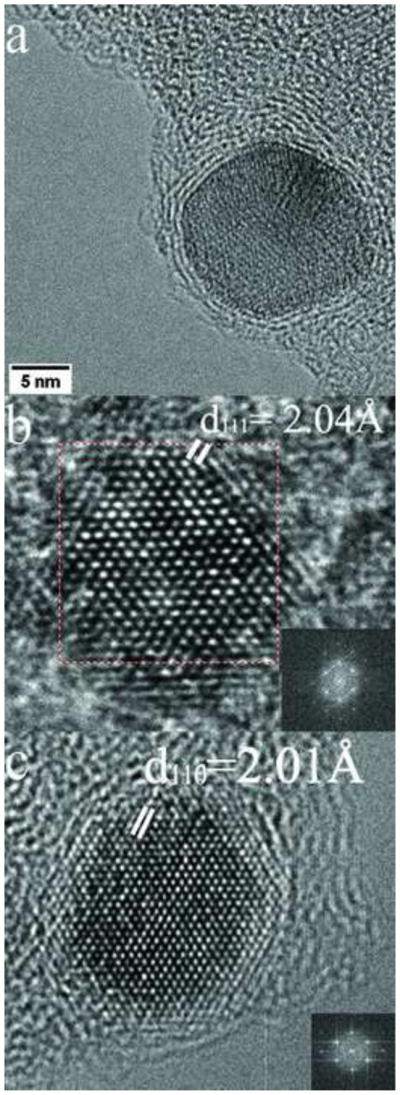
(a) HREM of a Co nanoparticle optimized to show graphite encapsulation (b) HREM image of a Co nanoparticle illustrating their FCC structure in the [110] orientation. (c) HREM of a Fe-Co nanoparticle which is BCC in the [111] orientation.
3.3 Fe-Co alloy nanoparticles
As can be seen in Table 1, certain compositions of iron-cobalt alloys have noticeably higher saturation magnetization compared to their elements and to iron oxide. We aimed for a composition of 50% by mixing the appropriate proportions of the source nitrates. At this composition and annealing temperature the structure expected from the phase diagram is BCC, and that is what is found in the HREM images (Fig 8c), again with a few planes of graphite encapsulation. Because of the somewhat heterogeneous nature of the synthesis process, it is also of interest to establish to what extent the nanoparticles are indeed alloys, or a mixture of separate iron and cobalt particles. The compositions of over 100 individual particles were determined by EELS (eg Fig. 9) and the results are shown in Fig. 10a. It can been seen that the nanoparticles do contain both elements, that the average composition is close to that aimed for, and that there is a wide range of compositions (10% to 60%) from one particle to another. Thus the properties are not optimized in the mixture because of the compositional range.
Figure 9.

Electron energy loss spectra of a FeCo-C nanoparticle showing the carbon, iron, and cobalt K-edges (a) and the quantification of composition (b).
Figure 10.

Composition variations from one nanoparticle to another (a) Fe-Co particles measured by EELS (b) Fe-Au particles measured by X-ray EDS.
3.4 Au-Fe nanoparticles
Finally it was thought to be interesting to examine alloy nanoparticles containing a heavy element (in this case gold) to provide an additional functionality for computer tomography (CT) scans. The chosen composition was 67% Au, again by appropriate mixing of the salts.
The magnetic hysteresis loops (Fig. 3c) also demonstrate superparamagnetism, albeit with much lower saturation magnetizations than that for the pure iron particles. However, the magnetization levels per unit mass of iron are reasonably close (53.2 emu/g for pure iron, 49.6 emu/g Fe for the Au-Fe particles). The blocking temperature was measured at 79 K by ZFC measurements (Fig 4c). Individual particle compositions were determined by X-ray energy dispersive spectroscopy (Fig 11) and once again a broad range of compositions is shown, with the average close to that targeted (Fig. 10b).
Figure 11.

X-ray energy dispersive spectrum of a AuFe-C nanoparticle. Quantification was carried out using the FeK® and AuL® peaks.
The HREM images (eg Fig. 12) show high quality FCC structure again with a few layers of graphitization. This is also expected from the bulk phase diagram at the annealing temperature. We did not observe particles with internal twinning which is characteristic of pure gold nanoparticles. Again using nearby graphite fringes as a calibration standard, we measured both the average interplanar spacings of individual particles and any variation within them (there was none). For the particle shown in Fig. 12c, the lattice parameter was measured to be 0.391nm, between that of FCC Au (0.408nm) and FCC Fe (0.351nm). By reference to the variation of lattice parameter in the Au-Fe system ([14] Fig. 13) this corresponds to a composition of 53% confirming the alloy nature of the nanoparticle.
Figure 12.
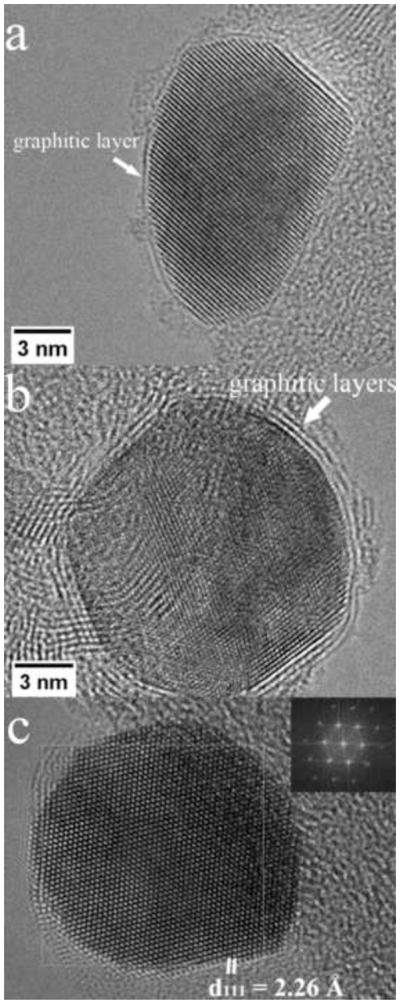
(a,b) HREM of AuFe nanoparticles optimized for imaging of graphite layers. (c) HREM of an FCC AuFe nanoparticle in the [110] zone axis showing two {111} type planes and a {002} type plane.
Figure 13.

Lattice parameter as a function of composition for the bulk Au-Fe system as measured by X-ray diffraction [11].
We determined also the CT number of a solution of these nanoparticles and found it to be 280 Hounsfield Units compared to 250 and 570 for commercially available barium and iodine contrast agents respectively. The T1 and T2 parameters are not so different from those of iron oxide Feridex® colloids currently in clinical use, with the pure Fe particles reducing T2 values to below that of Feridex in equal concentrations (Fig 14). While our Au-Fe particles have slightly higher T2 values, the properties are reasonable for bimodal CT/MRI imaging.
Figure 14.

Plot of T2 values at various concentrations for Fe, AuFe, and commercially available iron oxide Feridex MRI contrast agent. Higher T2 results in higher contrast in MRI images.
3.5 Nano-particle stability
One of the major objectives of this research was to provide chemical stability to the metallic nanoparticles. For instance, it is known that the magnetic properties of uncoated Au-Fe nanoparticles degrade noticeably within a day [15]. Figure 15a-d shows HREM images of individual particles which had been stored on the laboratory bench for periods up to three years. The crystal structure and metallic phases show no degradation from those of the initial particles, with no evidence whatsoever of oxidation or corrosion.
Figure 15.

HREM images of the nanoparticles after storage on the laboratory bench (a) Fe-C after three years (b) Co-C after 3 years (c) FeCo-C after three years (d) AuFe-C after two years. Note that the (111) interplanar spacing of the latter is different from that in Fig. 12(c) likely due to a lower Au content.
Discussion
There are several major findings in this paper. Firstly metallic, ferromagnetic nanoparticles can be synthesized in the 10nm or so size range so that they exhibit superparamagnetic properties, by reduction of their nitrate salts. These nanoparticles can be encapsulated with a few layers of graphitic carbon by annealing them at about 900°C in a methane/hydrogen gas mixture. The graphite coating renders the particles to be stable under atmospheric conditions at room temperature.
High resolution electron microscopy has been invaluable to the structural evaluation of the nanoparticles. They have good single crystal quality and the phases created are consistent with those expected from the bulk phase diagrams at the annealing temperature. Although both Fe and Co exhibit different phases at room temperature, there is no mechanism for their transformation on cooling and so it is presumed that the phases at high temperature are retained. The case of the iron nanoparticles is arguably the most interesting, as both FCC and BCC structures are found, perhaps because the heat treatment is carried out at the FCC plus BCC two phase region in the Fe-C phase diagram. Alloy nanoparticles can also be synthesized, although in this procedure a broad composition range is achieved rather than the singular composition targeted by the relative salt proportions in the original mixture. There are other TEM methods to analyze the nanoparticle structures, but none that can simultaneously show the presence of the graphite encapsulation with the crystal structure of individual nanoparticles.
This study has not gone further in terms of examining to what extent the nanoparticles can be functionalized biologically so that they can be attached to specific tumors or cancer cells. However with their graphite encapsulation, it is anticipated that they would be stable in vivo and in vitro. The magnetic properties measured here certainly are sufficiently good that they could replace iron oxide in magnetic sifting devices. These avenues are all worth pursuing in future work.
Conclusions
High resolution electron microscopy has been used to establish the crystal structures and degree of graphite encapsulation of Fe, Co, Fe-Co and Au-Fe nanoparticles fabricated by reduction of their nitrate salts in a CH4/H2 atmosphere.
The magnetic properties of these nanoparticles can be made to be superior to those of conventional magnetic iron oxide nanoparticles which are conventionally used in medical applications.
The graphite encapsulated nanoparticles have long-term stability in an atmospheric environment, showing no oxidation or corrosion.
Highlights.
Fe, Co, Fe-Co and Au-Fe nanoparticles were made by annealing their salts in CH4/H2
High resolution TEM has determined crystal structures and graphite layer thickness
Particles can be superior to iron oxide particles currently in use for MRI contrast
Particles can provide similar CT numbers to clinically used barium contrast agents
The graphite encapsulated particles show no oxidation or corrosion in atmosphere.
Acknowledgments
It is a distinct pleasure to dedicate this paper to our colleagues David J. Smith, W. Owen Saxton, and Dirk van Dyck who have provided inspirational leadership in high resolution electron microscopy throughout their careers. One of us (Robert Sinclair) would like particularly to thank David J. Smith for many stimulating discussion since our first collaboration in 1981.
He Li carried out the HREM imaging and analysis. The bulk of this work was performed at NCEM, which is supported by the Office of Science, Office of Basic Energy Sciences of the U.S. Department of Energy under Contract No. DE-AC02—05CH11231. He Li’s mentor at the NCEM was Dr. Velimir Radmilovic who provided significant guidance and advice. We thank Professor Martin Greven for access to his equipment for magnetic measurements. CT number measurements were taken using a CT scanner at the Stanford Medical School. This research was funded by the National Cancer Institute under the initial Stanford University CCNE-TR grant funded by NCI-NIH to Stanford University U54CA151459 led by Dr. Sam Gambhir whose support is much appreciated.
Footnotes
Publisher's Disclaimer: This is a PDF file of an unedited manuscript that has been accepted for publication. As a service to our customers we are providing this early version of the manuscript. The manuscript will undergo copyediting, typesetting, and review of the resulting proof before it is published in its final citable form. Please note that during the production process errors may be discovered which could affect the content, and all legal disclaimers that apply to the journal pertain.
References
- 1.Ferrari M. Cancer nanotechnology: opportunities and challenges. Nat Rev Cancer. 2005;5:161–171. doi: 10.1038/nrc1566. [DOI] [PubMed] [Google Scholar]
- 2.Farrell D, Alper J, Ptak K, Panaro NJ, Grodzinski P, Barker AD. Recent Advances from the National Cancer Institute Alliance for Nanotechnology in Cancer. ACS Nano. 2010;4:589–594. doi: 10.1021/nn100073g. [DOI] [PubMed] [Google Scholar]
- 3.Nie S, Xing Y, Kim GJ, Simons JW. Nanotechnology Applications in Cancer. Annual Review of Biomedical Engineering. 2007;9:257–288. doi: 10.1146/annurev.bioeng.9.060906.152025. [DOI] [PubMed] [Google Scholar]
- 4.Cuenca AG, Jiang H, Hochwald SN, Delano M, Cance WG, Grobmyer SR. Emerging implications of nanotechnology on cancer diagnostics and therapeutics. Cancer. 2006;107:459–466. doi: 10.1002/cncr.22035. [DOI] [PubMed] [Google Scholar]
- 5.Earhart CM, Wilson RJ, White RL, Pourmand N, Wang SX. Microfabricated magnetic sifter for high-throughput and high-gradient magnetic separation. Journal of Magnetism and Magnetic Materials. 2009;321:1436–1439. doi: 10.1016/j.jmmm.2009.02.062. [DOI] [PMC free article] [PubMed] [Google Scholar]
- 6.Keren S, Zavaleta C, Cheng Z, de la Zerda A, Gheysens O, Gambhir SS. Noninvasive molecular imaging of small living subjects using Raman spectroscopy. Proceedings of the National Academy of Sciences. 2008;105:5844–5849. doi: 10.1073/pnas.0710575105. [DOI] [PMC free article] [PubMed] [Google Scholar]
- 7.Kong J, Cassell AM, Dai H. Chemical vapor deposition of methane for single-walled carbon nanotubes. Chemical Physics Letters. 1998;292:567–574. [Google Scholar]
- 8.Li H. Materials Science and Engineering. Stanford University; Stanford, CA: 2008. Synthesis and characterization of metal-carbon core-shell nanoparticles; p. 138. [Google Scholar]
- 9.Li H, Dai H, Sinclair R. Synthesis and Characterization of Fe-C Core-shell Nanoparticles. Microsc Micronal. 2005;11:1902–1903. [Google Scholar]
- 10.Li H, Dai H, Xing L, Sinclair R. Characterization of AuFe-C Core-shell Nanoparticles. Microsc Micronal. 2006;12:524–525. [Google Scholar]
- 11.Williams DB, Carter CB. Transmission Electron Microscopy. 2. Springer; New York: 2009. pp. 639–660.pp. 715–737. [Google Scholar]
- 12.Sinclair R, Itoh T, Chin R. In Situ TEM Studies of Metal–Carbon Reactions. Microscopy and Microanalysis. 2002;8:288–304. doi: 10.1017/s1431927602020226. [DOI] [PubMed] [Google Scholar]
- 13.Hossein-Babaei F, Sinclair R, Srinivasan K, Bertero GA. Scanning Transmission Electron Microscopy Analysis of Grain Structure in Perpendicular Magnetic Recording Media. Nano Letters. 2011;11:3751–3754. doi: 10.1021/nl201784z. [DOI] [PubMed] [Google Scholar]
- 14.Raub PWE, Metallkd Z. 1950;41:234. [Google Scholar]
- 15.Cho SJ, Idrobo JC, Olamit J, Liu K, Browning ND, Kauzlarich SM. Growth Mechanisms and Oxidation Resistance of Gold-Coated Iron Nanoparticles. Chemistry of Materials. 2005;17:3181–3186. [Google Scholar]