

Abstract
Aim(s)
This study assessed the effect of differences in renal function on the pharmacokinetics and pharmacodynamics of dapagliflozin, a renal sodium glucose co-transporter-2 (SGLT2) inhibitor for the treatment of type 2 diabetes mellitus (T2DM).
Methods
A single 50 mg dose of dapagliflozin was used to assess pharmacokinetics and pharmacodynamics in five groups: healthy non-diabetic subjects; patients with T2DM and normal kidney function and patients with T2DM and mild, moderate or severe renal impairment based on estimated creatinine clearance. Subsequently, 20 mg once daily multiple doses of dapagliflozin were evaluated in the patients with T2DM. Formation rates of dapagliflozin 3-O-glucuronide (D3OG), an inactive metabolite, were evaluated using human isolated kidney and liver microsomes.
Results
Plasma concentrations of dapagliflozin and D3OG were incrementally increased with declining kidney function. Steady-state Cmax for dapagliflozin were 4%, 6% and 9% higher and for D3OG were 20%, 37% and 52% higher in patients with mild, moderate and severe renal impairment, respectively, compared with normal function. AUC(0,τ) was likewise higher. D3OG formation in kidney microsomes was three-fold higher than in liver microsomes and 109-fold higher than in intestine microsomes. Compared with patients with normal renal function, pharmacodynamic effects were attenuated with renal impairment. Steady-state renal glucose clearance was reduced by 42%, 83% and 84% in patients with mild, moderate or severe renal impairment, respectively.
Conclusions
These results indicate that both kidney and liver significantly contribute to dapagliflozin metabolism, resulting in higher systemic exposure with declining kidney function. Dapagliflozin pharmacodynamics in diabetic subjects with moderate to severe renal impairment are consistent with the observation of reduced efficacy in this patient population.
Keywords: dapagliflozin, glucuronosyltransferase, renal insufficiency, sodium-glucose transporter 2, type 2 diabetes mellitus, UGT1A9
WHAT IS ALREADY KNOWN ABOUT THIS SUBJECT
Dapagliflozin is a selective inhibitor of the renal sodium glucose co-transporter-2 (SGLT2) that improves hyperglycaemia in patients with normal kidney function by promoting urinary glucose excretion proportional to plasma glucose concentrations and the glomerular filtration rate.
Dapagliflozin is glucuronidated by UGT1A9 to a major, inactive metabolite dapagliflozin 3-O-glucuronide (D3OG). D3OG is mainly cleared via the kidney.
WHAT THIS STUDY ADDS
Dapagliflozin and D3OG pharmacokinetics are influenced by kidney function, with incrementally higher systemic exposures proportional to declining kidney function.
The kidney, along with the liver, plays an important role in UGT1A9-mediated dapagliflozin metabolism.
Despite higher dapagliflozin systemic exposures, dapagliflozin pharmacodynamic effects are correspondingly decreased with decreasing kidney function and the accompanying decrease in filtered glucose load.
Introduction
In the US, approximately 40% of adults with type 2 diabetes mellitus (T2DM) have comorbid chronic renal disease, and T2DM is widely regarded as the leading cause of end-stage renal disease [1]. The risk of chronic kidney disease is increased if plasma glucose concentrations are persistently, even if only moderately, elevated [2].
The kidney plays a pivotal role in maintaining plasma glucose concentrations and preventing caloric loss via glucose wasting [3]. Normally, of the ∼180 g of glucose filtered through the glomeruli daily in a healthy individual, more than 99% is reabsorbed [3]. Renal glucose reabsorption in patients with T2DM, as well as healthy individuals, is predominantly mediated by the sodium glucose cotransporter-2 (SGLT2) in the S1 segment of the proximal convoluted tubule [4–6]. In patients with T2DM, the reabsorption of glucose from glomerular filtrate into the blood continues and is perhaps even increased despite the presence of hyperglycaemia, thereby contributing to the maintenance of a hyperglycaemic state [7, 8].
Dapagliflozin is an orally bioavailable, selective, reversible inhibitor of SGLT2 [9, 10] that has been demonstrated to improve parameters of glycaemic control and promote weight loss in patients with T2DM and normal kidney function [11–17]. Inhibition of SGLT2 using dapagliflozin causes urinary glucose excretion [18], resulting in loss of excess glucose reducing blood glucose concentrations.
Following oral administration, dapagliflozin is rapidly absorbed and has dose-proportional systemic exposures across a broad range of doses (≤500 mg) [18]. Dapagliflozin is metabolized via direct glucuronide conjugation mediated by uridine diphosphate glucuronosyltransferase (UGT) 1A9 to dapagliflozin 3-O-glucuronide (D3OG) [19], which does not show meaningful inhibition of SGLT2 at clinically relevant doses (data not shown). Renal excretion of the parent compound dapagliflozin is minimal (<2% of dose) [18] but renal excretion of dapagliflozin-conjugated metabolites, including D3OG, is extensive [20] (73% of dose; Bristol-Myers Squibb, data on file).
Given that (i) SGLT2 expression, thus inhibition, is restricted to the kidney, (ii) the amount of glucose filtered by the kidney (the filtered load) is a product of plasma glucose concentration and the glomerular filtration rate, (iii) renal impairment may be a consequence of and comorbidity with T2DM and (iv) D3OG is primarily cleared via the kidney, it is important to assess the degree to which renal impairment may affect the pharmacokinetics and pharmacodynamics of dapagliflozin and its metabolites. In this study the pharmacokinetics and pharmacodynamics of this novel SGLT2 inhibitor were characterized in healthy subjects with normal kidney function, and in patients with T2DM and varying degrees of renal impairment (no renal impairment, mild, moderate and severe).
Methods
Subjects
Men and women aged 18 to 79 years were eligible for inclusion. The study population consisted of healthy subjects and patients with T2DM and normal or impaired kidney function. At enrolment, the subject's kidney function was categorized according to estimated creatinine clearance (CLcr) calculated by the Cockcroft–Gault equation [21]. Normal kidney function was defined as a CLcr >80 ml min−1. The criteria for mild, moderate and severe renal impairment were preclassified CLcr 51–80 ml min−1, 30–50 ml min−1 and <30 ml min−1 but not receiving dialysis, respectively [22]. A bolus intravenous dose (1500 mg iodine) of iohexol [an iodinated radiographic contrast agent used to accurately estimate glomerular filtration rate (GFR)] was administered to subjects at a visit occurring between days −16 and −9 in order to support the renal impairment classification determined by the Cockcroft–Gault method. Patients were subsequently excluded if kidney disease was deemed unstable because serum creatinine displayed a >20% change from an initial screening value of ≥1 mg dl−1 (≥88.4 μmol l−1) (day −28) between days −16 and −9, when subjects were admitted to the study centre for approximately 24 h. Patients with T2DM were required to have glycosylated haemoglobin (HbA1c) <10% and fasting serum glucose ≤270 mg dl−1 (≤15 mmol l−1). For patients being treated with insulin, the dose had to be stable for ≥1 month before enrolment. Exclusion criteria included any uncontrolled/unstable disease other than T2DM, history of diabetic ketoacidosis, history of thyroid disease or goitre not on a stable dose of thyroid hormone, drug or alcohol abuse within the previous 6 months and use of CYP3A inducers or inhibitors within 4 weeks of dapagliflozin dosing. All subjects had to provide written informed consent.
Study design
This open label, parallel group study was conducted in compliance with the Declaration of Helsinki, US FDA Code of Federal Regulations and Good Clinical Practice and was approved by institutional review boards at the four participating clinical sites. Eligible subjects were admitted to the study centres the evening of day −2. Subjects with serum creatinine >20% higher than the value recorded between days −16 and −9 were withdrawn from the study. Kidney function was quantified by determination of total body clearance of iohexol [23], estimated GFR using the Modified Diet in Renal Disease equation [24], the Cockcroft–Gault equation [22] and 24 h measured urinary CLcr. After an overnight fast of at least 10 h, participants underwent baseline assessments on day −1 that included collection of 24 h urine for the determination of glucose and creatinine and blood samples [22] for determination of serum creatinine and glucose. On the morning of day 1, after a ≥10 h overnight fast, participants drank 250 ml water in the 2 h before dosing and then received a single oral dose of 50 mg dapagliflozin swallowed with 250 ml water and 250 ml water 1.5 h after dosing. On days −1, 1, 4 and 10 subjects were required to drink a minimum of 2000 ml water. Maximum water intake was restricted to 4000 ml on all study days. Food was provided 6 h after dosing. Venous blood samples (3 ml) were collected immediately prior to dosing and at 15, 30 and 45 min, and thereafter at gradually increasing intervals until 60 h after dosing. On day 4, a minimum of four in each study group of patients with T2DM remained in the study. The remainder of the patients, including all healthy subjects, were discharged. Subjects remaining in the study received 20 mg day−1 dapagliflozin on days 4–10, with the collection of blood samples on each day immediately prior to dosing and at 30, 60 and 90 min, and thereafter at increasing intervals until 24 h after dosing. On day 1, urine samples were pooled for each patient in the following collection periods: 0–2, 2–6, 6–12, 12–24, 24–48 and 48–72 h. On days 4 and 10, urine collections were pooled for each patient for the same collection periods as day 1 until 24 h after dosing. The patients participating in the multiple dose study were furloughed on day 11, but returned on day 14 for discharge evaluation.
During the study, healthy subjects were not allowed to use concomitant medications. Patients with T2DM were allowed stable doses of chronic medication, given 4 h after dapagliflozin intake. No participants were allowed proton pump inhibitors, glucagon-like peptide-1 analogues or gemfibrozil during the study. Products containing grapefruit, or which inhibit CYP 3A4, alcohol and caffeine were prohibited.
Analysis of blood and urine samples
Blood samples were mixed with EDTA potassium, stored on ice and centrifuged within 15 min at 1000 g to obtain plasma for analysis. Pooled urine volumes were recorded and two 5 ml aliquots were collected. Plasma and urine samples were stored at −20°C until shipped on dry ice to a central laboratory for determination of iohexol or dapagliflozin and D3OG concentrations using validated high performance liquid chromatography (HPLC)/tandem mass spectrometry (MS/MS) protocols. The lower and upper limits of detection (LLOQ and ULOQ, respectively) for dapagliflozin and D3OG in plasma were 1–1000 ng ml−1 and 1–500 ng ml−1, respectively, and the corresponding values in urine were 1–1000 ng ml−1 and 10–5000 ng ml−1, respectively. The LLOQ and ULOQ for iohexol in plasma and urine were 1–500 μg ml−1 and 2–1000 μg ml−1, respectively. The assays for iohexol and dapagliflozin and D3OG concentrations in plasma and urine had between run, within run and precision (mean % deviation from nominal concentrations) coefficients of variation of ≤14.2%. Blood samples collected 90 min after dosing (∼tmax for dapagliflozin) on day 1 were used for plasma protein binding evaluation using an equilibrium dialysis method to determine the free and bound fractions of dapagliflozin in plasma from each sample.
Pharmacodynamic assessments
Fasting (0–6 h post-dose) renal glucose clearance and total amount of glucose excreted in urine in 24 h were determined from samples obtained on day −1 and following the single dose and the first and seventh multiple daily doses of dapagliflozin (study days 1, 4 and 10, respectively). Renal glucose clearance was calculated as total amount of glucose excreted between 0 and 6 h divided by the area under the serum glucose concentration–time curve for that period. The percent inhibition of renal glucose reabsorption, renal glucose clearance and filtered glucose load (estimated GFR × plasma glucose concentration), as described by Komoroski et al. [25] were calculated. The percent inhibition of renal glucose reabsorption was calculated from renal glucose clearance using the following formula: inhibition of renal glucose reabsorption (%) = renal glucose clearance (ml min−1)/CLcr on the study day (ml min−1) × 100.
Safety assessments
All adverse events occurring throughout the study were recorded with information on intensity and investigator-assessed relationship to dapagliflozin. Events were tabulated by system organ class, preferred term, diabetic status and degree of kidney function. Laboratory abnormalities (haematology, urinalysis and blood chemistry) were noted, and electrocardiograms and vital signs were recorded.
Statistical analysis
Statistical analyses were conducted using SAS/STAT version 8.2 (SAS Institute Inc, Cary, NC, USA). Summary statistics for pharmacokinetic parameters were calculated according to T2DM status and category of kidney function. Values were expressed as geometric means and coefficients of variation for Cmax, AUC(0,∞) (single dose), AUC(0,τ) (multiple doses) and molar-corrected metabolite : parent ratios for AUC(0,∞) (MR), median and range for tmax and mean (SD) for all other parameters.
Linear regression analyses of the single and multiple dose log (AUC) dapagliflozin or D3OG vs. iohexol clearance were performed. Point estimates and 95% confidence intervals (CIs) were calculated for the slopes. Model-based point estimates and 90% CIs of the ratios of dapagliflozin AUC(0,∞) geometric means (renal impaired vs. normal) were computed for each renal impairment group. For the single dose, the regression analysis was done to compare each renal impairment group vs. normal by pooling the data for normal healthy subjects and patients with T2DM and normal kidney function. Similar analyses were conducted to relate dapagliflozin Cmax, D3OG AUC(0,∞) and D3OG Cmax to iohexol clearance.
In vitro studies
Glucuronidation of dapagliflozin
D3OG and dapagliflozin 2-O-glucuronide (D2OG) formation was evaluated by incubating human kidney, liver or intestinal microsomes (Celsis In Vitro Technology, Chicago, IL, USA) with 100 μm dapagliflozin in a solution of 50 mm Tris buffer (pH 7.5), 10 mm magnesium chloride, 2 mm UDPGA (Sigma-Aldrich, St Louis, MO, USA) and 25 μg ml−1 alamethicin (Sigma-Aldrich) for a final protein concentration of 0.25 mg ml−1. Incubations were performed in 96-well plates (300 μl; Axygen Scientific, Union, CA, USA) at 37°C for 15 min in a heated shaker (Tecan, Research Triangle Park, NC, USA). The positive control for the UGT1A9 assay was propofol (130 μm, Toronto Research Chemicals, North Park, ON, Canada) and for the UGT2B7 assay was 500 μm AZT (Sigma-Aldrich). Deproteinization was performed with one volume acetonitrile (J.T. Baker, Phillipsburg, NJ, USA), which contained an internal standard. Precipitated proteins were removed by a 96-deep-well filtration MultiScreen Solvinert hydrophilic plate (0.45 μm polytetrafluoroethylene membrane; Millipore Co., Billerica, MA, USA) and collected in a 2 ml receiver plate (BD Science, San Jose, CA, USA).
Filtered samples from the incubation steps were analyzed by LC/MS. The ranges of the calibration curve were between 10 and 2000 nm for D3OG and 2 and 400 nm for D2OG. The accuracy and precision for both D3OG and D2OG were within 15% (20% for LLOQ) for at least three quarters of all standards measured.
In vitro glucuronidation rates of 5–3200 μm dapagliflozin after incubation with human kidney microsomes were determined using an Eadie–Hofstee plot.
Results
Subjects
A total of 40 subjects were enrolled, with baseline characteristics presented in Table 1. Of these, 38 completed the single dose phase of the study and 18 participated in the multiple dose phase (16 completed). Of the four subjects who discontinued from the study, two discontinued due to adverse events and two withdrew consent. The following methods were used to assess the GFR: Cockcroft–Gault [22], iohexol serum clearance, and 24 h measured urinary CLcr. Iohexol clearance was strongly correlated with Cockcroft–Gault (r = 0.86) and urinary CLcr (r = 0.76), indicating that the enrolled subjects were categorized appropriately by multiple methods of estimating GFR (Supporting Information Figure S1).
Table 1.
Demographics and physical characteristics of treated subjects
| T2DM* | |||||
|---|---|---|---|---|---|
| Characteristic | Healthy subjects (n = 8) | Normal kidney function (n = 12) | Mild renal impairment (n = 8) | Moderate renal impairment (n = 8) | Severe renal impairment (n = 4) |
| Age (years) | |||||
| Mean (SD) | 43 (15) | 55 (9) | 66 (7) | 72 (5) | 66 (6) |
| Range | 25–63 | 42–67 | 55–75 | 62–76 | 59–73 |
| Males | |||||
| n, % | 5 (63) | 8 (67) | 3 (38) | 4 (50) | 4 (100) |
| Race | |||||
| White† | 6 (75) | 10 (83) | 8 (100) | 7 (88) | 4 (100) |
| Black/African American | 2 (25) | 1 (8) | 0 | 1 (13) | 0 |
| Pacific Islander | 0 | 1 (8) | 0 | 0 | 0 |
| Weight (kg) | |||||
| Mean (SD) | 77.9 (9.9) | 97.2 (18.4) | 73.9 (12.1) | 77.4 (17.7) | 78.4 (4.1) |
| Range | 62.2–96.0 | 69.1–140.4 | 58.8–90.6 | 51.8–101.2 | 72.3–80.9 |
| Body mass index (kg m−2) | |||||
| Mean (SD) | 27.8 (2.7) | 33.2 (5.1) | 29.3 (4.0) | 27.9 (4.4) | 27.2 (1.1) |
| Range | 22.7–31.2 | 24.4–44.4 | 21.1–34.3 | 20.2–32.7 | 26.2–28.7 |
| Baseline HbA1c (%) | |||||
| Mean (SD) | 5.5 (0.3) | 8.6 (1.2) | 8.5 (1.0) | 7.1 (1.1) | 7.1 (1.2) |
| Baseline FPG (mg dl−1) | |||||
| Mean (SD) | 89 (6.8) | 168 (53.3) | 139.6 (27.1) | 122.4 (27.6) | 130.3 (49.1) |
| Baseline FPG (mmol l−1) | |||||
| Mean (SD) | 4.94 (0.38) | 9.32 (2.96) | 7.75 (1.50) | 6.79 (1.53) | 7.23 (2.73) |
| Medications, n (%) | |||||
| Metformin | 0 | 83 | 88 | 12 | 0 |
| Sulfonylurea | 0 | 16 | 40 | 12 | 0 |
| Insulin | 0 | 0 | 0 | 50 | 75 |
| CLcr (ml min−1) | |||||
| Mean (SD) | 118.5 (25.2) | 133.2 (39.1) | 69.6 (7.1) | 42.6 (8.0) | 24.3 (5.6) |
CLcr, creatinine clearance; FPG, fasting plasma glucose; HbA1c, glycated haemoglobin.
Normal kidney function was defined as an estimated creatinine clearance (CLcr) >80 ml min−1 and mild, moderate and severe renal impairment were CLcr 51–80 ml min−1, 30–50 ml min−1 and <30 ml min−1 but not receiving dialysis, respectively.
Includes Hispanic/Latino.
Pharmacokinetics of dapagliflozin and D3OG
Single dose study
A single 50 mg dose of dapagliflozin was absorbed rapidly (time to Cmax, tmax 1–1.25 h) and D3OG was generated rapidly (tmax 1.75–2 h) (Table 2, Supporting Information Figure S2). Mean dapagliflozin plasma protein binding 2 h post-dose ranged from 92.3% to 94.6%, irrespective of T2DM or kidney function. Plasma concentrations of dapagliflozin and D3OG were incrementally higher with declining kidney function. However, the effect of renal impairment on geometric mean dapagliflozin systemic exposure (AUC(0,∞)) and apparent oral total systemic clearance was less than two-fold. The mean terminal half-lives (t1/2) of dapagliflozin and D3OG were similar in diabetic and non-diabetic subjects with normal kidney function. Values for t1/2 were ∼3–6 h longer in patients with T2DM and renal impairment, but were not well correlated with the degree of renal impairment. Renal clearance (CLR) of dapagliflozin was correlated with the degree of renal impairment, but the extent of urinary excretion, expressed as a percentage of the administered dose (%UR), indicated that urinary excretion represents a minor elimination route for dapagliflozin (0.5%–1.6% of dose), and is not well correlated with renal impairment. D3OG CLR was reduced proportionately with lower kidney function. The mean %UR for D3OG was similar among all groups (51.5%–64.3% of dapagliflozin dose), except for the severe renal impairment group (18.5% of dapagliflozin dose). The mean MR for AUC(0,∞) ranged from 1.12 to 2.64, with higher ratios being observed with declining kidney function.
Table 2.
Summary statistics for dapagliflozin and D3OG pharmacokinetic parameters after receipt of dapagliflozin 50 mg in subjects with varying degrees of renal function
| T2DM* | |||||
|---|---|---|---|---|---|
| Healthy subjects (n = 8) | Normal kidney function (n = 12) | Mild renal impairment (n = 8) | Moderate renal impairment (n = 8) | Severe renal impairment (n = 4) | |
| Dapagliflozin | |||||
| Cmax (ng ml−1), mean† (CV%) | 710 (31) | 647 (37) | 902 (35) | 897 (41) | 772 (11) |
| AUC(0,∞) (ng ml−1 h), mean† (CV%) | 2880 (27) | 2504 (30) | 4018 (26) | 5182 (38) | 4884 (10)‡ |
| AUC(0,τ) (ng ml−1 h), mean† (CV%) | 2821 (27) | 2439 (30) | 3832 (26) | 4847 (35) | 4385 (12) |
| t1/2 (h), mean (SD) | 12.7 (7.0) | 11.9 (5.7) | 18.4 (8.2) | 17.9 (3.4) | 15.0 (4.2)‡ |
| tmax (h), median (range) | 1.17 (0.5–2.0) | 1.25 (0.5–2.0) | 1.25 (0.5–2.0) | 1.00 (0.5–3.0) | 1.17 (0.75–1.5) |
| CLR (ml min−1), mean† (CV%) | 3.52 (34) | 3.43 (47) | 2.85 (55) | 2.06 (81) | 0.84 (46) |
| CL/F (ml min−1), mean† (CV%) | 289 (26) | 333 (26) | 207 (25) | 161 (26) | 171 (10)‡ |
| Vd/F (l) | 176 (36) | 200 (42) | 168 (50) | 171 (41) | 226 (108) |
| UR (%), mean (SD) | 1.2 (0.5) | 1.0 (0.4) | 1.4 (1.0) | 1.6 (1.3) | 0.5 (0.2) |
| D3OG | |||||
| Cmax (ng ml−1), mean† (CV%) | 960 (33) | 1391 (29) | 1641 (26) | 2037 (31) | 1986 (22) |
| AUC(0,∞) (ng ml−1 h), mean† (CV%) | 4634 (30) | 6616 (32) | 9830 (24) | 16 831 (36) | 22 409 (31)‡ |
| AUC(0,τ) (ng ml−1 h), mean† (CV%) | 4565 (30) | 6500 (33) | 9413 (23) | 15 943 (35) | 19 045 (36) |
| t1/2 (h), mean (SD) | 12.1 (6.0) | 11.2 (3.7) | 17.5 (8.2) | 16.0 (2.7) | 12.9 (2.4)‡ |
| tmax (h), median (range) | 2.0 (1.0–3.0) | 2.0 (1.0–3.0) | 2.0 (1.0–3.0) | 1.75 (1.0–3.0) | 2.0 (1.8–4.0) |
| CLR (ml min−1), mean† (CV%) | 151 (54) | 76 (67) | 75 (33) | 43 (62) | 11 (23) |
| UR (%), mean (SD) | 63.1 (24.7) | 51.5 (30.5) | 64.3 (24.8) | 62.6 (25.2) | 18.5 (7.8) |
| MR, mean† (CV%) | 1.12 (45) | 1.85 (36) | 1.71 (27) | 2.27 (40) | 2.64 (49) |
AUC(0,∞), area under plasma concentration–time curve; AUC(0,τ), area under plasma concentration–time curve to the end of dosing interval; CL/F, total systematic clearance; CLR, renal clearance; Cmax, maximum observed plasma concentration; CV, coefficient of variation; MR, ratio of metabolite : parent AUC (corrected for molecular weight); t1/2, half-life; T2DM, type 2 diabetes mellitus; tmax, time to Cmax; UR, urinary recovery; Vd/F, volume of distribution. Plasma binding was determined by equilibrium dialysis.
Normal kidney function was defined as an estimated creatinine clearance (CLcr) >80 ml min−1 and mild, moderate and severe renal impairment were CLcr 51–80 ml min−1, 30–50 ml min−1 and <30 ml min−1 but not receiving dialysis, respectively.
Geometric mean.
n = 3.
Linear regression of total iohexol systemic clearance and dapagliflozin or D3OG Cmax and AUC(0,∞) (Supporting Information Figure S3) at the midpoint of iohexol systemic clearance for each renal impairment category showed patients with T2DM and renal impairment had higher geometric mean Cmax and AUC(0,∞) for both dapagliflozin and D3OG in patients with greater degrees of renal impairment (Table 3).
Table 3.
Model-based estimates for dapagliflozin and D3OG pharmacokinetics parameters at the midpoint of the iohexol systemic clearance after receipt of dapagliflozin 50 mg and seven daily doses of dapagliflozin 20 mg in patients with T2DM with varying degrees of kidney function in comparison with normal kidney function. The midpoint of the iohexol systemic clearance for each renal impairment category was 100, 65, 40 and 20 ml min−1 for normal kidney function, mild, moderate or severe impairment, respectively
| Dapagliflozin | D3OG | ||||
|---|---|---|---|---|---|
| Pharmacokinetic variable | Category of renal impairment | % Higher vs. normal kidney function | 90% CI | % Higher vs. normal kidney function | 90% CI |
| Single 50 mg dose | |||||
| Cmax (ng ml−1) | Mild | 14% | 1.05, 1.24 | 20% | 1.11, 1.30 |
| Moderate | 26% | 1.09, 1.45 | 36% | 1.20, 1.55 | |
| Severe | 36% | 1.12, 1.63 | 51% | 1.27, 1.80 | |
| AUC(0,∞) (ng ml−1 h) | Mild | 28% | 1.19, 1.37 | 50% | 1.37, 1.65 |
| Moderate | 52% | 1.35, 1.72 | 101% | 1.71, 2.37 | |
| Severe | 75% | 1.49, 2.07 | 154% | 2.04, 3.16 | |
| Seventh 20 mg day−1 dose | |||||
| Cmax (ng ml−1) | Mild | 4% | 0.92, 1.17 | 20% | 1.11, 1.30 |
| Moderate | 6% | 0.87, 1.30 | 37% | 1.19, 1.56 | |
| Severe | 9% | 0.83, 1.42 | 52% | 1.27, 1.82 | |
| AUC(0,τ) (ng ml−1 h) | Mild | 32% | 1.14, 1.52 | 54% | 1.35, 1.76 |
| Moderate | 60% | 1.25, 2.06 | 110% | 1.67, 2.64 | |
| Severe | 87% | 1.34, 2.62 | 169% | 1.99, 3.64 | |
CI, confidence interval; D3OG, dapagliflozin 3-O-glucuronide; T2DM, type 2 diabetes mellitus.
Multiple dose study
The multiple dose pharmacokinetic parameters for dapagliflozin and D3OG are summarized in Table 4 and presented in Figures 1 and 2. There were no marked differences in the steady-state pharmacokinetics of dapagliflozin and D3OG compared with the single dose. Consistent with the single dose t1/2 values of dapagliflozin and D3OG, modest accumulation of dapagliflozin (<40%) from the first dose to the steady-state (seventh dose) was observed that was correlated with the degree of renal impairment. As observed in the single dose study, both dapagliflozin and D3OG showed incrementally higher exposure with greater degrees of renal impairment.
Table 4.
Summary of dapagliflozin and D3OG pharmacokinetic parameters after the first (day 4) and seventh daily doses (day 10) of dapagliflozin 20 mg in patients with T2DM and varying degrees of kidney function
| T2DM | |||||
|---|---|---|---|---|---|
| Study day | Normal kidney function* (n = 4) | Mild renal impairment* (n = 4) | Moderate renal impairment*,‡ (n = 6) | Severe renal impairment* (n = 3) | |
| Dapagliflozin | |||||
| Cmax (ng ml−1), mean† (CV%) | 4 | 249 (21) | 410 (23) | 466 (21) | 330 (6) |
| 10 | 310 (22) | 358 (25) | 512 (23) | 338 (16) | |
| AUC(0,τ) (ng ml−1 h), mean† (CV%) | 4 | 864 (11) | 1428 (38) | 1807 (31) | 1920 (26) |
| 10 | 853 (8) | 1443 (21) | 2467 (37) | 2207 (27) | |
| tmax (h), median (range) | 4 | 1.0 (0.5–1.5) | 1.0 (1.0–6.0) | 1.0 (0.5–1.0) | 1.0 (0.5–2.0) |
| 10 | 1.0 (0.5–1.0) | 1.0 (1.0–1.5) | 1.0 (0.5–1.5) | 1.0 (0.5–1.0) | |
| CL/F (ml min−1) | 4 | 340 (21) | 254 (33) | 117 (47) | 155 (25) |
| 10 | 363 (8) | 212 (22) | 107 (35) | 106 (38) | |
| Vd/F (l) | 4 | 198 (63) | 115 (26) | 132 (56) | 128 (23) |
| 10 | 160 (20) | 105 (26) | 85 (24) | 116 (16) | |
| CLR (ml min−1), mean† (CV%) | 4 | 5.22 (38) | 2.37 (54) | 2.54 (71) | 1.42 (30) |
| 10 | 6.51 (34) | 2.52 (51) | 2.06 (77) | 1.13 (19) | |
| UR (%), mean (SD) | 4 | 1.4 (0.5) | 1.1 (0.4) | 2.0 (2.2) | 0.9 (0.4) |
| 10 | 1.7 (0.5) | 1.2 (0.5) | 1.8 (1.1) | 0.8 (0.3) | |
| D3OG | |||||
| Cmax (ng ml−1), mean† (CV%) | 4 | 644 (21) | 791 (31) | 911 (38) | 770 (21) |
| 10 | 637 (26) | 843 (18) | 1088 (24) | 965 (18) | |
| AUC(0,τ) (ng ml−1 h), mean† | 4 | 2818 (40) | 4164 (22) | 6502 (39) | 7947 (46) |
| 10 | 2769 (36) | 4278 (25) | 8442 (40) | 10 549 (31) | |
| tmax (h), median (range) | 4 | 1.8 (1.0–2.0) | 1.8 (1.5–6.0) | 1.5 (1.0–2.0) | 2.0 (1.5–4.0) |
| 10 | 1.5 (1.0–1.5) | 1.5 (1.5–2.0) | 1.5 (1.0–2.0) | 2.0 (1.5–4.0) | |
| CLR (ml min−1), mean† (CV%) | 4 | 139 (48) | 79 (31) | 37 (52) | 15 (39) |
| 10 | 93 (66) | 72 (49) | 37 (48) | 10 (28) | |
| UR (%), mean (SD) | 4 | 79.9 (15.4) | 68.7 (20.9) | 50.1 (15.7) | 27.7 (16.0) |
| 10 | 60.5 (33.3) | 68.0 (27.6) | 66.0 (20.6) | 23.2 (9.8) | |
| MR, mean† (CV%) | 4 | 2.3 (31) | 2.0 (28) | 2.5 (37) | 2.9 (22) |
| 10 | 2.3 (34) | 2.1 (9) | 2.4 (41) | 3.3 (41) | |
AUC(0,τ), area under plasma concentration–time curve to the end of dosing interval; CL/F, total systemic clearance; CLR, renal clearance; Cmax, maximum observed plasma concentration; CV, coefficient of variation; D3OG, dapagliflozin 3-O-glucuronide; MR, ratio of metabolite : parent AUC (corrected for molecular weight); tmax, time to Cmax; UR, urinary recovery; Vd/F, volume of distribution. Plasma binding was determined by equilibrium dialysis.
Normal kidney function was defined as an estimated creatinine clearance (CLcr) >80 ml min−1 and mild, moderate and severe renal impairment were CLcr 51–80 ml min−1, 30–50 ml min−1 and <30 ml min−1 but not receiving dialysis, respectively.
Geometric mean.
n = 5 for all pharmacokinetic parameters at day 10.
Figure 1.
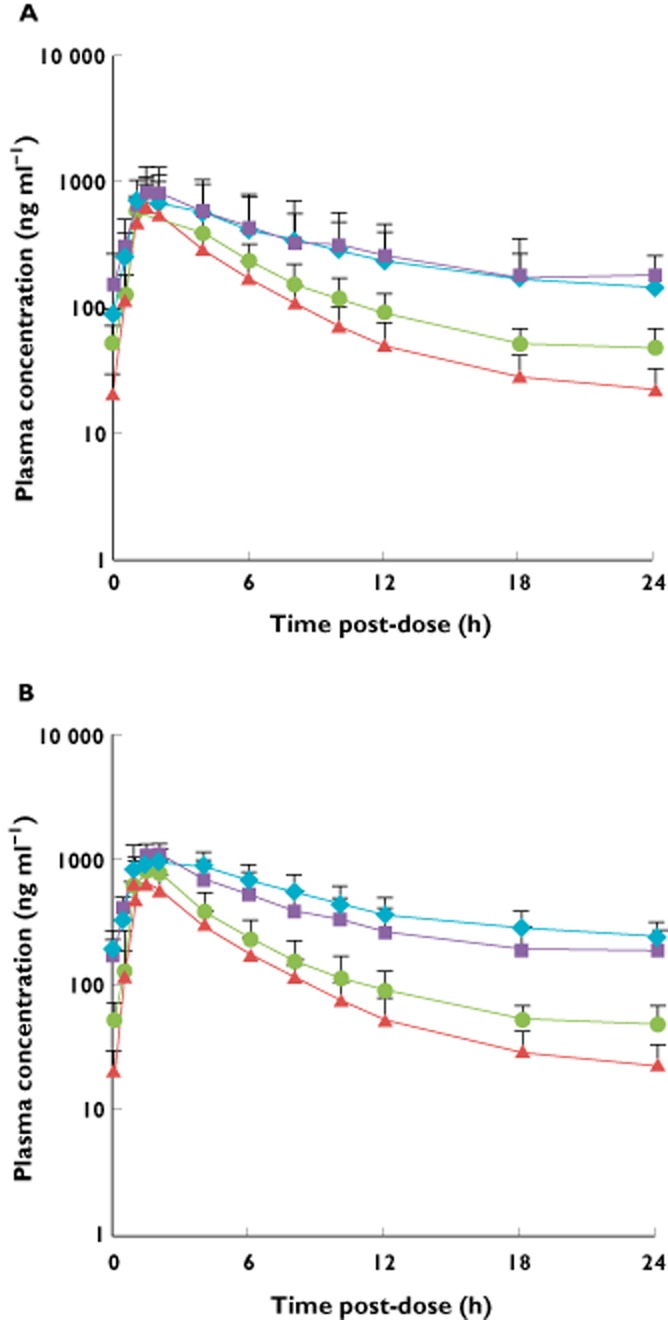
Plasma concentration vs. time curves for (A) dapagliflozin and (B) D3OG after seven 20 mg day−1 doses of dapagliflozin (steady-state, day 10) in subjects with T2DM and varying degrees of kidney function. D3OG, dapagliflozin 3-O-glucuronide; T2DM, type 2 diabetes mellitus.  , T2DM patients with normal kidney function;
  , T2DM patients with mild renal impairment;
  , T2DM patients with moderate renal impairment;
  , T2DM patients with severe renal impairment
Figure 2.
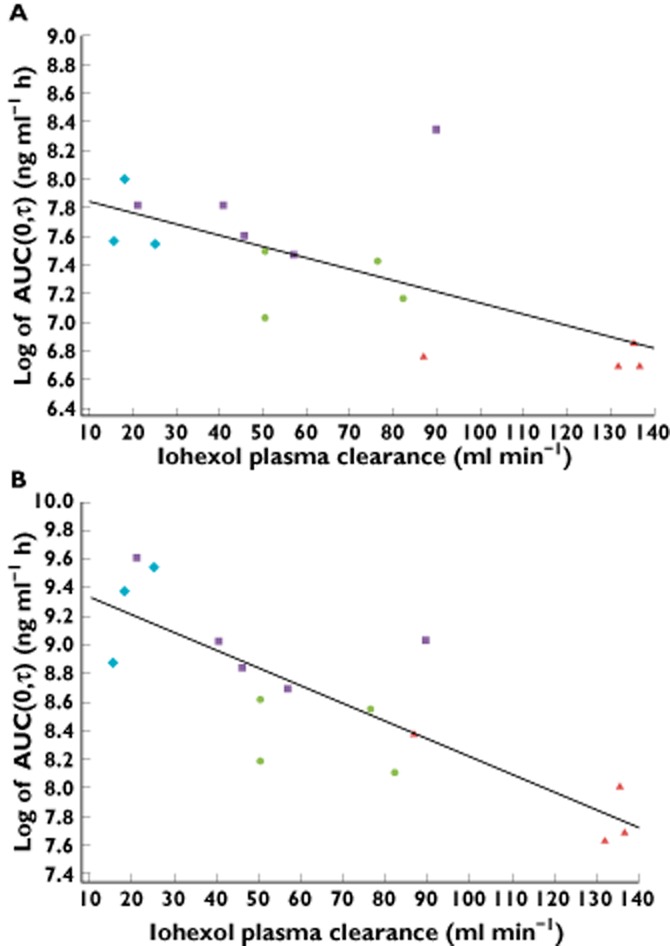
Linear regression analyses for AUC(0,τ) of (A) dapagliflozin and (B) D3OG on total iohexol systemic clearance after seven 20 mg day−1 doses of dapagliflozin (steady-state, day 10) in subjects with T2DM and varying degrees of kidney function. D3OG, dapagliflozin 3-O-glucuronide; T2DM, type 2 diabetes mellitus.  , T2DM patients with normal kidney function;
  , T2DM patients with mild renal impairment;
  , T2DM patients with moderate renal impairment;
  , T2DM patients with severe renal impairment
In vitro studies
Glucuronidation of dapagliflozin
D3OG and D2OG were observed upon analysis of incubation mixtures of dapagliflozin with human liver, kidney or intestinal microsomes (Figure 3). D2OG has been observed as a product of in vitro incubations but not found as a significant circulating species [19]. A third glucuronide was detected in the intestinal microsomal incubation, but concentrations were too low to quantify accurately. D3OG formation rates were 60.8, 184 and 1.69 pmol min−1 mg−1 protein and D2OG formation rates were 2.80, 1.34 and 0.81 pmol min−1 mg−1 protein, respectively, in human liver, kidney and intestinal microsomal incubations. As a positive control, glucuronidation rates of the UGT1A9 substrate propofol, in the presence of human liver, kidney and intestinal microsomes were 3000, 3204 and 218 pmol min−1 mg−1 protein, respectively.
Figure 3.
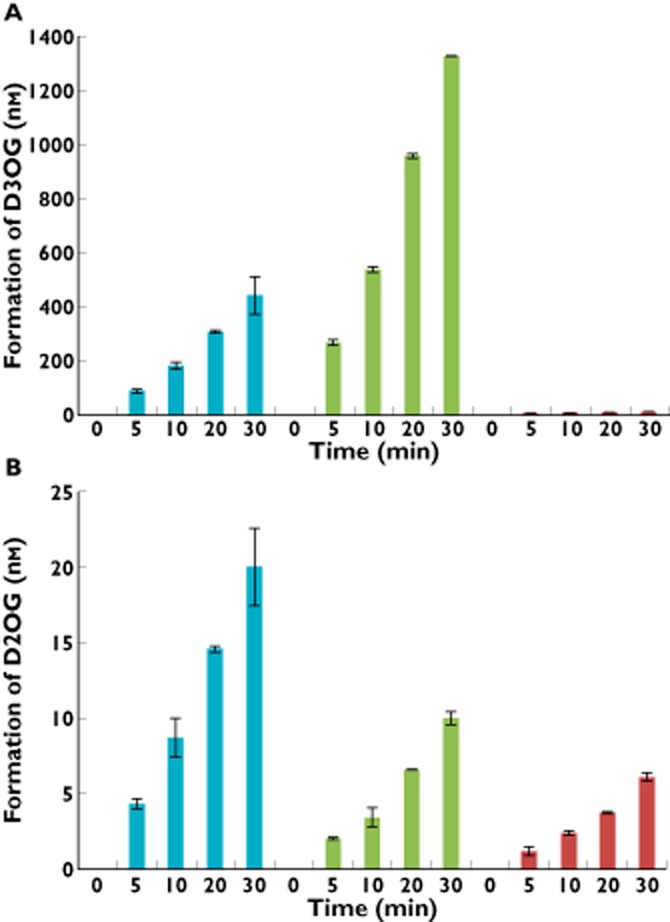
Formation rates of (A) D3OG and (B) D2OG after incubation of dapagliflozin with human kidney, liver or intestine microsomes at a protein concentration of 0.25 mg ml−1 in the presence of uridine 5′-diphosphoglucuronic acid. D2OG, dapagliflozin 2-O-glucuronide; D3OG, dapagliflozin 3-O-glucuronide; T2DM, type 2 diabetes mellitus.  , human liver microsomes;
  , human kidney microsomes;
  , human intestine microsomes
Over the concentration range of 5–3200 μm, glucuronidation rates of dapagliflozin to both D3OG and D2OG in incubations with human kidney microsomes were linear on Eadie–Hofstee plots (data not shown). The apparent Michaelis constant (Km) for D3OG formation in kidney microsomes was 479 μm and the maximum reaction rate (Vmax) was 794 pmol min−1 mg−1 protein, yielding an intrinsic clearance (Vmax/Km) of 1.66 μl min−1 mg−1 protein. By contrast, the apparent Km for D2OG formation was 1119 μm and the Vmax was 19.4 pmol min−1 mg−1 protein, yielding an intrinsic clearance of 0.0173 μl min−1 mg−1 protein. These results suggest that dapagliflozin metabolism to D3OG represents the primary glucuronidation pathway for dapagliflozin elimination by the kidney.
Effect of kidney function on dapagliflozin pharmacodynamics
Following a single 50 mg dose of dapagliflozin on day 1, mean fasting renal glucose clearance (i.e. 0–6 h) was increased in all groups compared with day −1 (Figure 4). Mean fasting renal glucose clearance was greater in patients with T2DM and normal kidney function (39.2 ml min−1) than in the healthy subjects with normal kidney function (27.6 ml min−1). In comparison with patients with T2DM and normal kidney function, mean fasting renal glucose clearance values were 53.4%, 76.8% and 85.0% lower in patients with mild, moderate and severe renal impairment, respectively. After receiving the first dose of 20 mg dapagliflozin (day 4 of the study), mean renal glucose clearance was 35.3 ml min−1 in patients with T2DM and normal kidney function. The corresponding values were 68.2%, 75.0% and 68.7% lower in subjects with mild, moderate and severe renal impairment, respectively. After 7 days of once daily 20 mg dapagliflozin, mean fasting renal glucose clearance was 49.6 ml min−1 in patients with T2DM and normal kidney function, whereas in patients with mild, moderate or severe renal impairment the mean values were 42.3%, 82.7% and 84.0% lower, respectively.
Figure 4.
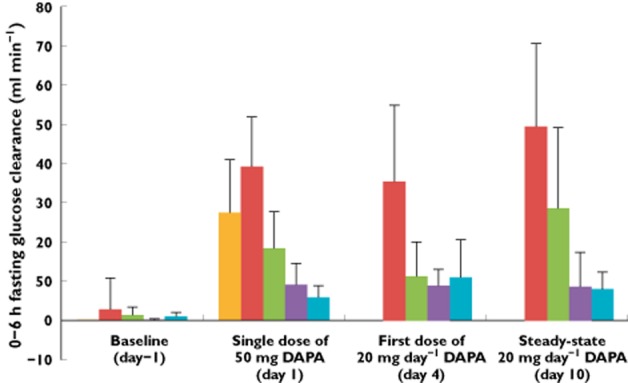
Effect of dapagliflozin on mean (+SD) fasting renal glucose clearance (0–6 h) at baseline (day −1) and after a single 50 mg dose (day 1), the first 20 mg day−1 dose (day 4) and the seventh 20 mg day−1 dose (steady-state, day 10). DAPA, dapagliflozin; T2DM, type 2 diabetes mellitus.  , healthy subjects with normal kidney function;
  , T2DM patients with normal kidney function;
  , T2DM patients with mild renal impairment;
  , T2DM patients with moderate renal impairment;
  , T2DM patients with severe renal impairment
Before taking dapagliflozin, mean 24 h urinary glucose excretion was higher on day −1 in patients with T2DM and normal kidney function than in patients with T2DM and moderate or severe renal impairment. Following administration of a single oral dose of dapagliflozin 50 mg, mean fasting renal glucose clearance and mean 24 h glucose excretion increased in all subjects. The greatest increases were observed in patients with T2DM and normal kidney function, while the increases were progressively less pronounced with increasing degrees of renal impairment (Supporting Information Figure S4). Similar to the results for mean fasting renal glucose clearance, mean 24 h urinary glucose excretion was reduced with increasing degrees of renal impairment. Percentage inhibition of renal glucose reabsorption (that is, the percentage of the filtered load that was excreted in urine), was independent of renal glucose clearance and kidney function and averaged between 20% and 44% inhibition across the groups studied (Supporting Information Figure S5). Percentage inhibition of renal glucose reabsorption was also independent of dapagliflozin protein binding (Supporting Information Figure S6).
Renal glucose clearance decreased linearly with urinary CLcr (Figure 5). Linear regression analyses showed positive correlations (β1) between fasting glucose clearance and 0–6 h CLcr following single and multiple doses of dapagliflozin, with the lower bounds of the 95% CIs for these linear regression functions all being >0 (all P values < 0.001; Supporting Information Table S1). Differences in predicted means of fasting renal glucose clearance and their 95% CIs for each degree of kidney function following single and multiple doses of dapagliflozin are summarized in Supporting Information Table S2.
Figure 5.
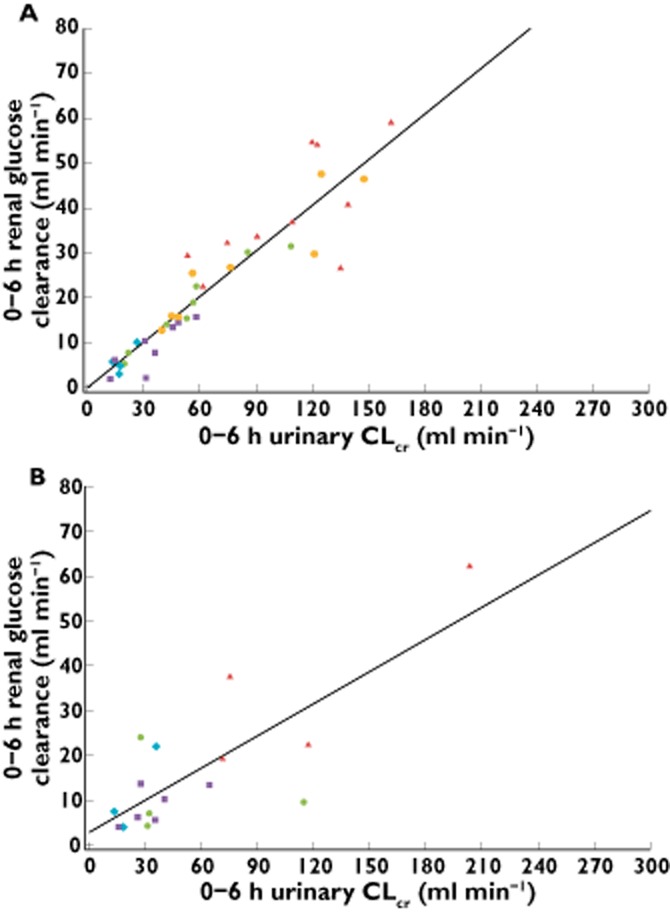
Scatter plot and fitted regression line of renal glucose clearance vs. urinary CLcr for (A) a single dose of 50 mg (day 1) and (B) the seventh 20 mg day−1 dose (steady-state, day 10) of dapagliflozin. CLcr, creatinine clearance; T2DM, type 2 diabetes mellitus.  , healthy subjects with normal kidney function;
  , T2DM patients with normal kidney function;
  , T2DM patients with mild renal impairment;
  , T2DM patients with moderate renal impairment;
  , T2DM patients with severe renal impairment
Effect of kidney function on safety and tolerability
A total of 14 (35%) participants experienced adverse events, which were all mild or moderate in intensity. No adverse event was serious. No trend in the frequency of adverse events in relation to the degree of kidney function was apparent. The most frequent adverse event was headache, with four instances occurring in three (7.5%) participants. In five participants, a total of eight adverse events were considered to be possibly related to dapagliflozin (nausea, diarrhoea, vomiting, asthenia, elevated serum creatinine, hypoglycaemia, anorexia and headache). Of the three reports of mild hypoglycaemia in a total of two subjects, only a single occurrence of hypoglycaemia in a T2DM patient with normal kidney function was considered by the Investigator to be possibly related to study drug.
Thirty-six subjects displayed a total of 71 marked laboratory abnormalities. The most common was high urinary glucose, which was detected in 25 (64.1%) participants. This was an expected finding based on the mechanism of action of dapagliflozin. The second most frequent abnormality was elevated blood urea nitrogen, occurring in 11 (27.5%) participants, all of whom had some degree of renal impairment. There were no marked differences in the serum electrolytes, including sodium, between groups at baseline and after treatment with dapagliflozin. Serum creatinine concentrations and CLcr were essentially unchanged from baseline at day 10. Total urinary protein values were highly variable across different study days and did not appear to have meaningful changes associated with administration of dapagliflozin.
Discussion
Patients with diabetes may present with or develop diabetic nephropathy [26]. Therefore, it is important to characterize the effects of renal impairment on the pharmacokinetics and pharmacodynamics of dapagliflozin to understand better the drug's potential efficacy in this population. This was the first study to examine dapagliflozin exposure and renal glucose clearance in patients with T2DM and varying degrees of impaired kidney function.
In this study, renal impairment did not substantially alter the oral absorption rate of dapagliflozin (as measured by Cmax and tmax) or dapagliflozin protein binding, but extended the t1/2 values (by up to ∼6 h) resulting in greater systemic exposure. Dapagliflozin and D3OG exposure was inversely related to iohexol clearance via linear regression analysis (i.e. higher AUC(0,∞) values were observed in subjects with lower GFR values). CLR values for dapagliflozin and D3OG were incrementally lower with increasing kidney disease severity, resulting in higher values for the molar-corrected ratio of metabolite : parent AUC. Overall, the D3OG pharmacokinetic results were anticipated based on the known route of CLR. However, the parent dapagliflozin exposure was higher than would be anticipated if the kidney only cleared dapagliflozin via filtration.
Reduced renal metabolic clearance of dapagliflozin and reduced CLR of D3OG are possible mechanisms for the higher dapagliflozin and D3OG exposures observed in patients with renal impairment. Renal dysfunction has been reported to impact on both renal and non-renal metabolism [27, 28]. Moreover, biotransformation of dapagliflozin to D3OG is mediated via UGT1A9 (unpublished data), a member of the phase II UGT enzyme family, which has been reported as having high kidney expression and up to 10-fold greater expression in kidney vs. liver [29, 30]. Based on reverse transcription polymerase chain reaction data, UGT1A9 expression is about eight-fold higher per mg of tissue in the human kidney as compared with the liver (unpublished data). Consistent with these mRNA expression levels, D3OG formation was approximately three-fold higher when dapagliflozin was incubated with human kidney microsomes vs. liver microsomes. The linearity of the Eadie–Hofstee plot of D3OG formation in human kidney microsomes suggests that a single enzyme catalyzes dapagliflozin glucuronidation and D3OG formation. Higher D2OG formation in the liver may be attributed to the greater expression of the glucuronidase UGT2B7 in human liver [31]. Despite a smaller fraction of the dapagliflozin dose being metabolized to D3OG, systemic exposures to D3OG were generally higher as renal function declined. This finding is expected. D3OG exhibits formation rate-limited pharmacokinetics and it is consequently not eliminated faster than parent dapagliflozin. Furthermore, D3OG is primarily cleared via the kidney where ∼60–80% of the dapagliflozin dose is recovered as D3OG in the urine in subjects or patients with normal renal function (see Tables 1 and 2) and thus its systemic clearance is markedly reduced as GFR is reduced.
The relative contributions of the kidney and liver to dapagliflozin metabolism are dependent on each organ's exposure to dapagliflozin, in addition to relative UGT1A9 expression levels. As a function of size, the liver receives ∼26% of cardiac output in comparison with ∼19.5% for the kidneys [32]. Although the rate of D3OG formation is higher in kidney vs. liver microsomes, given the overall relative exposure of each organ to dapagliflozin, it is most likely that both organs contribute significantly to dapagliflozin metabolism. Importantly, the impact of chronic kidney disease on the liver metabolism of dapagliflozin is currently unknown and would be difficult to evaluate given that UGT1A9 is present in both organs.
The relative rates in liver vs. kidney for dapagliflozin differed from those found with propofol, a result that seems counterintuitive as both compounds have been demonstrated to be reasonably selective UGT1A9 substrates. A variety of factors may be responsible for this discrepancy, including: (i) differential access of particular substrates to the UGT enzymes in liver vs. kidney microsome preparations, as determination of in vitro rates of glucuronidation has been shown to be very dependent on incubation conditions [33] and (ii) actual differences in enzyme characteristics when isolated from different tissue sources, as there is literature demonstrating that specific UGT enzyme kinetics can vary depending on the UGT/CYP family enzymes that are co-expressed [34].
Comparable amounts of glucose were excreted by healthy subjects and patients with T2DM and normal kidney function or mild impairment suggesting a predictable pharmacologic response to dapagliflozin in the presence of mild renal impairment (CLcr 50–80 ml min−1). For these groups, urinary glucose excretion values were similar to those previously reported at doses of 20 or 25 mg dapagliflozin [18, 25]. In patients with T2DM and moderate (CLcr 30–50 ml min−1) or severe (CLcr 10–30 ml min−1) renal impairment, mean fasting renal glucose clearance and 24 h urinary glucose excretion after single and multiple doses of dapagliflozin were substantially less than the amounts observed in patients with T2DM and normal kidney function or with mild renal impairment. The fasting renal glucose clearance correlated well with estimates of GFR, indicating that the primary factor influencing CLR of glucose during dapagliflozin treatment was GFR. Thus, as renal function (GFR) decreases, for a given plasma glucose concentration less glucose is filtered (the ‘filtered load’) and less glucose is therefore available to be prevented from being reabsorbed by SGLT2 inhibition.
Greater systemic exposure in patients with renal impairment did not result in a corresponding increase in renal glucose clearance, indicating that maximal inhibition of glucose reabsorption was achieved and that renal filtration rate controls urinary glucose excretion under these circumstances. Similar to previous findings, the plateau of the exposure–response relationship was achieved with the 20 mg dose in subjects with CLcr ≤50 ml min−1 [18, 25]. Irrespective of renal glucose clearance, there was a constant percentage inhibition of reabsorption of the filtered glucose load, indicating that inhibition of SGLT2-mediated glucose transport was independent of kidney function.
In conclusion, the findings from this study indicate that the pharmacokinetics and pharmacodynamics of dapagliflozin are affected by the degree of renal impairment. The kidney, along with liver, contributes to dapagliflozin metabolic clearance. Despite higher exposure, patients with T2DM and moderate or severe renal impairment have reduced renal glucose clearance as a consequence of their lower GFR relative to those with normal renal function and patients with T2DM and mild renal impairment. While the percent inhibition of renal glucose reabsorption via SGLT2 inhibition is independent of kidney function, a lower GFR results in reduced renal glucose clearance and urinary glucose excretion.
Acknowledgments
Editorial support was provided by William Watkins and Alexandra Silveira, PhD of PAREXEL. These data were presented in part at the American Society of Nephrology (ASN) Kidney Week 2011 Annual Meeting, November 8–13, Philadelphia, PA, USA and the European Association for the Study of Diabetes 2012 Annual Meeting, October 1–5, Berlin, Germany.
Competing Interests
All authors have completed the Unified Competing Interest form at http://www.icmje.org/coi_disclosure.pdf (available on request from the corresponding author) and declare support from Bristol-Myers Squibb Co. or AstraZeneca for the submitted work, all authors were stockholders and/or employees of Bristol-Myers Squibb Co. at the time the study was conducted and analyzed and no other relationships or activities that could appear to have influenced the submitted work. Dr Pfister is currently an employee of Quantitative Solutions Inc, Menlo Park, CA, USA.
Supporting Information
Additional Supporting Information may be found in the online version of this article at the publisher's web-site:
Figure S1
Iohexol clearance vs. (A) calculated Cockcroft–Gault clearance and (B) 24 h urinary CLcr in subjects with varying degrees of kidney function
Figure S2
Plasma concentrations of (A) dapagliflozin and (B) D3OG vs. time after a single dose of dapagliflozin 50 mg (day 1) in subjects with varying degrees of kidney function
Figure S3
Linear regression analyses for AUC(0,∞) of (A) dapagliflozin and (B) D3OG on total iohexol systemic clearance after a single dose of dapagliflozin 50 mg (day 1) in subjects with varying degrees of kidney function
Figure S4
Effect of dapagliflozin on mean (+SD) 24 h urinary glucose excretion at baseline (day −1) and after a single 50 mg dose (day 1), the first 20 mg day−1 dose (day 4) and the seventh 20 mg day−1 dose (steady-state, day 10). DAPA, dapagliflozin; T2DM, type 2 diabetes mellitus
Figure S5
Percent inhibition of renal glucose reabsorption vs. renal glucose clearance after seven 20 mg day−1 doses of dapagliflozin (steady-state, day 10) in subjects with T2DM and varying degrees of kidney function
Figure S6
Percent inhibition of renal glucose reabsorption vs. urinary protein after seven 20 mg day−1 doses of dapagliflozin (steady-state, day 10) in subjects with T2DM and varying degrees of kidney function
Table S1
Regression analyses for 6 h renal glucose clearance vs. 0–6 h urinary creatinine clearance with dapagliflozin treatment
Table S2
Effects of various degrees of renal impairment on fasting renal glucose clearance (ml min−1) with dapagliflozin treatment
References
- 1.Molitch ME, DeFronzo RA, Franz MJ, Keane WF, Mogensen CE, Parving HH. Diabetic nephropathy. Diabetes Care. 2003;26(Suppl. 1):S94–S98. doi: 10.2337/diacare.26.2007.s94. [DOI] [PubMed] [Google Scholar]
- 2.Miller M. Type II diabetes: a treatment approach for the older patient. Geriatrics. 1996;51:43–49. [PubMed] [Google Scholar]
- 3.Bakris GL, Fonseca VA, Sharma K, Wright EM. Renal sodium-glucose transport: role in diabetes mellitus and potential clinical implications. Kidney Int. 2009;75:1272–1277. doi: 10.1038/ki.2009.87. [DOI] [PubMed] [Google Scholar]
- 4.Kanai Y, Lee WS, You G, Brown D, Hediger MA. The human kidney low affinity Na+/glucose cotransporter SGLT2. Delineation of the major renal reabsorptive mechanism for d-glucose. J Clin Invest. 1994;93:397–404. doi: 10.1172/JCI116972. [DOI] [PMC free article] [PubMed] [Google Scholar]
- 5.Santer R, Kinner M, Lassen CL, Schneppenheim R, Eggert P, Bald M, Brodehl J, Daschner M, Ehrich JH, Kemper M, Li VS, Neuhaus T, Skovby F, Swift PG, Schaub J, Klaerke D. Molecular analysis of the SGLT2 gene in patients with renal glucosuria. J Am Soc Nephrol. 2003;14:2873–2882. doi: 10.1097/01.asn.0000092790.89332.d2. [DOI] [PubMed] [Google Scholar]
- 6.Wright EM, Hirayama BA, Loo DF. Active sugar transport in health and disease. J Intern Med. 2007;261:32–43. doi: 10.1111/j.1365-2796.2006.01746.x. [DOI] [PubMed] [Google Scholar]
- 7.Abdul-Ghani MA, DeFronzo RA. Inhibition of renal glucose reabsorption: a novel strategy for achieving glucose control in type 2 diabetes mellitus. Endocr Pract. 2008;14:782–790. doi: 10.4158/EP.14.6.782. [DOI] [PubMed] [Google Scholar]
- 8.Rahmoune H, Thompson PW, Ward JM, Smith CD, Hong G, Brown J. Glucose transporters in human renal proximal tubular cells isolated from the urine of patients with non-insulin-dependent diabetes. Diabetes. 2005;54:3427–3434. doi: 10.2337/diabetes.54.12.3427. [DOI] [PubMed] [Google Scholar]
- 9.Meng W, Ellsworth BA, Nirschl AA, McCann PJ, Patel M, Girotra RN, Wu G, Sher PM, Morrison EP, Biller SA, Zahler R, Deshpande PP, Pullockaran A, Hagan DL, Morgan N, Taylor JR, Obermeier MT, Humphreys WG, Khanna A, Discenza L, Robertson JG, Wang A, Han S, Wetterau JR, Janovitz EB, Flint OP, Whaley JM, Washburn WN. Discovery of dapagliflozin: a potent, selective renal sodium-dependent glucose cotransporter 2 (SGLT2) inhibitor for the treatment of type 2 diabetes. J Med Chem. 2008;51:1145–1149. doi: 10.1021/jm701272q. [DOI] [PubMed] [Google Scholar]
- 10.Han S, Hagan DL, Taylor JR, Xin L, Meng W, Biller SA, Wetterau JR, Washburn WN, Whaley JM. Dapagliflozin, a selective SGLT2 inhibitor, improves glucose homeostasis in normal and diabetic rats. Diabetes. 2008;57:1723–1729. doi: 10.2337/db07-1472. [DOI] [PubMed] [Google Scholar]
- 11.Ferrannini E, Ramos SJ, Salsali A, Tang W, List JF. Dapagliflozin monotherapy in type 2 diabetic patients with inadequate glycemic control by diet and exercise: a randomized, double-blind, placebo-controlled, phase III trial. Diabetes Care. 2010;33:2217–2224. doi: 10.2337/dc10-0612. [DOI] [PMC free article] [PubMed] [Google Scholar]
- 12.Bailey CJ, Gross JL, Pieters A, Bastien A, List JF. Effect of dapagliflozin in patients with type 2 diabetes who have inadequate glycaemic control with metformin: a randomised, double-blind, placebo-controlled trial. Lancet. 2010;375:2223–2233. doi: 10.1016/S0140-6736(10)60407-2. [DOI] [PubMed] [Google Scholar]
- 13.Nauck MA, Del PS, Meier JJ, Duran-Garcia S, Rohwedder K, Elze M, Parikh SJ. Dapagliflozin versus glipizide as add-on therapy in patients with type 2 diabetes who have inadequate glycemic control with metformin: a randomized, 52-week, double-blind, active-controlled noninferiority trial. Diabetes Care. 2011;34:2015–2022. doi: 10.2337/dc11-0606. [DOI] [PMC free article] [PubMed] [Google Scholar]
- 14.Strojek K, Yoon KH, Hruba B, Elze M, Langkilde AMPS. Effect of dapagliflozin in patients with type 2 diabetes who have inadequate glycaemic control with glimepiride: a randomized, 24-week, double-blind, placebo-controlled trial. Diabetes Obes Metab. 2011;13:928–938. doi: 10.1111/j.1463-1326.2011.01434.x. [DOI] [PubMed] [Google Scholar]
- 15.Henry RR, Murray AV, Marmolejo MH, Hennicken D, Ptaszynska A, List JF. Dapagliflozin, metformin XR, or both: initial pharmacotherapy for type 2 diabetes, a randomised controlled trial. Int J Clin Pract. 2012;66:446–456. doi: 10.1111/j.1742-1241.2012.02911.x. [DOI] [PubMed] [Google Scholar]
- 16.Wilding JP, Woo V, Soler NG, Pahor A, Sugg J, Rohwedder K, Parikh S. Long-term efficacy of dapagliflozin in patients with type 2 diabetes mellitus receiving high doses of insulin: a randomized trial. Ann Intern Med. 2012;156:405–415. doi: 10.7326/0003-4819-156-6-201203200-00003. [DOI] [PubMed] [Google Scholar]
- 17.Rosenstock J, Vico M, Wei L, Salsali A, List JF. Effects of dapagliflozin, an SGLT2 inhibitor, on HbA(1c), body weight, and hypoglycemia risk in patients with type 2 diabetes inadequately controlled on pioglitazone monotherapy. Diabetes Care. 2012;35:1473–1478. doi: 10.2337/dc11-1693. [DOI] [PMC free article] [PubMed] [Google Scholar]
- 18.Komoroski B, Vachharajani N, Boulton D, Kornhauser D, Geraldes M, Li L, Pfister M. Dapagliflozin, a novel SGLT2 inhibitor, induces dose-dependent glucosuria in healthy subjects. Clin Pharmacol Ther. 2009;85:520–526. doi: 10.1038/clpt.2008.251. [DOI] [PubMed] [Google Scholar]
- 19.Obermeier M, Yao M, Khanna A, Koplowitz B, Zhu M, Li W, Komoroski B, Kasichayanula S, Discenza L, Washburn W, Meng W, Ellsworth BA, Whaley JM, Humphreys WG. In vitro characterization and pharmacokinetics of dapagliflozin (BMS-512148), a potent sodium-glucose cotransporter type II inhibitor, in animals and humans. Drug Metab Dispos. 2010;38:405–414. doi: 10.1124/dmd.109.029165. [DOI] [PubMed] [Google Scholar]
- 20.Kasichayanula S, Liu X, Zhang W, Pfister M, LaCreta FP, Boulton DW. Influence of hepatic impairment on the pharmacokinetics and safety profile of dapagliflozin: an open-label, parallel-group, single-dose study. Clin Ther. 2011;33:1798–1808. doi: 10.1016/j.clinthera.2011.09.011. [DOI] [PubMed] [Google Scholar]
- 21.Krutzen E, Back SE, Nilsson-Ehle P. Determination of glomerular filtration rate using iohexol clearance and capillary sampling. Scand J Clin Lab Invest. 1990;50:279–283. doi: 10.3109/00365519009091579. [DOI] [PubMed] [Google Scholar]
- 22.Food and Drug Administration, Center for Drug Evaluation and Research (CDER) Guidance for industry: pharmacokinetics in patients with impaired renal function – study design, data analysis, and impact on dosing and labeling. 1998. US FDA Web site. Available at http://www.fda.gov/downloads/Drugs/GuidanceComplianceRegulatoryInformation/Guidances/ucm072127.pdf (last accessed 24 October 2011)
- 23.Cockcroft DW, Gault MH. Prediction of creatinine clearance from serum creatinine. Nephron. 1976;16:31–41. doi: 10.1159/000180580. [DOI] [PubMed] [Google Scholar]
- 24.Stevens LA, Coresh J, Greene T, Levey AS. Assessing kidney function – measured and estimated glomerular filtration rate. N Engl J Med. 2006;354:2473–2483. doi: 10.1056/NEJMra054415. [DOI] [PubMed] [Google Scholar]
- 25.Komoroski B, Vachharajani N, Feng Y, Li L, Kornhauser D, Pfister M. Dapagliflozin, a novel, selective SGLT2 inhibitor, improved glycemic control over 2 weeks in patients with type 2 diabetes mellitus. Clin Pharmacol Ther. 2009;85:513–519. doi: 10.1038/clpt.2008.250. [DOI] [PubMed] [Google Scholar]
- 26.American Diabetes Association. Diabetic nephropathy (position statement) Diabetes Care. 2002;25(Suppl. 1):S85–89. [Google Scholar]
- 27.Nolin TD. Altered nonrenal drug clearance in ESRD. Curr Opin Nephrol Hypertens. 2008;17:555–559. doi: 10.1097/MNH.0b013e3283136732. [DOI] [PubMed] [Google Scholar]
- 28.Verbeeck RK, Musuamba FT. Pharmacokinetics and dosage adjustment in patients with renal dysfunction. Eur J Clin Pharmacol. 2009;65:757–773. doi: 10.1007/s00228-009-0678-8. [DOI] [PubMed] [Google Scholar]
- 29.Harbourt DE, Fallon JK, Ito S, Baba T, Ritter JK, Glish GL, Smith PC. Quantification of human uridine-diphosphate glucuronosyl transferase 1A isoforms in liver, intestine, and kidney using nanobore liquid chromatography-tandem mass spectrometry. Anal Chem. 2012;84:98–105. doi: 10.1021/ac201704a. [DOI] [PMC free article] [PubMed] [Google Scholar]
- 30.Nishimura M, Naito S. Tissue-specific mRNA expression profiles of human phase I metabolizing enzymes except for cytochrome P450 and phase II metabolizing enzymes. Drug Metab Pharmacokinet. 2006;21:357–374. doi: 10.2133/dmpk.21.357. [DOI] [PubMed] [Google Scholar]
- 31.Lohr JW, Willsky GR, Acara MA. Renal drug metabolism. Pharmacol Rev. 1998;50:107–141. [PubMed] [Google Scholar]
- 32.Williams LR, Leggett RW. Reference values for resting blood flow to organs of man. Clin Phys Physiol Meas. 1989;10:187–217. doi: 10.1088/0143-0815/10/3/001. [DOI] [PubMed] [Google Scholar]
- 33.Miners JO, Knights KM, Houston JB, Mackenzie PI. In vitro-in vivo correlation for drugs and other compounds eliminated by glucuronidation in humans: pitfalls and promises. Biochem Pharmacol. 2006;71:1531–1539. doi: 10.1016/j.bcp.2005.12.019. [DOI] [PubMed] [Google Scholar]
- 34.Ishii Y, Takeda S, Yamada H. Modulation of UDP-glucuronosyltransferase activity by protein-protein association. Drug Metab Rev. 2010;42:145–158. doi: 10.3109/03602530903208579. [DOI] [PubMed] [Google Scholar]
Associated Data
This section collects any data citations, data availability statements, or supplementary materials included in this article.