

Abstract
Pediatric rhabdomyosarcoma (RMS) is a morphologically and genetically heterogeneous malignancy commonly classified into three histologic subtypes, namely, alveolar, embryonal, and anaplastic. An issue that continues to challenge effective RMS patient prognosis is the dearth of molecular markers predictive of disease stage irrespective of tumor subtype. Our study involving a panel of 70 RMS tumors has identified specific alternative splice variants of the oncogenes Murine Double Minute 2 (MDM2) and MDM4 as potential biomarkers for RMS. Our results have demonstrated the strong association of genotoxic-stress inducible splice forms MDM2-ALT1 (91.6% Intergroup Rhabdomyosarcoma Study Group stage 4 tumors) and MDM4-ALT2 (90.9% MDM4-ALT2-positive T2 stage tumors) with high-risk metastatic RMS. Moreover, MDM2-ALT1-positive metastatic tumors belonged to both the alveolar (50%) and embryonal (41.6%) subtypes, making this the first known molecular marker for high-grade metastatic disease across the most common RMS subtypes. Furthermore, our results show that MDM2-ALT1 expression can function by directly contribute to metastatic behavior and promote the invasion of RMS cells through a matrigel-coated membrane. Additionally, expression of both MDM2-ALT1 and MDM4-ALT2 increased anchorage-independent cell-growth in soft agar assays. Intriguingly, we observed a unique coordination in the splicing of MDM2-ALT1 and MDM4-ALT2 in approximately 24% of tumor samples in a manner similar to genotoxic stress response in cell lines. To further explore splicing network alterations with possible relevance to RMS disease, we used an exon microarray approach to examine stress-inducible splicing in an RMS cell line (Rh30) and observed striking parallels between stress-responsive alternative splicing and constitutive splicing in RMS tumors.
Introduction
Alternative splicing of pre-mRNA is the major contributor to proteome diversity and has an immense impact on the physiology of the cell both under normal and disease states. It is therefore no surprise that altered or aberrant splicing of several oncogenic and tumor suppressor genes and/or alterations in splicing regulatory pathways can play crucial roles in carcinogenesis. Alternative splicing of oncogenes murine double minute 2 (MDM2) and MDM4, chief negative regulators of the tumor suppressor p53, is another such phenomenon that has been observed frequently in several tumor types. At least 10 bona fide alternative splice variants of MDM2 have been reported in a variety of tumors including soft tissue sarcomas (STSs), ovarian and bladder cancers, glioblastomas, lymphomas, and breast cancer [1–10] with the most common splice variant being MDM2-ALT1, a form that is also induced in a variety of cell lines under genotoxic stress conditions [11,12]. MDM4 alternative splicing has been reported in lung carcinomas, thyroid tumors, and STS tumors [13–15] with MDM4-S and MDM4-211 being two common splice variants characterized in these studies. Nonetheless, the consequences and the relation of these altered splicing events to disease outcome in these tumors remain poorly understood.
RMSs are a relatively rare type of STS that arise primarily in children and adolescents and are currently histologically categorized into three main subtypes according to the International Classification of Rhabdomyosarcoma, namely, alveolar RMS (ARMS), embryonal RMS (ERMS), and anaplastic RMS. Although a variety of oncogenic events such as PAX3/7-FORKHEAD translocation and MYCN amplification as well as alterations in signaling pathways such as insulin receptor, nuclear factor kappa-light-chain-enhancer of activated B cells (NFKB), RAS, Sonic Hedgehog, and integrin-linked kinase have been implicated in the etiology of this disease [16–23], there remains the need for reliable molecular prognostic biomarkers for RMS. In fact, currently prognosis and treatment is based on age of onset, extent of disease following definitive surgery, and PAX3/7-FORKHEAD translocation status (for ARMS).
A phenomenon that has consistently been observed in RMS tumors is the alternative splicing of MDM2 and MDM4. For instance, Bartel et al. reported the occurrence of 10 different alternative MDM2 transcripts including common splice variants MDM2-ALT1 and MDM2-ALT2 in 75% (6 of 8) of RMS cell lines and 82% (9 of 11) of RMS patient tumor samples tested [7]. However, the exact significance of these splicing events in RMS prognosis is unknown. A previous study that endeavored to do so on a generalized STS tumor panel was hampered by the small representation of RMS tumors in the cohort (four RMS samples) and the fact that not all alternative MDM2 transcripts considered in this analysis may represent bona fide splice variants [1]. Nevertheless, the above study and others on ovarian and bladder cancers did reveal an association of advanced-stage tumors with the alternative MDM2 transcripts [1,2]. In the case of MDM4, previous studies have shown that at least one splice variant MDM4-S is associated with poor prognosis in a panel of 66 STS tumors that included 14 RMS samples [15,24], although the analysis did not focus on assessing this association in the individual STS tumor subtypes. Nevertheless, these studies indicate the prognostic potential of MDM2 and MDM4 alternative splicing.
In this study, we have endeavored to systematically characterize the alternative splicing of MDM2 and MDM4 in a panel of 70 RMS tumors that were segregated into the following three subtypes: ARMS, ERMS, and anaplastic RMS. We have shown an overt RMS subtype bias for the occurrence of the splice forms MDM2-ALT1 and MDM4-ALT2, which previous studies have shown to be induced on genotoxic stress treatment in multiple cell lines [11]. Importantly, we have observed a statistically significant association of these forms with advanced-stage and metastatic RMS disease that is not subtype specific, thereby highlighting their potential to serve as molecular prognostic markers for RMS irrespective of tumor subtype. Additionally, we show here that MDM2-ALT1 can increase the invasive behavior of RMS cell lines, indicating that this splice variant can influence RMS tumor metastatic behavior.
Further, we report a unique coordination in the alternative splicing of MDM2 and MDM4 in these RMS tumors similar to that observed during genotoxic stress response in cell lines [11]. This observation led us to investigate whether or not similarities exist between the splicing landscapes of RMS tumors and genotoxic stress response. Indeed, a transcriptome-wide analysis of stress-induced splicing changes in an RMS cell line revealed at least a few parallels between splicing patterns in tumors and genotoxic stress response. Essentially, our study has identified stress-responsive alternative splicing pathways as an important link in RMS etiology that can be potentially exploited for therapeutic purposes.
Materials and Methods
RNA Extraction from RMS Tissues and Reverse Transcription-Polymerase Chain Reaction Amplification of MDM2, MDM4, and GAPDH Transcripts
Human tissue samples were obtained from the Cooperative Human Tissue Network, Pediatric Division at Columbus Nationwide Children's Hospital after Institutional Review Board approval. All specimens were snap-frozen and stored at -80°C. The tissue was ground using a mortar and pestle in liquid nitrogen. RNA was extracted from tissue samples (25–40 mg) using RNeasy Mini Protocol (Qiagen, Valencia, CA). Typically 4 µg of RNA was used for reverse transcription (RT) in 20-µl reactions. Human MDM2 and MDM4 RNA from RMS cell lines and tumor and normal tissue samples were amplified using a nested set of primers as reported previously [11,25] or using the same internal primers in combination with the following external primers: HDM2 Ex Sn 2 (GAAGGAAACTGGGGAGTCT) and HDM2 Ex Asn 2 (GAGTTGGTGTAAAGGATG). For the detection of glyceraldehyde 3-phosphate dehydrogenase (GAPDH) transcripts, cDNA was amplified using a set of human GAPDH-specific primers: 5′-GATGCTGGCGCTGAGTACG-3′ (forward) and 5′-GCTAAGCAGTTGGTGGTGC-3′ (reverse). Additionally, all alternatively spliced variants of MDM2 and MDM4 amplification were confirmed by sequencing.
RT and Polymerase Chain Reactions
Typical RT reactions were carried out using 4 µg of RNA unless otherwise mentioned. Transcriptor RT enzyme (Catalog No. 03531287001) from Roche Diagnostics (Indianapolis, IN) was used for the cDNA synthesis reactions according to the manufacturer's instructions. Polymerase chain reactions (PCRs) were performed using Taq Polymerase from either Sigma-Aldrich (Catalog No. D6677) or Roche (St Louis, MO; Catalog No. D6677) under standard PCR conditions.
Statistical Analysis of Patient Outcome Data
GraphPad Prism 5.0b was used to perform statistical analyses for RMS subtype specificity of MDM2-ALT1 and MDM4-ALT2 splicing in the 70 patient tumor samples. The tumor patient outcome data were analyzed for association with alternative splicing of MDM2 and MDM4 by the Children's Oncology Group (COG). The MDM splicing variants were checked for association with the demographic characteristics of the patients within the RMS analytic population by the exact conditional test of proportions. Age at enrollment was checked in this manner as a categorical variable (<1, 1–9, ≥10 years) and also as a continuous variable using the t test or a one-way analysis of variance (ANOVA), as appropriate. When an ANOVA was done, the patient groups were assessed for significant differences using Tukey 95% confidence intervals (CIs) on the differences; only the statistically significant CIs (if any) were displayed. The outcomes in terms of event-free survival (EFS) and survival were compared among RMS patient groups defined by the presence or absence of each MDM splicing variant. EFS was taken to be the time from enrollment until disease progression, diagnosis of a second malignant neoplasm, death, or last patient contact, whichever occurred first. The EFS and survival of patient groups were each estimated by the Kaplan-Meier method. The relative risks for EFS event and death were compared across the groups using the log-rank test stratified by RMS risk classification (low, intermediate, or high), as appropriate. Additionally, proportional hazards regression model was used on each of the MDM splicing variants. The analyses were done in SAS 9.2 using PROC LIFETEST and PROC FREQ.
Western Blot Analysis and Antibodies
The normal and tumor tissue samples were ground using a mortar and pestle in liquid nitrogen and then lysed in NP-40 buffer. Equal amounts of protein (20 µg) were loaded in 1x sodium dodecyl sulfate (SDS) sample buffer onto a sodium dodecyl sulfate-polyacrylamide gel electrophoresis gel (SDS-PAGE) and blotted onto a polyvinylidene difluoride (PVDF) membrane and analyzed for expression of p53 (DO-1, sc-126, 0.2 µg/ml; Santa Cruz Biotechnology, Dallas, TX), p21 (F-5, sc-6246, 0.2 µg/ml; Santa Cruz Biotechnology), Bax (B-9, sc-7480, 0.2 µg/ml; Santa Cruz Biotechnology), and β-actin (AC-15, A5441; Sigma). For detection of LacZ, myc-tag antibody SC40 clone 9E10 (Santa Cruz Biotechnology) was used (0.2 µg/ml). To detect expression of MDM2-ALT1, the MDM2 N-20 antibody (sc-813; Santa Cruz Biotechnology) was used (0.2 µg/ml) and MDM4-ALT2 expression was verified with MDMX MaxPab (B01P; Abnova, Jhongli City, Taiwan). Protein sizes were determined using the Precision Plus Protein Dual Color Standards marker (Invitrogen, Grand Island, NY; Catalog No. 161-0374).
Cell Culture, Growth, and Transfection Conditions
ERMS cell lines RD2, Rh36, and SMS-CTR and ARMS cell lines Rh3, Rh18, Rh28, Rh30, and CW9019 were maintained in RPMI 1640 media supplemented with 10% FBS (Hyclone, Logan, UT), L-glutamine (Cellgro, 25-005 CI), and penicillin/streptomycin (Cellgro, 30-001 CI). Likewise, MCF7 breast cancer cells were maintained in Dulbecco's modified Eagle's medium (DMEM) supplemented with 10% FBS, l-glutamine, and penicillin/streptomycin. For damage treatment, cells were plated at 50% to 60% confluency, grown at 37°C overnight, treated with 0, 25, or 50 µM cisplatin, and harvested for total RNA (RNeasy Mini Protocol; Qiagen) after 24 hours; 1 mg/ml stock of cisplatin (manufactured for Teva Parenteral Medicine Inc, Irvine, CA, and obtained from the Nationwide Children's Hospital pharmacy) in sodium chloride solution (pH 3.2–4.4) was used for cisplatin treatment of cells. For transient transfection of Rh30 and C2C12 cells, Amaxa Cell Line Nucleofector V Kit was used according to the manufacturer's instructions with Nucleofector Program B-032. Cells were allowed to recover for 24 hours before further experiments were performed. The cells were then detached from the plates using Accutase (Innovative Cell Technologies, San Diego, CA; AT-104). Single cell suspensions were made, and cells were counted for use in the matrigel invasion assay and the focus-forming assay or for protein lysates for Western blot analysis of protein expression.
Plasmids and Protein Expression Constructs
LacZ, MDM2-ALT1, and MDM4-ALT2 cDNA were cloned into the BglII-XhoI sites of the Cre-inducible pCALL2 vector [26] whose β-galactosidase and neomycin resistance cassettes were previously excised by Cre recombinase to facilitate constitutive expression of the corresponding downstream cDNA. These constructs were used for transient overexpression of these proteins in Rh30 and C2C12 cells.
Matrigel Invasion Assay
Rh30 cells were electroporated with LacZ, MDM2-ALT1, or MDM4-ALT2 expression plasmids. Fifty thousand cells resuspended in RPMI 1640 with 2% FBS were seeded into BD BioCoat Matrigel Invasion Chambers (354480) with 8-µm pores according to the manufacturer's instructions and incubated in wells containing RPMI 1640 with 15% FBS for 20 hours. The inserts were then removed from the invasion chambers, and cells from the inner surface of the membrane were scraped off. Cells that were able to migrate through the membrane pores to the outer surface were then fixed, stained in toluidine blue, and mounted on slides. The slides were then imaged using the Olympus BX51 microscope (x10 magnification) equipped with a CX9000 camera. The cells that were present on the outer surface of the membrane (invading cells) were counted using the Stereo Investigator (9.10.5) and Neurolucida (4.60.1) software (MBF Biosciences, Williston, VT). Data were analyzed as the number of invading cells for each group (LacZ, MDM2-ALT1, and MDM4-ALT2 expression) from three independent experiments. Statistical analysis (unpaired Student's t test, 95%CI) was performed using the GraphPad Prism software version 6.0a.
96-Well Soft Agar Assays
The protocol for assessing the growth and foci-forming ability of transiently transfected cells in soft agar was adapted from Ke et al. [27]. Rh30 or C2C12 cells were electroporated with LacZ, MDM2-ALT1, or MDM4-ALT2 expression plasmids; 4000 cells/well for Rh30 and 1000 cells/well for C2C12 cells were mixed with 0.35% LMP agarose (Invitrogen; Catalog No. 15517-022) in DMEM or RPMI 1640 with 10% FBS and plated onto 0.7% base agar (LMP agarose in DMEM or RPMI 1640 with 10% FBS) in individual wells of a 96-well plate (Corning Costar 3595). The agar was allowed to solidify, and a feeder layer of media was added on top of the solid cell layer. Resazurin dye (final concentration of 44 mM) was added to the individual wells on day 0 (8-12 hours post seeding in soft agar), day 2, day 4, or day 7 of growth and incubated at 37°C for 4 hours after which fluorescence measurements (530-nm excitation and 590-nm emission) of resazurin reduction by cells was measured using a plate reader (Molecular Devices spectramax M2A). All fluorescence readings were corrected for background using a “blank” well containing only the soft agar layers without the cells. Two-way ANOVA with Holm-Sidak multiple comparisons test was performed between the LacZ, MDM2-ALT1, and MDM4-ALT2 expression groups across the different time points using GraphPad Prism version 6.0a. All significance values were determined at 95% CI.
Ribosomal RNA Profile Analysis
RH3 cells were subjected to 50 J/m2 UV 12 hours before harvest. Polysome preparations were performed as previously described [28]. RNA was precipitated with ethanol from each fraction and harvested using RNeasy Mini Protocol (Qiagen). Nested RT-PCR with MDM2- and MDM4-specific primers was performed [11]. Additionally, total RNA from each fraction of the sucrose gradient was separated using denaturing RNA gel electrophoresis and visualized by ethidium bromide staining to confirm the distribution of polyribosomes in higher fractions of the gradient.
Exon Microarray and Target Validation
Rh30 RMS cells were treated with 75 µM cisplatin for 12 hours, and RNA was harvested both from treated and normal cells according to current Affymetrix protocols. The Human GeneChip Human Exon 1.0 ST Array was then used to analyze the RNA changes in RNA splicing and expression levels. Three biologic replicates were performed for each condition (normal and cisplatin treated). Quality control (QC) plots were generated to highlight outlying arrays or potential issues with samples. All six hybridizations exceeded the expected quality control metrics. None of the samples had an outlying distribution, and after normalization, the distribution of probe intensities was the same for all the arrays. Validation of the microarray targets was performed in Rh30 and MCF7 cells treated with 75 µM cisplatin or 50 J/m2 UV for 24 hours. The primers used for target validation are listed in Table W2, A and B. For validation of alternative splicing of the targets, PCRs were typically carried out for 35 cycles at indicated annealing temperatures (Table W2A) and extension of 72°C. For validation of gene expression, semiquantitative PCRs were typically carried out at 25 cycles with indicated annealing temperatures (Table W2B) and extension of 72°C.
Exon Microarray Data Analysis
Affymetrix exon array data were analyzed using Partek Genomics Suite. Data were imported to Partek as Affymetrix.CEL files. Differentially expressed genes between normal and cisplatin-treated samples were determined using Partek's ANOVA algorithm, and alternative splicing was analyzed with the alternative splice detection algorithm. Genes that showed P < .05 with false discovery rate (FDR) correction were deemed significantly differentially expressed and differentially spliced. Differentially expressed genes included in analyses also demonstrated greater than two-fold increase in expression. For functional annotation analysis of the genes showing alternative splicing under cisplatin treatment, DAVID Bioinformatics Resources v6.7 [29] was used.
RMS Tumor Validation of Exon Array Targets
One microgram of the RNA isolated from the tumor samples A4217, A1063, and E2035 was used for RT. For use as controls, three separate preparations of normal skeletal muscle RNA were obtained from Life Technologies (Grand Island, NY; Lot 1201011 and Lot 1207012) and Clontech (Mountain View, CA; Lot 1202764A), and 1 µg of RNA from each sample was used for RT. The primers used for the various PCRs and the annealing temperatures are listed in Table W2A.
Results
Alternatively Spliced MDM2 Transcripts in Pediatric RMS Tumor Samples Reveal Subtype Specificity
We sought to understand if a specific pattern underlies the constitutive appearance of MDM2 splice variants in RMS tumors. To this end, we screened a total of 70 human RMS patient tumor samples classified into the following three RMS categories according to the revised International Classification of Rhabdomyosarcoma: ARMS (n = 27), ERMS (n = 23), and anaplastic RMS (n = 20). Besides the morphologic and pathologic examination, we characterized the alveolar samples by their PAX3-FKHR t(2;13)(q35;q14) and PAX7-FKHR t(1;13)(p36;q14) translocation status using a PCR-based assay as previously described [30]. These aberrations, resulting in a fusion of two transcription factors PAX3 and FKHR (FORKHEAD) or PAX7 and FKHR, respectively, are a common feature of most ARMS tumors. A total of 17 of 27 ARMS tumors (approximately 63%) were positive for the translocations with 8 of these samples showing the PAX3-FKHR t(1;13)(q35;q14) fusion and 9 samples showing the PAX7-FKHR t(2;13)(p36;q14) translocation. One normal tissue (N1008), obtained from a patient with RMS, was subjected to RT-PCR as negative control for the characteristic translocation (Table W1). In addition, one anaplastic RMS tumor (Ana2013) was positive for the PAX3-FKHR translocation.
We harvested RNA from the RMS tumors and assayed them for the presence of alternative splice forms of MDM2. We found that 23 of 27 (85%) ARMS tumors and 16 of 23 (70%) ERMS tumors expressed the genotoxic stress-inducible form MDM2-ALT1 (Figure 1A and Table W1) with no statistically significant difference (P > .2, χ2 test) between these two subtypes for the expression of MDM2-ALT1 (Figure 1B). In addition, there was no statistically significant correlation between the expression of MDM2-ALT1 and the characteristic translocations found in the alveolar subtype, although the number of samples studied was relatively small (n = 27). Strikingly, only 2 of 20 anaplastic RMS samples (10%; Figure 1A and Table W1) expressed MDM2-ALT1. This difference was statistically significant when compared to ARMS and ERMS tissues as indicated by χ2 test P value (P < .001; Figure 1B). We examined the normal human skeletal muscle tissue corresponding with five of these RMS patients, and we did not observe MDM2-ALT1 in any of the samples (Figure 1A). This indicates tumor specificity for the constitutive expression of MDM2-ALT1. Additionally, we did not observe any change in the GAPDH levels, used as control, in any of the RMS tumors or normal tissue from patients with RMS (Figure 1A). To conclude, we observed a strong correlation of the presence of MDM2-ALT1 with ARMS and ERMS but not with anaplastic RMS, indicating a subtype difference previously overlooked.
Figure 1.

MDM2-ALT1 and MDM4-ALT2 are expressed in human RMS tumor samples. (A) Total RNA was isolated and assayed for MDM2 and MDM4 splicing by RT-PCR in ARMS, ERMS, and anaplastic RMS samples as well as in matched normal muscle tissue of five patients with RMS. Occurrence of splice variants MDM2-ALT1 and MDM4-ALT2 is strongly associated with ARMS and ERMS subtypes but not with anaplastic RMS. (B) The statistical significance of the MDM2-ALT1 splicing between each group was determined using the two-sided Fisher exact test. There was a significant difference in expression of MDM2-ALT1 between the alveolar or embryonal subtypes compared to the anaplastic RMS subtype (P < .0001). (C) All the RMS tumor samples were analyzed for correlation of the presence of MDM4-ALT2 with subtypes of RMS as in B. There was a significant difference in expression of MDM4-ALT2 between the alveolar (P = .0007) or embryonal (P = .0017) subtypes compared to the anaplastic RMS subtype.
Alternatively Spliced MDM4 Transcripts in Pediatric RMS Tumor Samples
In response to genotoxic stress, MDM2-ALT1 is induced in coordination with alternative splice variants of close family member MDM4 [11]. Moreover, constitutively altered splicing of MDM4 has been reported in non-small cell lung cancer, papillary thyroid carcinoma, osteosarcoma, and several types of STSs [13–15,24]. Therefore, we assayed the RNA from the RMS tumor samples for the presence of MDM4 alternative transcripts. Four of the ARMS tumor samples that expressed neither full-length MDM4 nor its splice variants (A0295, A1067, A201, and A1049) were not included in the statistical analysis for MDM4 alternative splicing. Of the remaining ARMS samples, 10 of 23 (43%) expressed MDM4-ALT2 (Figure 1A and Table W1), a stress-inducible splice variant of MDM4 [11]. Of the ERMS samples, 9 of 23 (39%) expressed MDM4-ALT2 (Figure 1A and Table W1). Interestingly, none of the anaplastic RMS samples expressed MDM4-ALT2 (Figure 1A and Table W1), although 35% (7 of 20) of them expressed other MDM4 splice variants including another stress-inducible splice variant MDM4-ALT1 [11]. The presence of MDM4-ALT2 shows a strong correlation (P < .001, χ2 test) with ARMS and ERMS but not with anaplastic RMS (Figure 1C). In addition, there was no statistical difference (P > .2, χ2 test) between the alveolar and the embryonal subtypes for expression of MDM4-ALT2 (Figure 1C). Similar to MDM2-ALT1, the ARMS samples showed no statistically significant correlation (P > .2, χ2 test) between their translocation status and the presence of MDM4-ALT2 (n = 23). When we examined the five normal human tissues from patients with RMS, we did not observe MDM4-ALT2 in any of these normal tissues (Figure 1A). However, one RMS tumor and its corresponding normal tissue, N1007 and E1007, both expressed MDM4-ALT1 (Figure 1A).
Further, our analysis revealed coordination in MDM2-ALT1 and MDM4-ALT2 with approximately 24% (16 of 66) of the patient RMS samples analyzed showing the presence of both MDM2-ALT1 and MDM4-ALT2 transcripts. This co-occurrence of MDM2-ALT1 and MDM4-ALT2 was found to be statistically significant (Fisher exact test, P = .0126).
Alternative Splicing of MDM2 and MDM4 Transcripts Correlates with RMS Disease Stage
To assess the potential of these splicing events to serve as prognostic markers for RMS disease states, we followed the disease progression and survival of these patients in collaboration with the COG. Our analytic population for this study included only 53 of the original 70 patients whose tumors we assessed for MDM2 and MDM4 alternative splicing. This was due to unavailability of follow-up data for 16 patients (9 of whom were non-COG patients). One patient who presented with RMS as a secondary malignancy was also excluded from the analysis. We found no association between the incidence of MDM2 and MDM4 alternative splicing with demographic characteristics such as age, sex, or ethnicity of the patients. In addition, the EFS of the patients analyzed showed no correlation with these demographic features. However, statistical analysis comparing the progression of disease in these patients (analytic population with a non-missing measure for at least one MDM splice variant and available survival data) with the incidence of MDM2-ALT1 showed that these transcripts are strongly associated with high-risk RMS (P = .0288). Further, 91.6% (11 of 12) of the patients who presented with Intergroup Rhabdomyosarcoma Study Group (IRSG) stage 4 (positive for distant metastasis regardless of tumor size, site, invasiveness, and lymph node involvement) metastatic disease were positive for MDM2-ALT1 in their tumors (statistically significant, P = .0043; Table 1) compared to only 47.2% (17 of 36 were MDM2-ALT1 positive) of the patients who presented with IRSG stage 1, 2, and 3 disease. Similarly, the presence of MDM4-ALT2 in the tumors was associated significantly (P = .0274) with invasive T2 stage (tumor extension and/or fixation to surrounding tissue) RMS disease; 90.9% (10 of 11 tumors; Table 2) of MDM4-ALT2-positive tumors were of T2 stage, while only 48.3% (14 of 29; Table 2) MDM4-ALT2-negative tumors were T2 stage. Overall, we observed that 25 of 40 (62.5%) tumors that showed alternative splicing of either MDM2 or MDM4 or both were of the invasive RMS T2 type.
Table 1.
MDM2-ALT1.
| Characteristic | MDM2-ALT1 Present, n (%) | MDM2-ALT1 Absent, n (%) | P Value (Fisher Exact Test) |
| IRSG stage | |||
| I | 4 (14.3%) | 6 (30%) | .0043 |
| II | 6 (21.4%) | 1 (5%) | |
| III | 7 (25%) | 12 (60%) | |
| IV | 11 (39.3%) | 1 (5%) | |
| RMS risk level | |||
| Low | 4 (13.8%) | 5 (25%) | .0288 |
| Intermediate | 14 (48.3%) | 14 (70%) | |
| High | 11 (37.9%) | 1 (5%) |
| n (Estimated Survival %) | n (Estimated Survival %) | P Value (Log-Rank Test) | |
| Survival (5 years) | |||
| Low risk | 4 (66.7%) | 5 (100%) | .2395 |
| Intermediate risk | 14 (71.4%) | 14 (74.1%) | |
| High risk | 11 (67.5%) | 1 (100%) |
Table 2.
MDM4-ALT2.
| Characteristic | MDM4-ALT2 Present, n (%) | MDM4-ALT2 Absent, n (%) | P Value (Fisher Exact Test) |
| RMS T stage | |||
| T1 | 1 (9.1%) | 15 (51.7%) | .0274 |
| T2 | 10 (90.9%) | 14 (48.3%) |
| n (Estimated Survival %) | n (Estimated Survival %) | P Value (Log-Rank Test) | |
| Survival (5 years) | |||
| Low risk | 3 (100%) | 7 (85.7%) | .873 |
| Intermediate risk | 6 (62.5%) | 18 (77.4%) | |
| High risk | 4 (50%) | 7 (75%) |
Notably, we found that the association of MDM2-ALT1 with metastatic disease was not restricted to specific RMS subtypes. Of the 11 (11 of 12; i.e., 91.6%) IRSG stage 4 metastatic tumors analyzed that expressed MDM2-ALT1, 6 were alveolar (54.5%) and 5 were of the embryonal (45.5%) subtype, indicating that MDM2-ALT1 is an important biomarker of metastatic disease for both ARMS and ERMS subtypes. Taken together, our study highlights that the alternative splice variants MDM2-ALT1 and MDM4-ALT2 can potentially predict RMS disease severity, thereby serving as useful prognostic markers for the most common RMS subtypes, ARMS and ERMS. However, despite their strong correlation with high-risk RMS, these splice variants do not seem to be predictors of patient survival within this disease category (Figure 2, A and B). In this study, the patients in the high-risk category responded unusually well to treatment and showed better EFS (log-rank P = .3763 for association of EFS with disease risk level, data not shown) compared to historically recorded data for this category.
Figure 2.

MDM2-ALT1 and MDM4-ALT2 splicing do not correlate with patient survival. Five-year survival estimates of the patients in each risk category were made using the Kaplan-Meier method. No significant correlation was observed when the proportional hazards regression model was used for comparing the survival of patients (stratified according to RMS risk level) with occurrence of splice variants (A) MDM2-ALT1 (stratified log-rank P = .2395) and (B) MDM4-ALT2 (stratified log-rank P = .8730).
MDM2-ALT1 and MDM4-ALT2 enhance anchorage-independent growth of untransformed myoblasts C2C12 and Rh30 RMS cells. As MDM2-ALT1 and MDM4-ALT2 are strongly associated with alveolar and embryonal tumors and also correlate with high-risk disease in these categories, we wanted to test the possibility that these splice variants can contribute to oncogenic transformation. Anchorage-independent growth or the ability of cells to form foci when resuspended in solid media such as soft agar is an indicator of transformed growth. Therefore, we assessed the anchorage-independent growth of untransformed C2C12 myoblast cells that transiently expressed LacZ, MDM2-ALT1, or MDM4-ALT2 for 0, 2, 4, or 7 days by measuring the reduction of resazurin dye by the cells (a measure of the metabolic activity of live and proliferating cells). Indeed, we observed that the C2C12 myoblasts expressing MDM2-ALT1 and MDM4-ALT2 showed significantly more growth (P < .05) at day 7 in soft agar compared to the LacZ-expressing cells (Figure 3A).
Figure 3.
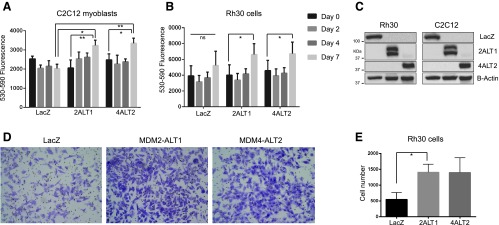
MDM2-ALT1- and MDM4-ALT2-expressing cells show increase in migration and anchorage-independent growth. Rh30 RMS cells and C2C12 myoblasts were transfected with LacZ, MDM2-ALT1, or MDM4-ALT2 expression constructs. The cells were used for soft agar and/or matrigel invasion assays. (A) C2C12 cells expressing LacZ, MDM2-ALT1, or MDM4-ALT2 were seeded. Their growth was monitored at days 0, 2, 4, and 7 after seeding. Data from three independent experiments with triplicate wells for each transfection group are represented graphically with SEM error bars. C2C12 cells expressing MDM2-ALT1 (P = .0117) and MDM4-ALT2 (P = .0054) show significantly more anchorage-independent growth in soft agar at day 7 compared to LacZ-expressing cells. Additionally, comparison of growth in soft agar between days 0 and 7 showed significant increases in the MDM2-ALT1 (P = .0025) and MDM4-ALT2 (P = .0296) groups but not in LacZ. (B) Rh30 cells expressing LacZ, MDM2-ALT1, or MDM4-ALT2 were similarly assayed for anchorage-independent growth for 7 days in soft agar. MDM2-ALT1 (P = .0109) and MDM4-ALT2 (P = .0389) expression caused significant increase in growth of Rh30 cells at day 7 compared to day 0. LacZ-expressing Rh30 cells however showed no significant changes in growth in soft agar between days 0 and 7. (C) Western blots confirming expression of LacZ, MDM2-ALT1, and MDM4-ALT2 in Rh30 and C2C12 cells at 24 hours post nucleofection. (D) Rh30 cells expressing MDM2-ALT1 and MDM4-ALT2 show increased migration through matrigel-coated membranes (8-µm pore size) compared to Lac-Z-expressing Rh30 cells. Representative x10 magnification images of Rh30 cells post migration are shown here. (E) The matrigel invasion experiments were performed in three independent trials, and the number of invasive cells was counted and represented graphically with SEM error bars for each group. Unpaired Student's t test comparing the mean number of cells in each group with LacZ-expressing cells indicated a statistically significant increase (P = .0417, 95% CI) in invasive behavior of MDM2-ALT1-expressing Rh30 cells.
Similarly, Rh30 RMS cells assayed for the effects of MDM2-ALT1 and MDM4-ALT2 on their anchorage-independent growth showed statistically significant (P < .05) increase in growth in solid soft agar media between days 0 and 7, whereas the Rh30 cells expressing LacZ showed no significant changes in growth under the same conditions (Figure 3B). Overexpression of the proteins from the transfected constructs was verified in immunoblot analysis experiments (Figure 3C). Single bands were detected for overexpressed LacZ (myc-tag antibody) at 120 kDa and for MDM4-ALT2 (MDM4 antibody) at approximately 40 kDa. Overexpressed MDM2-ALT1 was detected as a specific doublet by the MDM2 N20 antibody at about 40 kDa, possibly due to the usage of an alternate translation initiation codon downstream of the canonical start site in the MDM2-ALT1 cDNA clone or posttranslational modifications of the overexpressed protein. The transfected cells were also used for the migration studies (below).
MDM2-ALT1 and MDM4-ALT2 expression leads to increased invasive behavior of RMS cells. Due to the strong association of MDM2-ALT1 and MDM4-ALT2 with metastatic RMS, we wanted to test the possibility that expression of these splice forms could affect the invasive behavior of RMS cell lines reflective of the metastatic potential of these cells. To this end, we transiently transfected Rh30 cells (which do not constitutively express MDM2-ALT1 or MDM4-ALT2) with plasmid constructs expressing myc-tagged MDM2-ALT1, MDM4-ALT2, or LacZ (negative control) and assessed their invasion through a matrigel-coated membrane in response to chemotactic gradient (2% FBS to 15% FBS media). Our results showed that MDM2-ALT1 and MDM4-ALT2 expression results in increased invasiveness of Rh30 cells through thematrigel membrane (Figure 3D). Quantification of the number of invaded cells followed by statistical analysis revealed the increase in invasion by MDM2-ALT1-expressing Rh30 cells to be statistically significant (P < .05) compared to the LacZ-expressing Rh30 cells (Figure 3E).
Effect of MDM2 and MDM4 alternative splicing on the p53 tumor suppressor pathway in tumor tissues. The expression of MDM2 and MDM4 alternative transcripts has been shown to affect the p53 pathway [1,12,13,25,31,32]. To examine the impact of MDM2-ALT1 and MDM4-ALT2 expression on the p53 pathway in RMS tumors, we assessed the levels of p53 and two of its downstream targets by Western blot analysis in the four pairs of tumors for which we were also able to obtain their corresponding matched normal tissues. All four tumors examined expressed MDM2-ALT1, MDM4-ALT2, or both (Figure 1A and Table W1). We found that p53 was overexpressed in all four of the tumors compared to their paired normal tissue (Figure 4). As p53 overexpression in tumors often results from the presence of stabilizing but inactivating p53 gene mutations, we sequenced the “hot spot“ region of p53 cDNA from these patient samples, exon 3 through exon 8, where the majority of known p53 mutations are found. All the samples examined were wild type for p53.
Figure 4.

Human RMS tumors show alterations in p53 tumor suppressor pathway. Tissue lysates of four RMS tumors and their matched normal samples were examined for protein levels of p53 (DO-1; Santa Cruz Biotechnology) and its downstream transcriptional targets p21 (F-5; Santa Cruz Biotechnology) and Bax (B-9; Santa Cruz Biotechnology). β-Actin (AC-15; Sigma) was used as a loading control. Of the four paired samples, p53 is overexpressed in all tumor tissues when compared to corresponding normal tissue (T, tumor tissues; N, normal muscle), although an up-regulation of both p21 and Bax is seen in only one of the four tumors.
Additionally, we sequenced the p53 cDNA from 21 ARMS, 17 ERMS, and 19 anaplastic RMS tumors for which sufficient material was available and discovered mutations in 3 of 21 ARMS tumors, 1 of 17 ERMS tumors, and 4 of 19 anaplastic RMS tumors. We did not find any significant correlation between the presence of p53 mutations and the presence of MDM2-ALT1 and/or MDM4-ALT2 transcripts. Indeed, our data show that p53 mutations are prevalent in only 14% of the RMS tumors tested. This is in accordance with other studies in which low frequency of p53 mutations has been reported in RMS tumors in general [33].
Despite the overexpression of p53 in the four tumor samples (A0897, E1099, E1007, and A1008), it is possible that this crucial tumor suppressor pathway has been inactivated downstream of p53 rendering it nonfunctional. Therefore, we tested the transcriptional activity of p53 by examining the protein levels of p53 target genes p21 (mediator of p53-dependent cell cycle G1 phase arrest) and Bax (proapoptotic gene involved in induction of p53-mediated apoptosis) in these tumors in comparison with the corresponding normal tissues by Western blot analysis using β-actin as loading control. As predicted by increased p53 protein levels, two of the tumors examined (A1008 and E1009) showed increased p21 levels compared to their matching normal tissues (Figure 4). However, A0897 did not express p21, suggestive of a lack of transcriptional activity of p53 in this tumor (Figure 4). Bax was also upregulated in only two of the tumor samples (Figure 4) when compared to the normal tissues (A0897 and A1008). Although the number of tumors examined in this study is small (the chief limitation being the lack of availability of matching normal muscle tissue), it is apparent that in the RMS tumors expressing MDM2 and MDM4 alternative transcripts, the p53 pathway has been inactivated through different mechanisms. Accordingly, we observed an inconsistency between p53 expression and activation of one or more of its downstream target genes in three of the four tumor samples (A0897, E1099, and E1007).
Stress Induction of Alternatively Spliced MDM2 and MDM4 Transcripts in RMS Cell Lines
MDM2-ALT1 and MDM4-ALT2 are generated on genotoxic stress induction such as UV and cisplatin treatment in a variety of cell lines in a p53-independent manner [11,12]. We sought to determine whether or not the stress-inducible alternative splicing pathway was functional in RMS cell lines. When the RMS cell lines RD2, Rh28, RH18, Rh3, CW9019, RH36, SMS-CTR, and Rh30 were exposed to increasing doses of UV (0, 10, 30, and 50 J/m2) or increasing doses of cisplatin (0, 25, and 50 µM in SMS-CTR and Rh30) for 24 hours, we saw a time- and dose-dependent induction of MDM2-ALT1 and MDM4-ALT2 in all of the cell lines tested (Figure 5, A and B, and data not shown) irrespective of their p53 status. This confirms our previous finding that MDM2 alternative splicing is p53 independent [11]. These results also indicate that the pathways dictating stress-inducible MDM2 and MDM4 alternative splicing are intact and can be activated in all the RMS cell lines tested. These findings raise the possibility that in the RMS tumors in which these splice variants are constitutively expressed, similar splicing regulatory pathways may be continuously activated even in the absence of stress.
Figure 5.
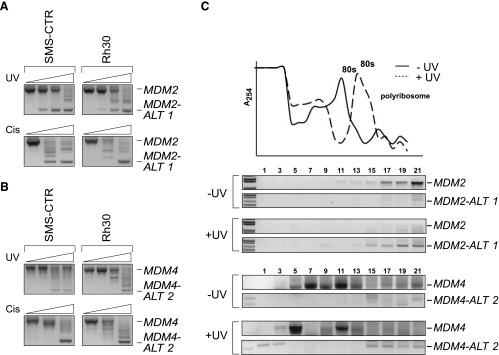
Alternatively spliced forms of MDM2 and MDM4 are induced by genotoxic stress in RMS cell lines. SMS-CTR and Rh30 RMS cell lines were treated with increasing amounts of UV light (0, 10, 30, and 50 J/m2) or increasing concentrations of cisplatin (0, 25, and 50 µM) as represented by the corresponding increase in height of the triangle from left to right. Total RNA was harvested at 24 hours and subjected to nested RT-PCR for MDM2 and MDM4. In response to increasing doses of UV and cisplatin, the SMS-CTR and Rh30 cell lines show increased induction of (A) MDM2-ALT1 and (B) MDM4-ALT2. (C) For the ribosome profile analysis, RH3 cells were exposed to 0 or 50 J/m2 UV and harvested 12 hours after treatment. Cytoplasmic extracts were separated on 15% to 50% linear sucrose density gradients. RNA from each fraction was taken and subjected to nested RT-PCR for MDM2 and MDM4. Damage promoted enhanced association of the MDM2-ALT1 and MDM4-ALT2 transcripts with polysomes in RH3 cells. Absorbance (A254) of RNA from each fraction and the corresponding ribosome profile in normal (-UV) and treated (+UV) cells are represented in the graph.
MDM2-ALT1 and MDM4-ALT2 transcripts show polysomal loading. Although the alternative transcripts MDM2-ALT1 and MDM4-ALT2 are readily detectable under stress and in certain tumor types, it has proven to be a challenge to detect the proteins generated from them in vivo. This is at least in part due to the unavailability of efficient antibodies for MDM2-ALT1 and MDM4-ALT2 recognition. In addition, most MDM2 and MDM4 antibodies are targeted against internal epitopes, which are removed from the alternatively spliced isoform and therefore not usable to assess de novo protein synthesis. We assessed the efficacy of a variety of MDM2 and MDM4 antibodies with C-terminal epitopes or whole recombinant protein epitopes in detecting endogenous MDM2-ALT1 and MDM4-ALT2 but failed to reliably detect these proteins in vivo. We therefore resorted to an indirect method of assessing protein synthesis from MDM2-ALT1 and MDM4-ALT2 transcripts and used sucrose gradient analysis to determine the association of these transcripts with polyribosomes [28]. We collected different mRNA fractions from RH3 (RMS cell line) cells that were either untreated or treated with UV (50 J/m2). We then queried for MDM2 and MDM4 isoforms by RT-PCR analysis on these fractions. We observed the enhanced presence of MDM2-ALT1 and MDM4-ALT2 in the polyribosome fractions (15–21) of the sucrose gradients after exposure to UV (Figure 5C). The presence of the MDM2-ALT1 and MDM4-ALT2 transcripts in the polyribosome fraction is consistent with their acting as substrates for cellular translational machinery in RH3 cells after UV exposure (Figure 5C).
Microarray detection of stress-responsive alternative splicing networks in RMS cell lines. As RMS cell lines show coordinated splicing of MDM2-ALT1 and MDM4-ALT2 on treatment with genotoxic stress-inducing agents, we wanted to explore the possibility that MDM2 and MDM4 form part of a stress-inducible alternative splicing network that can affect the fate of the cell. To this end, we chose to perform an exon microarray (Affymetrix Human Exon 1.0 ST array) on Rh30 cells treated with 75 µM cisplatin and assessed changes in the expression and splicing patterns of various genes in comparison with untreated Rh30 cells (Figure 6A). Importantly, Rh30 cells express MDM2-ALT1 and MDM4-ALT2 alternative splice variants only on stress induction. All microarray targets showing alternative splicing at P value < .05 with FDR correction were considered as being alternatively spliced under cisplatin and used for further analysis. Similarly, only the microarray targets showing two-fold change in expression levels and P < .05 with FDR correction were considered as showing differential gene expression. Overall, we observed that 60–85% of the genes showed no changes in expression or splicing on cisplatin treatment (NC: 10,604 genes); 33.1% of the genes showed altered splicing but no change in expression (AS: 5768); 4.57% of the genes showed differential expression and altered splicing (AS + DE: 796), while 1.47% of the genes showed differential expression but not splicing (DE: 256; Figure 6B). The top 700 genes in the AS, DE, and AS + DE categories are listed in Table W3, A to C.
Figure 6.
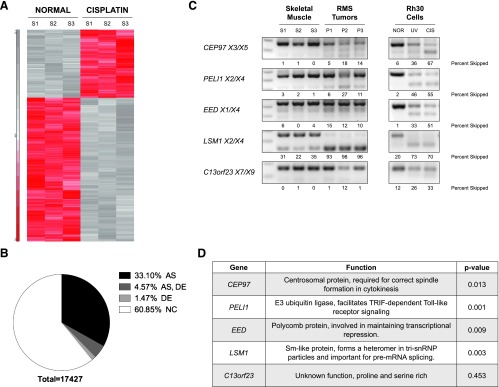
Stress-induced alternative splicing networks share common features with RMS tumors. Human Exon 1.0 ST Array was used to examine alternative splicing events induced on cisplatin treatment of Rh30 cells (75 µM for 12 hours). (A) Heat map displaying differential expression of genes between normal and cisplatin-treated Rh30 cells for three biologic replicates. (B) Pie chart displaying the number of genes showing alternative splicing and/or differential expression and those that remain unchanged on cisplatin treatment. The DE grouping contains genes with two-fold changes in expression levels and P < .05 with FDR correction. The AS group contains all genes that show alternative splicing at P value < .05 with FDR correction. (C) Pre-mRNA from three RMS tumors (alveolar A4217 and A1063 and embryonal E2035) that showed the presence of both MDM2-ALT1 and MDM4-ALT2 and normal skeletal muscle tissue (Clontech and Life Technologies) was assayed for the splicing of five targets identified in the exon microarray. All the RMS tumors examined in comparison with normal skeletal muscle tissue showed splicing patterns similar to cisplatin-treated Rh30 cells. (D) Table showing the documented functions of CEP97, PELI1, EED, LSM1, and C13orf23, which were examined for altered splicing in the RMS tumors. The P values indicated in the table represent the significance of the difference in the expression of the cassette exon (Figures 5C and W1) in these genes between normal and stress conditions as determined using the Partek software.
A subset of 14 alternatively spliced targets identified in the microarray (analyzed using the Partek Genomics software) as showing marked changes in inclusion or exclusion of specific exons (Figure W1, data not shown) was chosen for validation by PCR in the Rh30 cell line. We confirmed that 12 (12 of 14, 85.7%) of these targets recapitulated the results from the array and conformed to the microarray-predicted changes in splicing of specific cassette exons (Figures 6C and W2A), while 2 of these targets showed changes in transcript levels but no alternative splicing (data not shown). Importantly, MDM2 was also identified in our microarray as being differentially spliced on cisplatin treatment (P = .00193). MDM4, although verified as showing altered splicing patterns in cisplatin-treated Rh30 cells, could not be detected in our exon microarray possibly due to limitations in the available probe sets. We additionally validated splicing changes in cisplatin-treated MCF7 cells and observed that 11 of 16 (69%) targets tested were positive for alternative splicing changes as predicted by the exon microarray (Figure W2A). In addition, we observed an overlap in the stress-induced splicing of some of the targets identified in our cisplatin treatment microarray with camptothecin drug-induced alternative splicing (EED, PAPOLG, and THUMPD2; Figures 6C and W2A) [34]. We also chose a subset of eight differentially expressed genes for validation in Rh30 cells by semiquantitative PCR. Of the eight targets tested, seven genes recapitulated the expression changes predicted by the microarray under cisplatin treatment (Figure W2B).
We then used the DAVID online bioinformatics tool (gene ontology analysis) to determine if the stress-inducible alternative splicing events identified in our exon microarray are part of splicing networks affected in various cellular processes or signaling pathways (alternative splicing P values < .05 with FDR correction in cisplatin vs control). Interestingly, Kyoto Encyclopedia of Genes and Genomes (KEGG) [35,36] pathways associated with the alternatively spliced genes showed the highest enrichment in cancer and related pathways including the cell cycle and p53 signaling pathway (Figure W3). These pathways are mapped out as shown in Figure W4 with the labeling indicating the genes in these pathways that show significantly altered splicing under cisplatin treatment (Figure W4, A and B). The high correlation between genotoxic stress-induced (cisplatin treatment) alternative splicing changes and genes involved in cancer is suggestive of the presence of cognate splicing networks in cancer and stress response.
RMS tumors share features of stress-responsive alternative splicing networks. To test the possibility that RMS tumors show splicing patterns similar to stress response aside from MDM2 and MDM4 alternative splicing, we assessed the pre-mRNA splicing of five target genes (identified from exon microarray) in two alveolar (A4217 and A1063) and one embryonal tumor (E2035) from our original panel in comparison with normal human muscle tissue mRNA (Life Technologies and Clontech; Figure 6C). All of these tumors showed the presence of MDM2-ALT1 and MDM4-ALT2. Indeed, the splicing of four of these genes (CEP97, PELI1, EED, and LSM1) in our tumor samples was similar to their splicing patterns observed (in exon microarray and splicing validation experiments) in cisplatin-treated Rh30 cells (Figure 6, C and D). One of the targets (C13orf23) however showed no change in splicing between normal muscle and tumor tissue (Figure 6C) as predicted by the microarray (P = .453), although the Rh30 and MCF7 cell lines showed cisplatin and UV-induced alternative splicing of this pre-mRNA (Figures 6C and W2). This provides evidence that at least a part of the splicing landscape in RMS tumors has shared components with stress response splicing pathways.
Discussion
MDM2-ALT1 and MDM4-ALT2 Linked to Advanced-Stage Disease
Our study has demonstrated strong subtype specificity for the occurrence of stress-inducible splice variants MDM2-ALT1 and MDM4-ALT2 with the ARMS and ERMS subtypes but not with anaplastic RMS. Statistical analysis of patient survival and disease outcome in relation to these alternative splice forms showed the highly significant correlation between the presence of MDM2-ALT1 and MDM4-ALT2 transcripts and advanced-stage RMS disease.
Indeed, 11 of 12 (91.6%) patients with advanced metastatic IRSG stage 4 disease expressed MDM2-ALT1 predicting an overall poor outcome for these patients solely due to the advanced stage of the disease. However, stratification of patient outcome according to disease risk level showed no significant association of MDM2-ALT1 with EFS within the high-risk group. This is because high-risk patients in this study had an increased survival rate when compared to historical data (61.4% in this study versus the historically recorded 25% EFS estimate for this group). This could be due to changes in treatment regimens over the years that could have altered the response of this group of patients to chemotherapy. In addition, it is possible that the small sample numbers of high-risk disease patients (n = 12) involved in this study could have led to an overrepresentation of the patients with a better treatment response. Moreover, it should be noted that only 1 of the 12 high-risk patients lacked expression of MDM2-ALT1, and this low number of samples may be insufficient for adequate statistical analyses. However, it may be possible that MDM2-ALT1 occurrence in high-risk RMS disease could be associated with better patient prognosis within this risk category. Unfortunately, MDM2-ALT1 status is not available for the historical data that predict only 25% 5-year EFS for the high-risk group. Therefore, a study on a much larger scale with high-risk RMS patients would be required to test this possibility.
Strikingly, the 11 IRSG stage 4 tumors that were MDM2-ALT1 positive comprised almost equal numbers of alveolar (6 of 11; i.e., 54.5%) and embryonal (5 of 11; i.e., 45.5%) subtypes. This is an important observation as it points toward MDM2-ALT1 as a novel predictor of metastatic disease transcending the two main RMS subtypes. To date, prognosis assessment for RMS has chiefly relied on subtype histology (alveolar or embryonal), number of metastases, regional lymph node involvement, and molecular markers such as PAX/FOXO1 translocation status of the tumor. However, the molecular factors are geared more toward predicting disease outcome for the alveolar subtype and there is no reliable marker available for metastatic disease of both the embryonal and alveolar subtypes. Our observations show that MDM2-ALT1 can potentially serve as a prognostic marker for metastatic disease irrespective of tumor histology. In conclusion, our study and those of others have irrefutably shown that altered MDM2 and MDM4 splicing is a persistent feature of RMS tumors and our study is the first to show a strong subtype-independent association of stress response splice variants MDM2-ALT1 and MDM4-ALT2 with advanced-stage RMS disease.
p53 Pathway and MDM2 and MDM4 Splicing
We observed a very low frequency of p53 mutations (14%) in the RMS tumors that we tested, thereby corroborating previous studies in which mutant p53 was a rare feature in pediatric RMS [33]. Given that p53 is perhaps the most commonly mutated gene in human cancers, and that p53 mutations are absent in a larger percentage of RMSs, it is an intriguing possibility that altered splicing of MDM2 and MDM4 is an important step that leads to oncogenic transformation. However, it is also possible that in a majority of these tumors the p53 tumor suppressor pathway is disabled through an alternative mechanism or that other oncogenic programs are at play.
Indeed, our results, despite the small sample number, are suggestive of a non-functional p53 tumor suppressor pathway or an uncoupling of the normal pathway in these tumors. This may be attributed either to misregulations in the p53 pathway or to additional, potentially p53-independent functions of the alternatively spliced forms of MDM2, MDM4, or both. This is consistent with previous studies on STS tumors in which a statistically significant association was observed between MDM2 alternative splice variant expression and elevated p53 protein levels [1].
MDM2-ALT1 and MDM4-ALT2 as Potential Transforming Factors
We have shown here that MDM2-ALT1 and MDM4-ALT2 when expressed in Rh30 cells, which are heterozygous for the R273C p53 missense mutation (inactive p53) [37,38], can directly affect their migration through a matrigel membrane (reflective of metastatic behavior) and also their anchorage-independent growth in soft agar. Importantly, MDM2-ALT1 and MDM4-ALT2 cause an increase in the anchorage-independent growth of untransformed C2C12 cells, suggesting that they possibly play a role in transformation of cells in the context of RMS. However, the mechanism by which they function in oncogenesis is not yet known. The inhibition of p53 by full-length MDM2 relies on the p53-binding domain [39,40], which is excluded in MDM2-ALT1. Therefore, it is unlikely that MDM2-ALT1 can directly affect p53 activity. However, MDM2-ALT1 has been shown to interact with and sequester full-length MDM2 in the cytoplasm [11,12], thereby potentially stabilizing p53. This could be a possible mechanism by which p53 levels are elevated in RMS tumors expressing MDM2-ALT1. Alternatively, MDM2 has documented p53-independent roles, which become apparent in the absence of p53 [41–45]. The exogenous expression of MDM2-ALT1 has been shown to have oncogenic functions in p53-null mouse embryonic fibroblasts and NIH3T3 cells. Further, the expression of Mdm2-b (mouse homolog of MDM2-ALT1) under a glial fibrillary acidic protein promoter spontaneously induced the formation of myeloid sarcomas and B cell lymphomas in transgenic mice [46]. It is therefore likely that MDM2-ALT1 could retain or even affect the p53-independent properties of full-length MDM2, thereby influencing tumor formation in a p53-independent context as well. Furthermore, it has been shown that MDM2 gene dosage can affect the rate of tumorigenesis and also tumor spectrum in mice with compromised Arf and/or p53 [43,45,47]. Therefore, the presence of MDM2 splice variants that are capable of interacting with and sequestering full-length MDM2 can be viewed as a means of altering the MDM2 gene dosage, which can eventually affect tumorigenesis and/or metastasis.
Additionally, the presence of MDM4 alternative transcripts could influence tumorigenesis by affecting MDM4 gene dosage in a scenario similar to MDM2. For instance, MDM4-S, a splice variant of MDM4 that lacks exon 6, is associated with poor prognosis especially in some types of sarcomas. This is mainly due to the fact that high MDM4-S levels result in low levels of full-length MDM4, and consequently, this selective pressure leads to MDM2 overexpression and/or p53 mutations [15,24]. It is therefore possible that MDM4-ALT2, which is architecturally similar to MDM2-ALT1, could have functions that manipulate the p53 pathway leading to cancer. Furthermore, distinct functions have been described for MDM2 and MDM4 in the control of p53 activity [48], although the collaboration of MDM2 and MDM4 is important for the regulation of p53 [49,50]. Therefore, we speculate that the coordinated splicing of MDM4-ALT2 with MDM2-ALT1 could also affect tumorigenesis in these RMS samples in ways unique to each. It is also possible that other tumor suppressor or oncogenic pathways besides the p53-MDM2 axis have been affected by global changes in the splicing pathways in the RMS tumors that impact tumorigenesis.
Genotoxic Stress Response and Cancer: Similarities in Splicing Networks
Our data mining experiments using DAVID Bioinformatics Resources for gene ontology analysis implicated cancer-related pathways as being highly enriched for alternative splicing under DNA damage or genotoxic stress. Similar observations were made by Muñoz et al. in that genes involved in cell cycle, cancer, and cell death were highly enriched for alternative splicing events on UV irradiation (genotoxic stress) [51]. Taken together, these observations suggest that gene expression regulation through alternative splicing is an important component of cellular stress response (including cell cycle checkpoint, DNA damage repair, and apoptotic and other tumor-suppressive pathways frequently misregulated in cancer). Strikingly, when three RMS tumors from our original panel, which were constitutively positive for both MDM2-ALT1 and MDM4-ALT2 splicing, were tested for other stress-responsive splicing patterns (based on exon microarray prediction), we found that in four of five genes assayed, the RMS tumors showed similarities to cisplatin-treated Rh30 cells. This suggests that at least a part of the splicing networks that are constitutively altered in these tumors bear features reminiscent of stress-responsive alternative splicing changes.
These data raise the possibility that activation of stress response measures including alternative splicing pathways due to prolonged exposure to stress stimuli can pave the way for tumorigenesis. It has been implied in various studies that persistent DNA damage signals can induce some cells to respond by evading apoptosis and entering a phase of senescence [52–57], thereby setting the stage for carcinogenesis. It is possible that the RMS tumors examined here arose under similar circumstances in that persistent genotoxic stress response events could have contributed to splicing alterations, which in turn could have led to tumorigenesis. Consideration of such a scenario leads to speculation about the advisability of further using DNA damage agents as chemotherapeutic drugs for tumors where stress-induced alterations are already in place. Just as there are two sides to a coin, it is possible that the use of DNA damage agents such as cisplatin in chemotherapy could, on the one hand, harness the corresponding repair pathways and activate apoptosis and, on the other hand, could actually prove to be detrimental in these tumors by eliciting additional persistent stress response signals and possibly drug resistance. Therefore, in-depth probing of the splicing networks in the different subtypes of RMS and also other tumor types that show constitutive stress response-like splicing is necessary before considering therapeutic modalities that target these pathways.
Moreover, many cancer therapies rely on the reactivation of the p53 pathway in tumors, and newer strategies that involve targeting the p53-negative regulators, MDM2 and MDM4, are also being explored for development of cancer therapies [58,59] including small molecule MDM inhibitors such as nutlin3a. The effectiveness of such inhibitors of MDM2 and p53 interaction on RMS has been assessed on xenograft tumors and cell line models of RMS and at least one small molecule inhibitor has been reported to be able to reactivate both mutant and wild-type p53 pathways [60–62]. However, the presence of alternative splice variants of MDM2 and MDM4 should be taken into account as these isoforms may potentially change the outcome of the treatment. Further, these therapies may fail in these cancer types where the p53 pathway, although activated, is possibly rendered nonfunctional by the alternative splice forms MDM2-ALT1 and MDM4-ALT2 through the uncoupling of p53 from the regulation of cell cycle and/or apoptosis. Therefore, the precise signaling pathways and mechanisms involved in the initiation of alternative splicing of MDM2 and MDM4 need to be understood as they may provide clues necessary for the development of novel therapeutic agents for the treatment of these otherwise resistant tumors. One mechanism by which alternative pre-mRNA splicing can be effected is differential promoter usage for gene transcription [63]. MDM2 transcripts originate from two promoters P1 (p53-independent) and P2 (p53-dependent) with different 5′ untranslated regions (5′UTRs) albeit translating into identical protein products [64]. Our assay for MDM2 alternative splice forms could not assess promoter usage. However, previous reports of MDM2 alternative splicing in tumors have shown that there is no significant association between the alternative transcripts and MDM2 promoter usage [4,6]. To dissect other possible mechanisms that mediate this splicing event, we have developed an in vitro minigene-based system that effectively simulates the stress-induced generation of MDM2-ALT1 transcripts [65].
The impact of splicing regulatory pathways on p53 response has been highlighted in a recent study that showed that p53 is upregulated when core spliceosomal machinery components are knocked down [66]. The importance of altered splicing events in tumor-suppressive and oncogenic pathways opens a new avenue for therapeutic intervention in tumors where aberrant splicing events have been observed. Our data show that alternative splicing of MDM2 and MDM4 is an important feature of high-grade disease for specific types of RMS tumors. Additionally, we have identified a parallel between stress-inducible alternative splicing and the constitutively active alternative splicing pathways in these RMS tumors. We made an inquiry into the splicing networks altered in the RMS cell line Rh30 in response to genotoxic stress (cisplatin) in an attempt to understand the nature of stress-induced splicing pathways in RMS. In addition, we have observed that these networks overlap with those that show alterations in splicing patterns in RMS tumors. This knowledge will help to isolate specific factors that can be targeted for splicing correction therapies for RMS.
Supplementary Material
Acknowledgments
This work is dedicated in memory of our mentor and colleague, Stephen J. Qualman. We thank Lisa C. Caldwell, Chase Meacham, and members of the Chandler laboratory for their technical support and discussions throughout the study. We also thank Julie Gastier-Foster for identification of translocations in RMS tumor samples.
Abbreviations
- COG
Children's Oncology Group
- MDM2
murine double minute 2
- MDM4
murine double minute 4
- RMS
rhabdomyosarcoma
- STS
soft tissue sarcoma
Footnotes
This study was supported in part by Alex's Lemonade Stand Foundation and the Sarcoma Foundation of America to D.S.C. We acknowledge the National Cancer Institute, National Institutes of Health (Bethesda, MD) for grant 1R01CA133571 to D.S.C. and grant RO1CA108882 to K.B.L. We also acknowledge the Chair's grant U10 CA98543 and Human Specimen Banking grant U24 CA114766 of the Children's Oncology Group from the National Cancer Institute, National Institutes of Health for research support. Additional support for this research is provided by a grant from the WWWW (QuadW) Foundation, Inc (www.QuadW.org) to the Children's Oncology Group.
This article refers to supplementary materials, which are designated by Tables W1 to W3 and Figures W1 to W4 and are available online at www.neoplasia.com.
References
- 1.Bartel F, Meye A, Wurl P, Kappler M, Bache M, Lautenschlager C, Grunbaum U, Schmidt H, Taubert H. Amplification of the MDM2 gene, but not expression of splice variants of MDM2 MRNA, is associated with prognosis in soft tissue sarcoma. Int J Cancer. 2001;95:168–175. doi: 10.1002/1097-0215(20010520)95:3<168::aid-ijc1029>3.0.co;2-a. [DOI] [PubMed] [Google Scholar]
- 2.Sigalas I, Calvert AH, Anderson JJ, Neal DE, Lunec J. Alternatively spliced mdm2 transcripts with loss of p53 binding domain sequences: transforming ability and frequent detection in human cancer. Nat Med. 1996;2:912–917. doi: 10.1038/nm0896-912. [DOI] [PubMed] [Google Scholar]
- 3.Kraus A, Neff F, Behn M, Schuermann M, Muenkel K, Schlegel J. Expression of alternatively spliced mdm2 transcripts correlates with stabilized wild-type p53 protein in human glioblastoma cells. Int J Cancer. 1999;80:930–934. doi: 10.1002/(sici)1097-0215(19990315)80:6<930::aid-ijc20>3.0.co;2-m. [DOI] [PubMed] [Google Scholar]
- 4.Sánchez-Aguilera A, Garcia JF, Sánchez-Beato M, Piris MA. Hodgkin's lymphoma cells express alternatively spliced forms of HDM2 with multiple effects on cell cycle control. Oncogene. 2006;25:2565–2574. doi: 10.1038/sj.onc.1209282. [DOI] [PubMed] [Google Scholar]
- 5.Hori M, Shimazaki J, Inagawa S, Itabashi M, Hori M. Alternatively spliced MDM2 transcripts in human breast cancer in relation to tumor necrosis and lymph node involvement. Pathol Int. 2000;50:786–792. doi: 10.1046/j.1440-1827.2000.01119.x. [DOI] [PubMed] [Google Scholar]
- 6.Lukas J, Gao DQ, Keshmeshian M, Wen WH, Tsao-Wei D, Rosenberg S, Press MF. Alternative and aberrant messenger RNA splicing of the mdm2 oncogene in invasive breast cancer. Cancer Res. 2001;61:3212–3219. [PubMed] [Google Scholar]
- 7.Bartel F, Taylor AC, Taubert H, Harris LC. Novel mdm2 splice variants identified in pediatric rhabdomyosarcoma tumors and cell lines. Oncol Res. 2001;12:451–457. doi: 10.3727/096504001108747459. [DOI] [PubMed] [Google Scholar]
- 8.Evdokiou A, Atkins GJ, Bouralexis S, Hay S, Raggatt LJ, Cowled PA, Graves SE, Clayer M, Findlay DM. Expression of alternatively-spliced MDM2 transcripts in giant cell tumours of bone. Int J Oncol. 2001;19:625–632. doi: 10.3892/ijo.19.3.625. [DOI] [PubMed] [Google Scholar]
- 9.Tamborini E, Della Torre G, Lavarino C, Azzarelli A, Carpinelli P, Pierotti MA, Pilotti S. Analysis of the molecular species generated by MDM2 gene amplification in liposarcomas. Int J Cancer. 2001;92:790–796. doi: 10.1002/ijc.1271. [DOI] [PubMed] [Google Scholar]
- 10.Matsumoto R, Tada M, Nozaki M, Zhang CL, Sawamura Y, Abe H. Short alternative splice transcripts of the mdm2 oncogene correlate to malignancy in human astrocytic neoplasms. Cancer Res. 1998;58:609–613. [PubMed] [Google Scholar]
- 11.Chandler DS, Singh RK, Caldwell LC, Bitler JL, Lozano G. Genotoxic stress induces coordinately regulated alternative splicing of the p53 modulators MDM2 and MDM4. Cancer Res. 2006;66:9502–9508. doi: 10.1158/0008-5472.CAN-05-4271. [DOI] [PubMed] [Google Scholar]
- 12.Dias CS, Liu Y, Yau A, Westrick L, Evans SC. Regulation of hdm2 by stress-induced hdm2alt1 in tumor and nontumorigenic cell lines correlating with p53 stability. Cancer Res. 2006;66:9467–9473. doi: 10.1158/0008-5472.CAN-05-3013. [DOI] [PubMed] [Google Scholar]
- 13.Giglio S, Mancini F, Gentiletti F, Sparaco G, Felicioni L, Barassi F, Martella C, Prodosmo A, Iacovelli S, Buttitta F, et al. Identification of an aberrantly spliced form of HDMX in human tumors: a new mechanism for HDM2 stabilization. Cancer Res. 2005;65:9687–9694. doi: 10.1158/0008-5472.CAN-05-0450. [DOI] [PubMed] [Google Scholar]
- 14.Prodosmo A, Giglio S, Moretti S, Mancini F, Barbi F, Avenia N, Di Conza G, Schünemann HJ, Pistola L, Ludovini V, et al. Analysis of human MDM4 variants in papillary thyroid carcinomas reveals new potential markers of cancer properties. J Mol Med (Berl) 2008;86:585–596. doi: 10.1007/s00109-008-0322-6. [DOI] [PMC free article] [PubMed] [Google Scholar]
- 15.Bartel F, Schulz J, Böhnke A, Blümke K, Kappler M, Bache M, Schmidt H, Würl P, Taubert H, Hauptmann S. Significance of HDMX-S (or MDM4) mRNA splice variant overexpression and HDMX gene amplification on primary soft tissue sarcoma prognosis. Int J Cancer. 2005;17:469–475. doi: 10.1002/ijc.21206. [DOI] [PubMed] [Google Scholar]
- 16.Davis RJ, Barr FG. Fusion genes resulting from alternative chromosomal translocations are overexpressed by gene-specific mechanisms in alveolar rhabdomyosarcoma. Proc Natl Acad Sci USA. 1997;94:8047–8051. doi: 10.1073/pnas.94.15.8047. [DOI] [PMC free article] [PubMed] [Google Scholar]
- 17.Hachitanda Y, Toyoshima S, Akazawa K, Tsuneyoshi M. N-myc gene amplification in rhabdomyosarcoma detected by fluorescence in situ hybridization: its correlation with histologic features. Mod Pathol. 1998;11:1222–1227. [PubMed] [Google Scholar]
- 18.Minniti CP, Tsokos M, Newton WA, Jr, Helman LJ. Specific expression of insulin-like growth factor-II in rhabdomyosarcoma tumor cells. Am J Clin Pathol. 1994;101:198–203. doi: 10.1093/ajcp/101.2.198. [DOI] [PubMed] [Google Scholar]
- 19.Wang H, Garzon R, Sun H, Ladner KJ, Singh R, Dahlman J, Cheng A, Hall BM, Qualman SJ, Chandler DS, et al. NF-κB-YY1-miR-29 regulatory circuitry in skeletal myogenesis and rhabdomyosarcoma. Cancer Cell. 2008;14:369–381. doi: 10.1016/j.ccr.2008.10.006. [DOI] [PMC free article] [PubMed] [Google Scholar]
- 20.Xia SJ, Pressey JG, Barr FG. Molecular pathogenesis of rhabdomyosarcoma. Cancer Biol Ther. 2002;1:97–104. doi: 10.4161/cbt.51. [DOI] [PubMed] [Google Scholar]
- 21.Durbin AD, Somers GR, Forrester M, Pienkowska M, Hannigan GE, Malkin D. JNK1 determines the oncogenic or tumor-suppressive activity of the integrin-linked kinase in human rhabdomyosarcoma. J Clin Invest. 2009;119:1558–1570. doi: 10.1172/JCI37958. [DOI] [PMC free article] [PubMed] [Google Scholar]
- 22.Tostar U, Malm CJ, Meis-Kindblom JM, Kindblom LG, Toftgard R, Unden AB. Deregulation of the hedgehog signalling pathway: a possible role for the PTCH and SUFU genes in human rhabdomyoma and rhabdomyosarcoma development. J Pathol. 2006;208:17–25. doi: 10.1002/path.1882. [DOI] [PubMed] [Google Scholar]
- 23.Hatley ME, Tang W, Garcia MR, Finkelstein D, Millay DP, Liu N, Graff J, Galindo RL, Olson EN. A mouse model of rhabdomyosarcoma originating from the adipocyte lineage. Cancer Cell. 2012;22:536–546. doi: 10.1016/j.ccr.2012.09.004. [DOI] [PMC free article] [PubMed] [Google Scholar]
- 24.Lenos K, Grawenda AM, Lodder K, Kuijjer ML, Teunisse AF, Repapi E, Grochola LF, Bartel F, Hogendoorn PC, Wuerl P, et al. Alternate splicing of the p53 inhibitor HDMX offers a superior prognostic biomarker than p53 mutation in human cancer. Cancer Res. 2012;72:4074–4084. doi: 10.1158/0008-5472.CAN-12-0215. [DOI] [PubMed] [Google Scholar]
- 25.Evans SC, Viswanathan M, Grier JD, Narayana M, El-Naggar AK, Lozano G. An alternatively spliced HDM2 product increases p53 activity by inhibiting HDM2. Oncogene. 2001;20:4041–4049. doi: 10.1038/sj.onc.1204533. [DOI] [PubMed] [Google Scholar]
- 26.Lobe CG, Koop KE, Kreppner W, Lomeli H, Gertsenstein M, Nagy A. Z/AP, a double reporter for Cre-mediated recombination. Dev Biol. 1999;208:281–292. doi: 10.1006/dbio.1999.9209. [DOI] [PubMed] [Google Scholar]
- 27.Ke N, Albers A, Claassen G, Yu DH, Chatterton JE, Hu X, Meyhack B, Wong-Staal F, Li QX. One-week 96-well soft agar growth assay for cancer target validation. Biotechniques. 2004;36:826–828. 830, 832–823. doi: 10.2144/04365ST07. [DOI] [PubMed] [Google Scholar]
- 28.Roberts TM, Boris-Lawrie K. The 5′ RNA terminus of spleen necrosis virus stimulates translation of nonviral mRNA. J Virol. 2000;74:8111–8118. doi: 10.1128/jvi.74.17.8111-8118.2000. [DOI] [PMC free article] [PubMed] [Google Scholar]
- 29.Huang da W, Sherman BT, Lempicki RA. Systematic and integrative analysis of large gene lists using DAVID bioinformatics resources. Nat Protoc. 2009;4:44–57. doi: 10.1038/nprot.2008.211. [DOI] [PubMed] [Google Scholar]
- 30.Barr FG, Qualman SJ, Macris MH, Melnyk N, Lawlor ER, Strzelecki DM, Triche TJ, Bridge JA, Sorensen PH. Genetic heterogeneity in the alveolar rhabdomyosarcoma subset without typical gene fusions. Cancer Res. 2002;62:4704–4710. [PubMed] [Google Scholar]
- 31.Rallapalli R, Strachan G, Cho B, Mercer WE, Hall DJ. A novel MDMX transcript expressed in a variety of transformed cell lines encodes a truncated protein with potent p53 repressive activity. J Biol Chem. 1999;274:8299–8308. doi: 10.1074/jbc.274.12.8299. [DOI] [PubMed] [Google Scholar]
- 32.Volk EL, Schuster K, Nemeth KM, Fan L, Harris LC. MDM2-A, a common Mdm2 splice variant, causes perinatal lethality, reduced longevity and enhanced senescence. Dis Model Mech. 2009;2:47–55. doi: 10.1242/dmm.000992. [DOI] [PMC free article] [PubMed] [Google Scholar]
- 33.Ognjanovic S, Martel G, Manivel C, Olivier M, Langer E, Hainaut P. Low prevalence of TP53 mutations and MDM2 amplifications in pediatric rhabdomyosarcoma. Sarcoma. 2012;2012:492086. doi: 10.1155/2012/492086. [DOI] [PMC free article] [PubMed] [Google Scholar]
- 34.Dutertre M, Sanchez G, De Cian MC, Barbier J, Dardenne E, Gratadou L, Dujardin G, Le Jossic-Corcos C, Corcos L, Auboeuf D. Cotranscriptional exon skipping in the genotoxic stress response. Nat Struct Mol Biol. 2010);17:1358–1366. doi: 10.1038/nsmb.1912. [DOI] [PubMed] [Google Scholar]
- 35.Kanehisa M, Goto S. KEGG: Kyoto encyclopedia of genes and genomes. Nucleic Acids Res. 2000;28:27–30. doi: 10.1093/nar/28.1.27. [DOI] [PMC free article] [PubMed] [Google Scholar]
- 36.Kanehisa M, Goto S, Sato Y, Furumichi M, Tanabe M. KEGG for integration and interpretation of large-scale molecular data sets. Nucleic Acids Res. 2012;40:D109–D114. doi: 10.1093/nar/gkr988. [DOI] [PMC free article] [PubMed] [Google Scholar]
- 37.Taylor AC, Shu L, Danks MK, Poquette CA, Shetty S, Thayer MJ, Houghton PJ, Harris LC. P53 mutation and MDM2 amplification frequency in pediatric rhabdomyosarcoma tumors and cell lines. Med Pediatr Oncol. 2000;35:96–103. doi: 10.1002/1096-911x(200008)35:2<96::aid-mpo2>3.0.co;2-z. [DOI] [PubMed] [Google Scholar]
- 38.Dearth LR, Qian H, Wang T, Baroni TE, Zeng J, Chen SW, Yi SY, Brachmann RK. Inactive full-length p53 mutants lacking dominant wild-type p53 inhibition highlight loss of heterozygosity as an important aspect of p53 status in human cancers. Carcinogenesis. 2007;28:289–298. doi: 10.1093/carcin/bgl132. [DOI] [PubMed] [Google Scholar]
- 39.Fang S, Jensen JP, Ludwig RL, Vousden KH, Weissman AM. Mdm2 is a RING finger-dependent ubiquitin protein ligase for itself and p53. J Biol Chem. 2000;275:8945–8951. doi: 10.1074/jbc.275.12.8945. [DOI] [PubMed] [Google Scholar]
- 40.Honda R, Yasuda H. Activity of MDM2, a ubiquitin ligase, toward p53 or itself is dependent on the RING finger domain of the ligase. Oncogene. 2000;19:1473–1476. doi: 10.1038/sj.onc.1203464. [DOI] [PubMed] [Google Scholar]
- 41.Sdek P, Ying H, Zheng H, Margulis A, Tang X, Tian K, Xiao ZX. The central acidic domain of MDM2 is critical in inhibition of retinoblastomamediated suppression of E2F and cell growth. J Biol Chem. 2004;279:53317–53322. doi: 10.1074/jbc.M406062200. [DOI] [PubMed] [Google Scholar]
- 42.Miwa S, Uchida C, Kitagawa K, Hattori T, Oda T, Sugimura H, Yasuda H, Nakamura H, Chida K, Kitagawa M. Mdm2-mediated pRB downregulation is involved in carcinogenesis in a p53-independent manner. Biochem Biophys Res Commun. 2006;340:54–61. doi: 10.1016/j.bbrc.2005.11.148. [DOI] [PubMed] [Google Scholar]
- 43.Jones SN, Hancock AR, Vogel H, Donehower LA, Bradley A. Overexpression of Mdm2 in mice reveals a p53-independent role for Mdm2 in tumorigenesis. Proc Natl Acad Sci USA. 1998;95:15608–15612. doi: 10.1073/pnas.95.26.15608. [DOI] [PMC free article] [PubMed] [Google Scholar]
- 44.Lundgren K, Montes de Oca Luna R, McNeill YB, Emerick EP, Spencer B, Barfield CR, Lozano G, Rosenberg MP, Finlay CA. Targeted expression of MDM2 uncouples S phase from mitosis and inhibits mammary gland development independent of p53. Genes Dev. 1997;11:714–725. doi: 10.1101/gad.11.6.714. [DOI] [PubMed] [Google Scholar]
- 45.McDonnell TJ, Montes de Oca Luna R, Cho S, Amelse LL, Chavez-Reyes A, Lozano G. Loss of one but not two mdm2 null alleles alters the tumour spectrum in p53 null mice. J Pathol. 1999;188:322–328. doi: 10.1002/(SICI)1096-9896(199907)188:3<322::AID-PATH372>3.0.CO;2-F. [DOI] [PubMed] [Google Scholar]
- 46.Steinman HA, Burstein E, Lengner C, Gosselin J, Pihan G, Duckett CS, Jones SN. An alternative splice form of Mdm2 induces p53-independent cell growth and tumorigenesis. J Biol Chem. 2004;279:4877–4886. doi: 10.1074/jbc.M305966200. [DOI] [PubMed] [Google Scholar]
- 47.Eischen CM, Boyd K. Decreased Mdm2 expression inhibits tumor development and extends survival independent of Arf and dependent on p53. PLoS One. 2012;7:e46148. doi: 10.1371/journal.pone.0046148. [DOI] [PMC free article] [PubMed] [Google Scholar]
- 48.Barboza JA, Iwakuma T, Terzian T, El-Naggar AK, Lozano G. Mdm2 and Mdm4 loss regulates distinct p53 activities. Mol Cancer Res. 2008;6:947–954. doi: 10.1158/1541-7786.MCR-07-2079. [DOI] [PMC free article] [PubMed] [Google Scholar]
- 49.Parant J, Chavez-Reyes A, Little NA, Yan W, Reinke V, Jochemsen AG, Lozano G. Rescue of embryonic lethality in Mdm4-null mice by loss of Trp53 suggests a nonoverlapping pathway with MDM2 to regulate p53. Nat Genet. 2001;29:92–95. doi: 10.1038/ng714. [DOI] [PubMed] [Google Scholar]
- 50.Francoz S, Froment P, Bogaerts S, De Clercq S, Maetens M, Doumont G, Bellefroid E, Marine JC. Mdm4 and Mdm2 cooperate to inhibit p53 activity in proliferating and quiescent cells in vivo. Proc Natl Acad Sci USA. 2006;103:3232–3237. doi: 10.1073/pnas.0508476103. [DOI] [PMC free article] [PubMed] [Google Scholar]
- 51.Muñoz MJ, Pérez Santangelo MS, Paronetto MP, de la Mata M, Pelisch F, Boireau S, Glover-Cutter K, Ben-Dov C, Blaustein M, Lozano JJ, et al. DNA damage regulates alternative splicing through inhibition of RNA polymerase II elongation. Cell. 2009;137:708–720. doi: 10.1016/j.cell.2009.03.010. [DOI] [PubMed] [Google Scholar]
- 52.Mirzayans R, Andrais B, Scott A, Murray D. New insights into p53 signaling and cancer cell response to DNA damage: implications for cancer therapy. J Biomed Biotechnol. 2012;2012:170325. doi: 10.1155/2012/170325. [DOI] [PMC free article] [PubMed] [Google Scholar]
- 53.Barley RD, Enns L, Paterson MC, Mirzayans R. Aberrant p21WAF1-dependent growth arrest as the possible mechanism of abnormal resistance to ultraviolet light cytotoxicity in Li-Fraumeni syndrome fibroblast strains heterozygous for TP53 mutations. Oncogene. 1998;17:533–543. doi: 10.1038/sj.onc.1202271. [DOI] [PubMed] [Google Scholar]
- 54.Shay JW, Roninson IB. Hallmarks of senescence in carcinogenesis and cancer therapy. Oncogene. 2004;23:2919–2933. doi: 10.1038/sj.onc.1207518. [DOI] [PubMed] [Google Scholar]
- 55.Bunz F, Dutriaux A, Lengauer C, Waldman T, Zhou S, Brown JP, Sedivy JM, Kinzler KW, Vogelstein B. Requirement for p53 and p21 to sustain G2 arrest after DNA damage. Science. 1998;282:1497–1501. doi: 10.1126/science.282.5393.1497. [DOI] [PubMed] [Google Scholar]
- 56.McKenna E, Traganos F, Zhao H, Darzynkiewicz Z. Persistent DNA damage caused by low levels of mitomycin C induces irreversible cell senescence. Cell Cycle. 2012;11:3132–3140. doi: 10.4161/cc.21506. [DOI] [PMC free article] [PubMed] [Google Scholar]
- 57.Jackson TR, Salmina K, Huna A, Inashkina I, Jankevics E, Riekstina U, Kalnina Z, Ivanov A, Townsend PA, Cragg MS, et al. DNA damage causes TP53-dependent coupling of self-renewal and senescence pathways in embryonal carcinoma cells. Cell Cycle. 2012;12:430–441. doi: 10.4161/cc.23285. [DOI] [PMC free article] [PubMed] [Google Scholar]
- 58.Wade M, Wahl GM. Targeting Mdm2 and Mdmx in cancer therapy: better living through medicinal chemistry? Mol Cancer Res. 2009;7:1–11. doi: 10.1158/1541-7786.MCR-08-0423. [DOI] [PMC free article] [PubMed] [Google Scholar]
- 59.Toledo F, Wahl GM. MDM2 and MDM4: p53 regulators as targets in anticancer therapy. Int J Biochem Cell Biol. 2007;39:1476–1482. doi: 10.1016/j.biocel.2007.03.022. [DOI] [PMC free article] [PubMed] [Google Scholar]
- 60.Miyachi M, Kakazu N, Yagyu S, Katsumi Y, Tsubai-Shimizu S, Kikuchi K, Tsuchiya K, Iehara T, Hosoi H. Restoration of p53 pathway by nutlin-3 induces cell cycle arrest and apoptosis in human rhabdomyosarcoma cells. Clin Cancer Res. 2009;15:4077–4084. doi: 10.1158/1078-0432.CCR-08-2955. [DOI] [PubMed] [Google Scholar]
- 61.Canner JA, Sobo M, Ball S, Hutzen B, DeAngelis S, Willis W, Studebaker AW, Ding K, Wang S, Yang D, et al. MI-63: a novel small-molecule inhibitor targets MDM2 and induces apoptosis in embryonal and alveolar rhabdomyosarcoma cells with wild-type p53. Br J Cancer. 2009;101:774–781. doi: 10.1038/sj.bjc.6605199. [DOI] [PMC free article] [PubMed] [Google Scholar]
- 62.Xu J, Timares L, Heilpern C, Weng Z, Li C, Xu H, Pressey JG, Elmets CA, Kopelovich L, Athar M. Targeting wild-type and mutant p53 with small molecule CP-31398 blocks the growth of rhabdomyosarcoma by inducing reactive oxygen species-dependent apoptosis. Cancer Res. 2010;70:6566–6576. doi: 10.1158/0008-5472.CAN-10-0942. [DOI] [PMC free article] [PubMed] [Google Scholar]
- 63.Smith CW, Valcárcel J. Alternative pre-mRNA splicing: the logic of combinatorial control. Trends Biochem Sci. 2000;25:381–388. doi: 10.1016/s0968-0004(00)01604-2. [DOI] [PubMed] [Google Scholar]
- 64.Barak Y, Gottlieb E, Juven-Gershon T, Oren M. Regulation of mdm2 expression by p53: alternative promoters produce transcripts with nonidentical translation potential. Genes Dev. 1994;8:1739–1749. doi: 10.1101/gad.8.15.1739. [DOI] [PubMed] [Google Scholar]
- 65.Singh RK, Tapia-Santos A, Bebee TW, Chandler DS. Conserved sequences in the final intron of MDM2 are essential for the regulation of alternative splicing of MDM2 in response to stress. Exp Cell Res. 2009;315:3419–3432. doi: 10.1016/j.yexcr.2009.07.017. [DOI] [PubMed] [Google Scholar]
- 66.Allende-Vega N, Dayal S, Agarwala U, Sparks A, Bourdon JC, Saville MK. p53 is activated in response to disruption of the pre-mRNA splicing machinery. Oncogene. 2012;32:1–14. doi: 10.1038/onc.2012.38. [DOI] [PubMed] [Google Scholar]
Associated Data
This section collects any data citations, data availability statements, or supplementary materials included in this article.