Abstract
AIM: To distinguish acinar cell carcinoma (ACC) from pancreatic adenocarcinoma (AC) by comparing their computed tomography findings.
METHODS: Patients with ACC and AC were identified on the basis of results obtained using surgically resected pancreatectomy specimens. The preoperative computer tomographic images of 6 acinar cell carcinoma patients and 67 pancreatic adenocarcinoma patients in 4 phases (non-contrast, arterial, portal venous, and delayed phase) were compared. The scan delay times were 40, 70, and 120 s for each contrast-enhanced phase. The visual pattern, tomographic attenuation value, and time attenuation curve were assessed and compared between AC and ACC cases using the χ2 test, Wilcoxon signed-rank test, and Mann Whitney U test.
RESULTS: The adenocarcinomas tended to be hypodense in all 4 phases. The acinar cell carcinomas also tended to be hypodense in the 3 contrast-enhanced phases, although their computed tomographic attenuation values were higher. Further, 5 of the 6 acinar cell carcinomas (83%) were isodense in the non-contrast phase. The time attenuation curve of the adenocarcinomas showed a gradual increase through the 4 phases, and all adenocarcinomas showed peak enhancement during the delayed phase. The time attenuation curve of the acinar cell carcinomas showed peak enhancement during the portal venous phase in 4 cases and during the arterial phase in 2 cases. None of the 6 acinar cell carcinomas showed peak enhancement during the delayed phase.
CONCLUSION: The tumor density in the non-contrast phase and time attenuation curve pattern clearly differ between acinar cell carcinomas and adenocarcinomas, and multidetector-row computed tomography can thus distinguish these tumors.
Keywords: Pancreatic acinar cell carcinoma, Pancreatic adenocarcinoma, Multidetector-row computed tomography, Visual pattern, Time attenuation curve
Core tip: The tumor density in the non-contrast phase and time attenuation curve pattern clearly differ between acinar cell carcinoma and adenocarcinomas, although both tumors tend to be hypodense in the contrast-enhanced phases.
INTRODUCTION
Acinar cell carcinoma (ACC) is a rare malignant epithelial neoplasm that exhibits exocrine enzyme production, and it accounts for approximately 1% of all pancreatic neoplasms[1]. ACCs have been reported to be bulky tumors that mainly occur in the pancreatic head[2], and recent reports have shown that ACCs are often accompanied by intratumoral necrosis and have various specific extraparenchymal progression patterns, such as intraductal tumor growth (ITG) and venous tumor thrombus (VTT)[3-9]. Several reports have described the computed tomography (CT) findings of ACC: it is typically solitary and is accompanied by an intratumoral hypodense area when large. In terms of the visual pattern, although a few hyperdense ACCs have been reported, most ACCs have been reported to be hypodense on contrast-enhanced CT[10,11]. Despite these previous reports on imaging findings, the correct preoperative diagnosis of ACC remains difficult, and ACC is often misdiagnosed as another hypodense pancreatic tumor, namely, adenocarcinoma (AC)[11].
ACCs had been previously considered equally aggressive as ACs[12,13], and pretreatment differentiation between ACC and AC was not considered important. However, in recent years, increasing evidence has shown that ACCs are characterized by less aggressive growth and that ACC shows significantly better long-term survival than AC[12]. Further, although no consensus has been reached on surgery for metastatic ACCs, a few reports have described a good prognosis after resection of limited metastatic disease. Because the malignant potential of ACC and AC is significantly different, correct pretreatment distinction between these two tumors is very important.
This study aims to elucidate the characteristic CT findings of ACC to allow accurate diagnosis of even small ACCs. The visual pattern, CT attenuation value, and time attenuation curve (TAC) pattern of ACCs on 4-phase multidetector-row computed tomography (MDCT) were retrospectively reviewed, and the results were compared with those of ACs.
MATERIALS AND METHODS
Patients
The study design was approved by the institutional review board. Informed consent was not required because the review of the patients’ data was anonymous. After a thorough search of the computerized database of the Hepatobiliary Pancreatic Surgery Division from April 2006 to March 2011, 6 patients with ACC and 88 patients with AC were identified on the basis of results obtained using surgically resected pancreatectomy specimens. Twenty-one AC patients were excluded because CT attenuation values for these tumors could not be measured accurately for the following reasons: halation of indwelling biliary drainage tube (11 ACs), small size and unclear tumor margin (9 ACs), and allergy to contrast media (1 AC). MDCT images of the 6 ACC patients and the remaining 67 AC patients were comparatively reviewed.
MDCT examination
All MDCT studies were performed using a scanner with 16 rows of detectors (Aquilion 16; Toshiba Medical Systems, Tokyo, Japan). CT images, both unenhanced and contrast enhanced, were routinely obtained with the patient in the supine position during full inspiration. For contrast-enhanced imaging, 100 mL of nonionic contrast material with iodine was administered at a rate of 3.2 cc/s using a mechanical power injector through a 20-gauge angiographic catheter inserted into a forearm vein. The scan delay time was 40 s for the arterial phase, 70 s for the portal venous phase, and 120 s for the delayed phase. Four-phase images (1 unenhanced image and 3 contrast-enhanced images) were routinely obtained. The scanning parameters for each phase were 1-mm collimation, 3-mm slice thickness, 3-mm reconstruction interval, 120 kV, and auto mA.
Imaging analysis
MDCT images were available from the picture archiving and communication system (PACS), and all images were reviewed on the PACS monitor. All CT images were evaluated retrospectively by 2 experienced hepatobiliary and pancreatic surgeons with 13 and 24 years of experience, respectively. CT images were assessed for the visual pattern and CT attenuation value of the ACs and ACCs. The visual pattern of each lesion was classified as hyperdense, isodense, or hypodense, compared to the surrounding normal pancreatic parenchyma in each phase. The CT attenuation value in Hounsfield units was obtained using region of interest (ROI) analysis. To reduce the effect of tumor heterogeneity, one ROI of the largest possible area was identified within the tumor at the level of maximum tumor diameter. The ROI value was calculated as the CT attenuation value of the tumor. Three ROIs of diameter 1 cm were also identified in the normal parenchyma adjacent to the tumor, and the mean of the 3 ROI values was calculated as the CT attenuation value of the surrounding parenchyma. While defining ROIs, special attention was paid to exclude cystic areas, calcification, the pancreatic duct, and the surrounding vessels. TAC patterns were drawn on the basis of each CT attenuation value, and they were compared between the ACCs and ACs.
Pathological examination and analysis
All the ACCs and ACs in this study were surgically resected, and 2 pathologists reviewed the gross appearance of the tumor specimens and hematoxylin-eosin-stained specimens on microscopic slides. For the ACCs, immunohistochemical analysis was performed for chromogranin and synaptophysin to exclude mixed acinar-endocrine carcinomas (MAEs).
Statistical analysis
The visual patterns of the ACCs and the ACs were compared using the χ2 test. The CT attenuation values were compared between each phase by using the Wilcoxon signed-rank test. The CT attenuation values of the ACCs and the ACs were compared by using the Mann-Whitney U test. Data were analyzed using IBM SPSS Statics 19, and P values less than 0.05 were considered statistically significant.
RESULTS
Clinicopathological findings
Each pancreatic tumor had been preoperatively diagnosed on the basis of blood examination, CT images and endoscopic findings at weekly hepatobiliary pancreatic conferences involving radiologists, gastroenterologists, and surgeons. Of the ACC cases, 5 tumors had been diagnosed as AC, and only 1 tumor (case 6) had been correctly diagnosed as ACC (Figure 1). In all 6 ACC cases, the patients were male (mean age, 69 years; range, 52-89 years). Two patients underwent pancreaticoduodenectomy, and the other 4 patients underwent distal pancreatectomy. The maximum diameter of the tumors ranged from 31 to 87 mm, and the mean maximum diameter was 46.8 mm. Five tumors showed intratumoral necrosis. Extraparenchymal tumor extension as ITG and VTT was observed in 3 patients and 1 patient, respectively (Figures 1 and 2). All ACCs were characterized by extensive cellularity and minimal stroma, and the tumor cells showed basophilic cytoplasm and frequently contained eosinophilic granules in the cytoplasm. The tumor cells were arranged in an acinar pattern in 3 ACCs and in a solid pattern in 3 ACCs. Immunohistochemical analysis showed negative reactions for chromogranin and synaptophysin in all cases. Re-examination of the morphological characteristics, cell structure, and immunohistochemical reactions of all resected tumors excluded neuroendocrine tumors and MAEs. All tumors were diagnosed as pure ACCs. Among 67 AC patients, 34 AC patients were male and 33 were female (mean age, 71.4 years; range, 34-87 years). The maximum diameter of the tumors ranged from 12 to 105 mm, and the mean maximum diameter was 35 mm. All tumors were whitish, solid, and associated with dense fibrotic stroma. None of the tumors was accompanied by significant intratumoral necrosis. All tumors were diagnosed as tubular adenocarcinoma; adenocarcinoma variants such as adenosquamous carcinoma, colloid carcinoma, and undifferentiated carcinoma were not observed.
Figure 1.
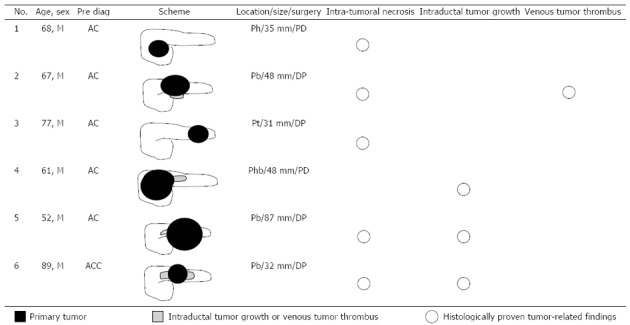
Clinicopathological findings of the acinar cell carcinomas. M: Male; Pre Diag: Preoperative diagnosis; AC: Adenocarcinoma; ACC: Acinar cell carcinoma; Ph/b/t: Pancreatic head/body/tail; PD: Pancreaticoduodenectomy; DP: Distal pancreatectomy.
Figure 2.
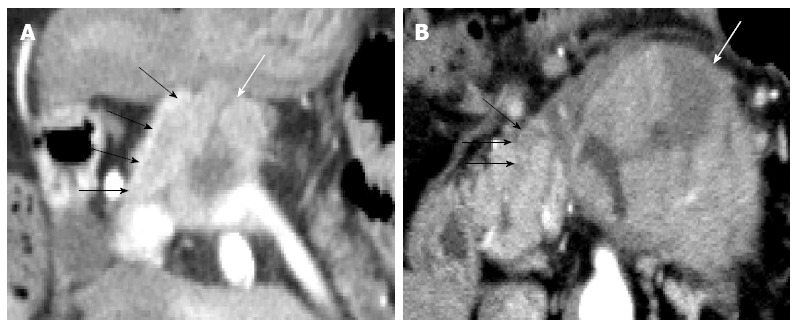
Acinar cell carcinomas with intraductal tumor growth. A: Case 6, computed tomography (CT) showed the primary acinar cell carcinoma (ACC) in the pancreatic body (white arrow) and the easily recognizable widespread intraductal tumor growth (ITG) (black arrows); B: Case 5, CT shows the primary ACC in the pancreatic body (white arrow) and the small almost-unrecognizable ITG (black arrows).
MDCT findings
Visual pattern: Fifty-three ACs (79%) were hypodense while 14 (21%) were isodense in the non-contrast phase (Figure 3, Table 1). All ACs were hypodense in the arterial and portal venous phases. Forty-six ACs (69%), 13 ACs (19%), and 8 ACs (12%) were hypo-, iso-, and hyperdense in the delayed phase, respectively.
Figure 3.
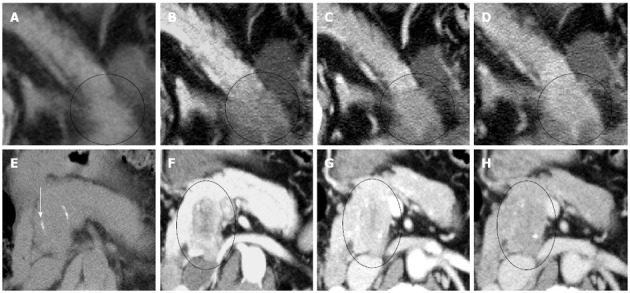
Visual patterns of the adenocarcinoma and the acinar cell carcinoma in the 4 phases. A-D: Adenocarcinoma in the pancreatic tail (circle); The tumor was hypodense in all 4 phases (A: Non-contrast phase; B: Arterial phase; C: Portal venous phase; D: delayed phase). It showed a gradual enhancement pattern across the phases; E-H: Case 1, Acinar cell carcinoma in the pancreatic head (circle); The tumor was isodense and undetectable in the non-contrast phase, although calcification was identified (arrow) (E); It was hypodense in all 3 contrast-enhanced phases (F: Arterial phase; G: Portal venous phase; H: Delayed phase); Contrast enhancement was the strongest in the portal venous phase (G).
Table 1.
Visual pattern of acinar cell carcinoma and adenocarcinoma n (%)
| Non-contrast | Arterial | Portal venous | Delayed | |
| ACC | Hypo 1 (17) | Hypo 6 (100) | Hypo 6 (100) | Hypo 5 (83) |
| 6 cases | Iso 5 (83) | Iso 1 (17) | ||
| AC | Hypo 53 (79) | Hypo 67 (100) | Hypo 67 (100) | Hypo 46 (69) |
| 67 cases | Iso 14 (21) | Iso 13 (19) | ||
| Hyper 8 (12) | ||||
| P value | P < 0.01 | NS | NS | NS |
ACC: Acinar cellcarcinoma; AC: Adenocarcinoma; Hypo: Hypodense; Iso: Isodense; Hyper: Hyperdense; NS: Not significant.
One ACC (17%) was hypodense and 5 (83%) were isodense in the non-contrast phase (Figure 3, Table 1). All ACCs were hypodense in all 3 contrast-enhanced phases, except for 1 tumor, which was isodense in the delayed phase. Thus, the visual pattern was clearly different between ACCs and ACs in the non-contrast phase (P < 0.01) (Table 1).
CT attenuation value and TAC pattern: The CT attenuation values of the ACs showed a gradually increasing pattern (non-contrast vs arterial, P < 0.01; arterial vs portal venous, P < 0.01; portal venous vs delayed, P < 0.01) (Figure 4). The TAC of all 67 ACs showed peak enhancement during the delayed phase.
Figure 4.
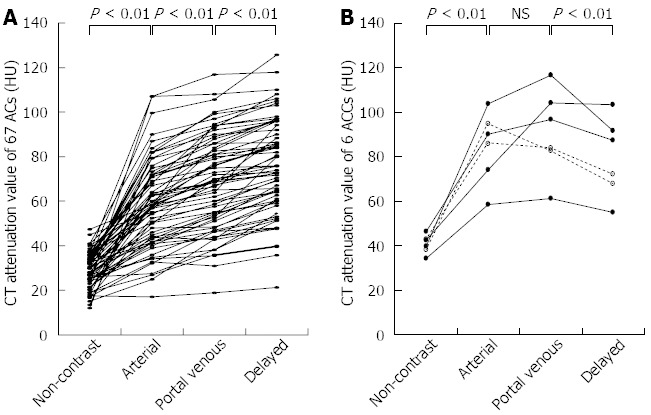
Time attenuation curve of the 67 adenocarcinomas (A) and 6 acinar cell carcinomas (B). Peak enhancement is seen during the delayed phase for all 67 acinar cell carcinomas. Meanwhile, peak enhancement is seen during the portal venous phase for 4 acinar cell carcinomas (ACCs) and during the arterial phase for 2 ACCs. None of the 6 ACCs show peak enhancement during the delayed phase. AC: Adenocarcinomas; CT: Computed tomography; NS: Not significant.
The TAC of 4 ACCs showed peak enhancement during the portal venous phase. That of the remaining 2 ACCs showed peak enhancement during the arterial phase, followed by a gradual decline. Unlike the ACs, the ACCs showed significantly higher CT attenuation values in the portal venous phase than in the delayed phase (P < 0.01) (Figure 4).
In all 3 phases (non-contrast, arterial, and portal venous), the CT attenuation values of the ACCs were significantly higher than those of the ACs, although the visual patterns of the 2 tumors were clearly different only in the non-contrast phase (Figure 5, Table 1).
Figure 5.
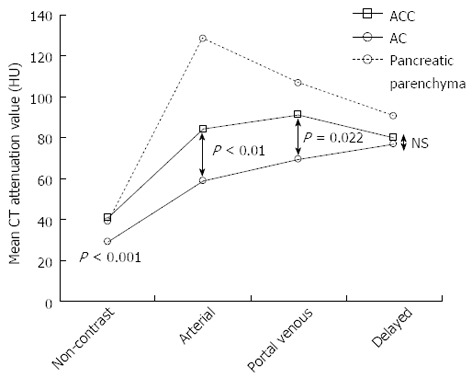
Mean computed tomography attenuation values of the tumors and the surrounding pancreatic parenchyma in the 4 phases. In 3 phases (non-contrast, arterial, and portal venous phase), the computed tomography (CT) attenuation values of the acinar cell carcinomas (ACCs) were significantly higher than those of the adenocarcinomas (ACs). NS: Not significant.
DISCUSSION
Previously, ACCs were considered equally aggressive cancers as ACs[12,13]. Therefore, the treatment strategy for both tumors was essentially the same, and preoperative differentiation between ACC and AC was not considered important. However, in recent years, increasing evidence has shown that ACCs exhibit less aggressive growth and significantly better long-term survival than ACs[12]. Two recent large population-based studies proved the better prognosis of ACC[14,15]. Schmidt et al[14] reported the largest ACC series of 865 patients from the National Cancer Database, and they described the 5-year survival rates to be 36.2% and 10.4% for the resected and non-resected cases, respectively. The stage-specific 5-year survival was significantly better for resected ACC than AC (stage I: 52.4% vs 28.4%; II: 40.2% vs 9.8%; III: 22.8% vs 6.8%; IV: 17.2% vs 2.8%). These findings suggest that the survival rate is better for ACC than for AC, and even in advanced ACC cases, survival can be improved by resection. Further, although no consensus has been reached on surgery for metastatic ACCs, a few reports have described a good prognosis after resection of limited metastatic disease. Hartwig et al[12] reported that the overall survival did not differ between 9 patients who underwent metastatic disease resection and 6 patients who underwent nonmetastatic disease resection. Suzuki et al[16] reported the case of a long-term survivor of metastatic ACC who was successfully treated with repetitive surgery. Because surgery might result in longer survival for ACC patients, even those with metastatic disease, the malignant potential of ACC and AC is thought to be significantly different, and accurate diagnosis of ACC is very important.
Recent reports on CT have shown that ACCs are typically solitary, and they are homogenously enhanced when the lesion is small but may contain hypodense areas because of necrosis if the lesion is large[11,17]. In terms of the visual pattern in contrast-enhanced phases, although a few reports described ACC to be a hyperdense tumor in the arterial phase[18], some reported that it tended to be enhanced less than the adjacent normal pancreatic parenchyma[10,11]. Chiou et al[17] reported on the CT manifestations of 8 ACCs, of which 6 were hypodense and 2 were isodense in the early arterial and portal venous phases. As shown in previous reports, ACCs tended to be hypodense in all 3 contrast-enhanced phases in the current study, and hypervascular pancreatic tumors, such as neuroendocrine tumor or metastatic renal cell carcinoma, were not included among the preoperative differential diagnoses. Although several such valid imaging findings of ACCs are available, accurate preoperative imaging-based diagnosis of ACCs, especially small ACCs, remains difficult[19]. In the current study, ACC was correctly diagnosed on the basis of recognizable widespread ITG on CT images in only 1 case (Figure 2A). Although the characteristic progression patterns of ITG or VTT were observed in 3 other cases (cases 2, 4, and 5), ACC was not preoperatively diagnosed in these cases. Because the ITG or VTT lesions were small and continuous with the primary tumor in these cases, they could not be considered to be the tumor that had progressed into the pancreatic duct or splenic vein, and they were regarded as part of the primary tumor (Figure 2B). To identify novel indicators for the accurate diagnosis of ACC, the CT attenuation values of ACC were compared with those of AC, which was the most frequently suspected disease in the preoperative diagnosis in our ACC cases, and we found that ACCs had a unique TAC pattern. The TAC of the ACCs showed the peak enhancement during the portal venous phase in the 4 ACCs, and during the arterial phase in the 2 ACCs. None of the 6 ACCs showed the peak enhancement during the delayed phase. This TAC pattern of ACC was clearly different from that of AC. Several studies have reported the CT findings of pancreatic AC, and it is well known that AC with fibrous stroma appears hypodense with delayed enhancement on dynamic CT[20-22]. The ACs in the current study also showed the gradual enhancement pattern, and all 67 ACs showed the peak enhancement during the delayed phase. Although the reasons for the different TAC pattern of ACs and ACCs have not been elucidated, we speculate that the degree of intratumoral fibrosis is one. Hattori et al[23] reported that the CT attenuation value of ACs correlated negatively with the extent of intratumoral fibrosis in 3 contrast-enhanced phases. The scanty fibrous stroma in the ACCs might have led to their higher CT attenuation values compared with those of the ACs. The isodensity of most ACCs in the non-contrast phase, which is clearly different from the hypodensity of most ACs, is also thought to reflect the degree of fibrosis. In this study, 3 relatively small ACCs (31, 32, and 35 mm in diameter) also showed the specific TAC pattern. Thus, this TAC pattern might be useful to distinguish ACCs from ACs, especially when they are small and have no distinguishing morphological features. Further, in the future, it may be possible to apply these different patterns of enhancement on MDCT to echoendoscopy.
Echoendoscopy has been reported to be superior to any other modality with respect to spatial resolution, and it can accurately detect small pancreatic lesions[24-26]. Contrast-enhanced endoscopic ultrasonography (CE-EUS) has emerged as a recent technological development, and this modality can be used to evaluate the degree of enhancement in pancreatic lesions[25,26]. Kitano et al[26] reported that CE-EUS was useful for characterizing pancreatic lesions and that it was superior to MDCT for diagnosing small lesions. Although, to our knowledge, no study has compared the enhancement pattern between ACs and ACCs using echoendoscopy, this modality may prove useful for distinguishing these 2 pancreatic tumors.
Despite the novel findings of this study, it does have some limitations. Firstly, the number of ACC cases included is small, and it is not clear whether or not every ACC definitely shows the unique TAC pattern. Another limitation is that the actual effectiveness of this TAC pattern is unclear, because of the retrospective nature of this study. Further investigation is necessary to prove that the TAC pattern is specific to ACCs and that it is actually useful in distinguishing ACCs from other pancreatic tumors.
In conclusion, the tumor density in the non-contrast phase and TAC pattern are clearly different between ACCs and ACs, although both tumors tend to be hypodense in the contrast-enhanced phases.
COMMENTS
Background
Acinar cell carcinoma (ACC) is a rare malignant epithelial neoplasm that exhibits exocrine enzyme production, and it accounts for approximately 1% of all pancreatic neoplasms. ACCs have been reported to be bulky tumors that mainly occur in the pancreatic head, and recent reports have shown that ACCs are often accompanied by intratumoral necrosis and have various specific extraparenchymal progression patterns, such as intraductal tumor growth and venous tumor thrombus. Several reports have described the computed tomography (CT) findings of ACC: it is typically solitary and is accompanied by an intratumoral hypodense area when large. In terms of the visual pattern, although a few hyperdense ACCs have been reported, most ACCs have been reported to be hypodense on contrast-enhanced CT.
Research frontiers
ACCs had been previously considered equally aggressive as ACs, and pretreatment differentiation between ACC and AC was not considered important. However, in recent years, increasing evidence has shown that ACCs are characterized by less aggressive growth and that ACC shows significantly better long-term survival than AC. Further, although no consensus has been reached on surgery for metastatic ACCs, a few reports have described a good prognosis after resection of limited metastatic disease. Because the malignant potential of ACC and AC is significantly different, correct pretreatment distinction between these two tumors is very important.
Innovations and breakthroughs
The tumor density in the non-contrast phase and time attenuation curve pattern clearly differ between acinar cell carcinomas and adenocarcinomas, and multidetector-row computed tomography can distinguish these tumors.
Applications
Each pancreatic tumor had been preoperatively diagnosed on the basis of blood examination, CT images and endoscopic findings at weekly hepatobiliary pancreatic conferences involving radiologists, gastroenterologists, and surgeons.
Peer review
This is an interesting paper. The number of acinar carcinomas is relatively small but still there are some interesting results. Suggest authors edit the paper before publication if they have more cases in hand.
Footnotes
P- Reviewers Minicis SD, Lau PCP S- Editor Huang XZ L- Editor Logan S E- Editor Zhang DN
References
- 1.Matsuyama T, Ogata S, Sugiura Y, Yoshizumi Y, Aiko S, Aida S, Maehara T. Acinar cell carcinoma of the pancreas eroding the pylorus and duodenal bulb. J Hepatobiliary Pancreat Surg. 2004;11:276–279. doi: 10.1007/s00534-003-0875-2. [DOI] [PubMed] [Google Scholar]
- 2.Kuopio T, Ekfors TO, Nikkanen V, Nevalainen TJ. Acinar cell carcinoma of the pancreas. Report of three cases. APMIS. 1995;103:69–78. doi: 10.1111/j.1699-0463.1995.tb01081.x. [DOI] [PubMed] [Google Scholar]
- 3.Kobayashi S, Asakura T, Ohike N, Enomoto T, Sakurai J, Koizumi S, Watanabe T, Nakano H, Otsubo T. Mixed acinar-endocrine carcinoma of the pancreas with intraductal growth into the main pancreatic duct: Report of a case. Surg Today. 2010;40:380–384. doi: 10.1007/s00595-009-4083-9. [DOI] [PubMed] [Google Scholar]
- 4.Svrcek M, Lesurtel M, Lewin M, Afchain P, Fabre M, Scoazec JY, Parc R, Fléjou JF. [Acinar cell carcinoma of the pancreas with predominant intraductal growth: report of a case] Gastroenterol Clin Biol. 2007;31:543–546. doi: 10.1016/s0399-8320(07)89425-5. [DOI] [PubMed] [Google Scholar]
- 5.Yang TM, Han SC, Wu CJ, Mo LR. Acinar cell carcinomas with exophytic growth and intraductal pancreatic duct invasion: peculiar multislice computed tomographic picture. J Hepatobiliary Pancreat Surg. 2009;16:238–241. doi: 10.1007/s00534-008-0034-x. [DOI] [PubMed] [Google Scholar]
- 6.Hashimoto M, Matsuda M, Watanabe G, Mori M, Motoi N, Nagai K, Ishibashi M. Acinar cell carcinoma of the pancreas with intraductal growth: report of a case. Pancreas. 2003;26:306–308. doi: 10.1097/00006676-200304000-00016. [DOI] [PubMed] [Google Scholar]
- 7.Fabre A, Sauvanet A, Flejou JF, Belghiti J, Palazzo L, Ruszniewski P, Degott C, Terris B. Intraductal acinar cell carcinoma of the pancreas. Virchows Arch. 2001;438:312–315. doi: 10.1007/s004280000342. [DOI] [PubMed] [Google Scholar]
- 8.Iwatate M, Matsubayashi H, Sasaki K, Kishida N, Yoshikawa S, Ono H, Maitra A. Functional pancreatic acinar cell carcinoma extending into the main pancreatic duct and splenic vein. J Gastrointest Cancer. 2012;43:373–378. doi: 10.1007/s12029-010-9198-0. [DOI] [PubMed] [Google Scholar]
- 9.Basturk O, Zamboni G, Klimstra DS, Capelli P, Andea A, Kamel NS, Adsay NV. Intraductal and papillary variants of acinar cell carcinomas: a new addition to the challenging differential diagnosis of intraductal neoplasms. Am J Surg Pathol. 2007;31:363–370. doi: 10.1097/01.pas.0000213376.09795.9f. [DOI] [PubMed] [Google Scholar]
- 10.Hsu MY, Pan KT, Chu SY, Hung CF, Wu RC, Tseng JH. CT and MRI features of acinar cell carcinoma of the pancreas with pathological correlations. Clin Radiol. 2010;65:223–229. doi: 10.1016/j.crad.2009.11.010. [DOI] [PubMed] [Google Scholar]
- 11.Tatli S, Mortele KJ, Levy AD, Glickman JN, Ros PR, Banks PA, Silverman SG. CT and MRI features of pure acinar cell carcinoma of the pancreas in adults. AJR Am J Roentgenol. 2005;184:511–519. doi: 10.2214/ajr.184.2.01840511. [DOI] [PubMed] [Google Scholar]
- 12.Hartwig W, Denneberg M, Bergmann F, Hackert T, Hinz U, Strobel O, Büchler MW, Werner J. Acinar cell carcinoma of the pancreas: is resection justified even in limited metastatic disease? Am J Surg. 2011;202:23–27. doi: 10.1016/j.amjsurg.2010.06.004. [DOI] [PubMed] [Google Scholar]
- 13.Kitagami H, Kondo S, Hirano S, Kawakami H, Egawa S, Tanaka M. Acinar cell carcinoma of the pancreas: clinical analysis of 115 patients from Pancreatic Cancer Registry of Japan Pancreas Society. Pancreas. 2007;35:42–46. doi: 10.1097/mpa.0b013e31804bfbd3. [DOI] [PubMed] [Google Scholar]
- 14.Schmidt CM, Matos JM, Bentrem DJ, Talamonti MS, Lillemoe KD, Bilimoria KY. Acinar cell carcinoma of the pancreas in the United States: prognostic factors and comparison to ductal adenocarcinoma. J Gastrointest Surg. 2008;12:2078–2086. doi: 10.1007/s11605-008-0705-6. [DOI] [PubMed] [Google Scholar]
- 15.Wisnoski NC, Townsend CM, Nealon WH, Freeman JL, Riall TS. 672 patients with acinar cell carcinoma of the pancreas: a population-based comparison to pancreatic adenocarcinoma. Surgery. 2008;144:141–148. doi: 10.1016/j.surg.2008.03.006. [DOI] [PubMed] [Google Scholar]
- 16.Suzuki A, Sakaguchi T, Morita Y, Oishi K, Fukumoto K, Inaba K, Takehara Y, Baba S, Suzuki S, Konno H. Long-term survival after a repetitive surgical approach in a patient with acinar cell carcinoma of the pancreas and recurrent liver metastases: report of a case. Surg Today. 2010;40:679–683. doi: 10.1007/s00595-009-4128-0. [DOI] [PubMed] [Google Scholar]
- 17.Chiou YY, Chiang JH, Hwang JI, Yen CH, Tsay SH, Chang CY. Acinar cell carcinoma of the pancreas: clinical and computed tomography manifestations. J Comput Assist Tomogr. 2004;28:180–186. doi: 10.1097/00004728-200403000-00005. [DOI] [PubMed] [Google Scholar]
- 18.Mustert BR, Stafford-Johnson DB, Francis IR. Appearance of acinar cell carcinoma of the pancreas on dual-phase CT. AJR Am J Roentgenol. 1998;171:1709. doi: 10.2214/ajr.171.6.9843323. [DOI] [PubMed] [Google Scholar]
- 19.Kim YJ, Chung DJ, Byun JH, Kim YS. Metastatic acinar cell carcinoma of the liver from a benign-appearing pancreatic lesion: a mimic of hepatocellular carcinoma. Br J Radiol. 2011;84:e151–e153. doi: 10.1259/bjr/26942051. [DOI] [PMC free article] [PubMed] [Google Scholar]
- 20.Furukawa H, Takayasu K, Mukai K, Kanai Y, Inoue K, Kosuge T, Ushio K. Late contrast-enhanced CT for small pancreatic carcinoma: delayed enhanced area on CT with histopathological correlation. Hepatogastroenterology. 1996;43:1230–1237. [PubMed] [Google Scholar]
- 21.Demachi H, Matsui O, Kobayashi S, Akakura Y, Konishi K, Tsuji M, Miwa A, Miyata S. Histological influence on contrast-enhanced CT of pancreatic ductal adenocarcinoma. J Comput Assist Tomogr. 1997;21:980–985. doi: 10.1097/00004728-199711000-00024. [DOI] [PubMed] [Google Scholar]
- 22.Yamada Y, Mori H, Matsumoto S, Kiyosue H, Hori Y, Hongo N. Pancreatic adenocarcinoma versus chronic pancreatitis: differentiation with triple-phase helical CT. Abdom Imaging. 2010;35:163–171. doi: 10.1007/s00261-009-9579-7. [DOI] [PubMed] [Google Scholar]
- 23.Hattori Y, Gabata T, Matsui O, Mochizuki K, Kitagawa H, Kayahara M, Ohta T, Nakanuma Y. Enhancement patterns of pancreatic adenocarcinoma on conventional dynamic multi-detector row CT: correlation with angiogenesis and fibrosis. World J Gastroenterol. 2009;15:3114–3121. doi: 10.3748/wjg.15.3114. [DOI] [PMC free article] [PubMed] [Google Scholar]
- 24.Boujaoude J. Role of endoscopic ultrasound in diagnosis and therapy of pancreatic adenocarcinoma. World J Gastroenterol. 2007;13:3662–3666. doi: 10.3748/wjg.v13.i27.3662. [DOI] [PMC free article] [PubMed] [Google Scholar]
- 25.De Angelis C, Repici A, Carucci P, Bruno M, Goss M, Mezzabotta L, Pellicano R, Saracco G, Rizzetto M. Pancreatic cancer imaging: the new role of endoscopic ultrasound. JOP. 2007;8:85–97. [PubMed] [Google Scholar]
- 26.Kitano M, Kudo M, Yamao K, Takagi T, Sakamoto H, Komaki T, Kamata K, Imai H, Chiba Y, Okada M, et al. Characterization of small solid tumors in the pancreas: the value of contrast-enhanced harmonic endoscopic ultrasonography. Am J Gastroenterol. 2012;107:303–310. doi: 10.1038/ajg.2011.354. [DOI] [PubMed] [Google Scholar]


