Abstract
Two phantoms have been constructed for assessing the performance of high frequency ultrasound imagers. They also allow for periodic quality assurance tests. The phantoms contain eight blocks of tissue-mimicking material where each block contains a spatially random distribution of suitably small anechoic spheres having a small distribution of diameters. The eight mean sphere diameters are distributed from 0.10 to 1.09 mm. The two phantoms differ primarily in terms of the backscatter coefficient of the background material in which the spheres are suspended. The mean scatterer diameter for one phantom is larger than that for the other phantom resulting in a lesser increase in backscatter coefficient for the second phantom; however, the backscatter curves cross at about 35 MHz. Since spheres have no preferred orientation, all three (spatial) dimensions of resolution contribute to sphere detection on an equal basis; thus, the resolution is termed 3-D. Two high frequency scanners are compared. One employs single-element (fixed focus) transducers, and the other employs variable focus linear arrays. The nominal frequency for the single element transducers were 25 and 55 MHz and for the linear array transducers were 20, 30 and 40 MHz. The depth range for detection of spheres of each size is determined corresponding to determination of 3-D resolution as a function of depth. As expected, the single-element transducers are severely limited in useful imaging depth ranges compared with the linear arrays. Note that these phantoms could also be useful for training technicians in using higher frequency scanners.
Index Terms: 3-D resolution, high frequency, phantoms, ultrasound
I. INTRODUCTION
The usual way to assess the (spatial) resolution capability of ultrasound scanners is to estimate axial, lateral and elevational components individually using pairs of fibers or single fibers which are perpendicular to the beam axis. An alternative – and perhaps more convenient – way to estimate resolution, where all three dimensions are assessed collectively, is to determine detectability of low-to-high contrast spheres in a speckle background. Depth ranges of detection are determined; these ranges depend on the sphere diameter and intrinsic contrast. (The intrinsic contrast of two different materials refers to the ratio of backscatter coefficients for those materials; measurement of backscatter coefficients is done using a sample that is large enough that boundary effects are not involved.) Such phantoms have been described previously for use with abdominal ultrasound with frequencies from 2 through about 10 MHz. [1] Phantoms having anechoic spheres with diameters of 2 mm and 4 mm in a background with macroscopically uniform speckle are available commercially (Model 408, Gammex, Inc., Middleton, WI); the relatively large sphere sizes preclude use of the Gammex 408 for determining 3-D resolution of very high frequency ultrasound scanners (20–80 MHz). The sphere diameters required for very high frequency ultrasound can be as small as 100 μm.
Production of sufficient quantities of such very small spheres with equal diameters may not be practical. We describe a method for mass-producing sufficiently small anechoic spheres with tissue-mimicking (TM) speed, attenuation and mass density; the spheres are produced with a broad range of diameters, and subsets are sieved out with relatively narrow diameter distributions. Spheres of each diameter subset are randomly distributed spatially in a uniformly echogenic TM background material appropriate for very high frequency imaging.
The phantoms reported allow quantitative determination of the ability of very high frequency scanners (20 – 55 MHz) to resolve sufficiently small anechoic spheres in an echogenic background as a function of sphere diameter and depth. Note that the smaller the anechoic sphere that is detectable, the better the delineation of the boundary of an in vivo object in the B-scan tomographic image. In addition to performance evaluation, the phantoms are useful for training technicians in the use high frequency ultrasound imagers.
The sphere detectability depth ranges are determined by sweeping the scan slice approximately perpendicular to itself and observing where the proximal and distal detectability limits are. In this preliminary report one human observer performed this task. Intra-user and inter-user performance evaluations are beyond the scope of the present report.
II. PHANTOM STRUCTURE
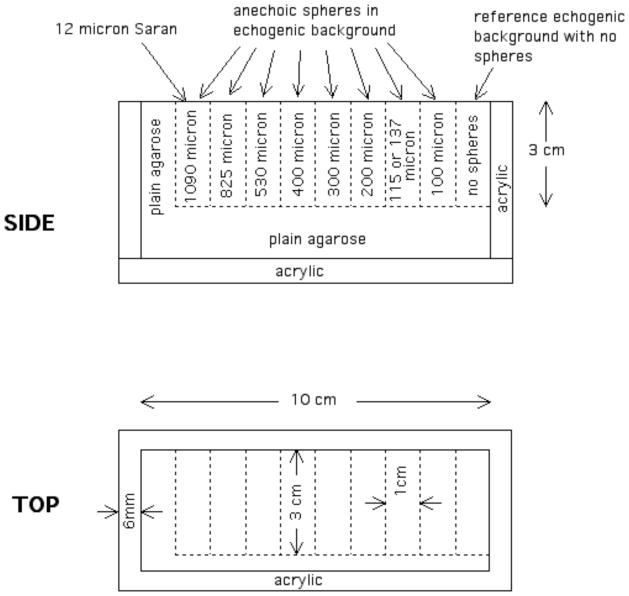
The two phantoms were made with the same overall geometry, differing primarily in the diameter distribution of the glass bead scatterers in the echogenic background. The geometry of the phantoms is shown in Figure 1. Nine 3cm×3cm×1cm blocks contain TM background material. One of the blocks contains no anechoic spheres and serves as a reference used by observers to help in deciding whether anechoic spheres are detected in the other eight blocks which do contain anechoic spheres; each of the eight blocks contains anechoic spheres with mean diameter designated in the figure. Another difference between the two phantoms is that the block between the 100 μm and 200 μm sphere blocks contains spheres of different mean diameter; viz, that block in phantom 1 contains spheres with a mean diameter of 115 μm and phantom 2 contains spheres with a mean diameter of 137 μm. The nine blocks are surrounded by low attenuation agarose. A 12-μm-thick Saran Wrap ® scanning window (Dow-Corning Corporation, Midland, MI, USA, supplier telephone: (800)248-2481) is in contact with a 3cm×1cm surface of each block, and the walls and base are formed from 6-mm-thick acrylic. All surfaces except for the scanning window surface are covered with a plastic-coated aluminum foil to minimize desiccation. A 3-mm thick cork base prevents slipping of the phantom on a smooth surface.
Fig. 1.
Diagrams showing the phantom structure and dimensions.
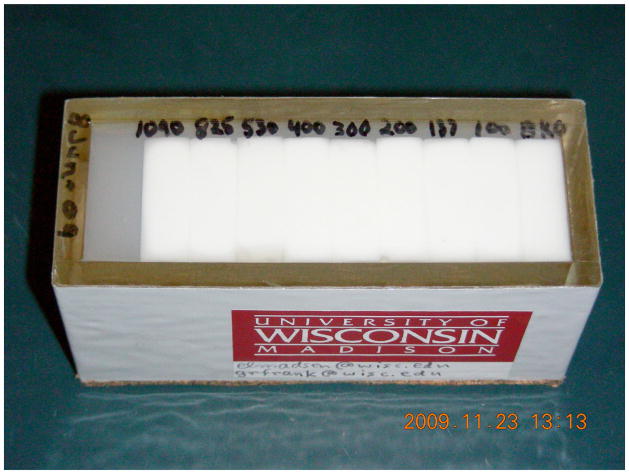
A photograph of phantom 2 is shown in Figure 2. The nine blocks can be seen through the Saran Wrap window.
Fig. 2.
Photograph of phantom 2. The nine 3cm×3cm×1cm blocks are seen through the Saran Wrap® scanning window.
III. MATERIALS AND PRODUCTION METHODS
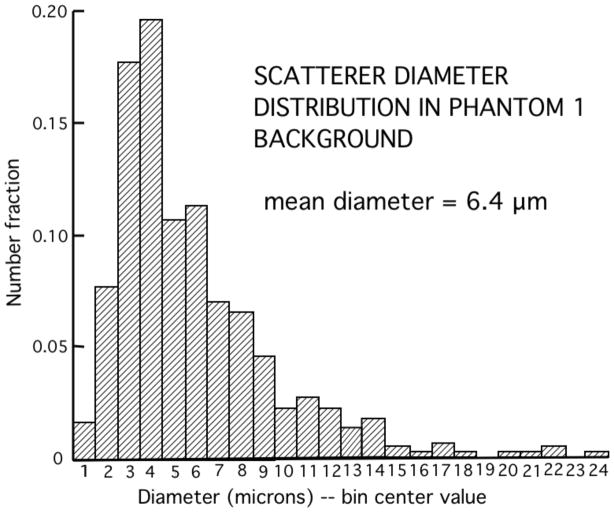
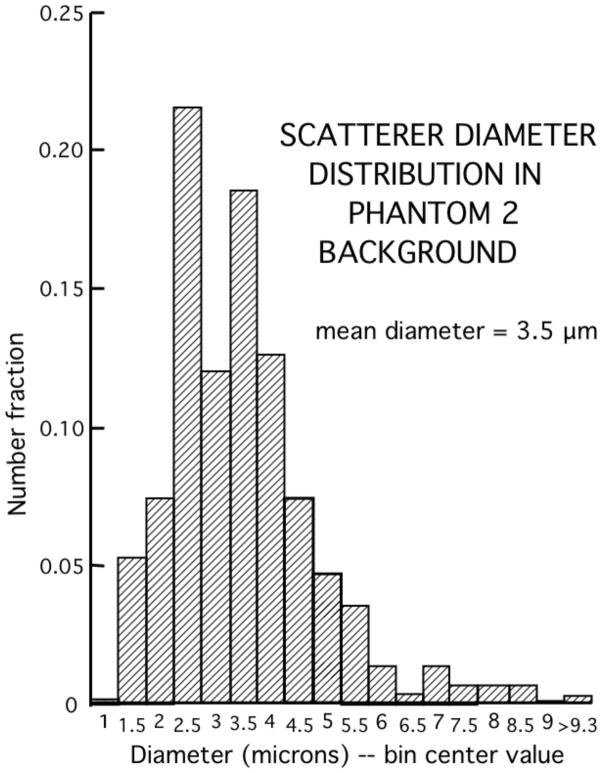
The TM materials are versions of those reported previously [2] and consist primarily of a mixture electrophoresis grade agarose (Catalog number 82703, MP Biomedicals, LLC, Solon, Ohio, USA), a preservative (Liquid Germall Plus, International Specialty Products, Wayne, New Jersey, USA, supplier: www.lotioncrafter.com/liquid-germall_plus.html), propylene glycol (Catalog number P355, Fisher Scientific, Pittsburgh, Pennsylvania, USA) and whole bovine milk (grocery store) where particles and large molecules in the milk have been concentrated by a factor of 3 using ultrafiltration with a 10,000 Dalton ultrafilter (QuixStand Benchtop System, GE Healthcare Bio-Science AB, Uppsala, Sweden). In the absence of added glass-bead scatterers, the material produces no detectable echoes; this is the material forming the anechoic spheres. The background material in which spheres are suspended contains glass-bead scatterers with sizes appropriate for very high frequency scattering (Phantom 1: catalog number 5000E and Phantom 2, catolog number EMB-10, Potters Industries, Inc., Valley Forge, Pennsylvania, USA, supplier telephone: (800)552-3237). Table 1 shows the weight percents of components of the materials in the two phantoms. The diameter distributions for the glass bead scatterers in phantoms 1 and 2 are shown in Figures 3 and 4, respectively. In each case the diameters of 500 beads were determined using a calibrated optical microscope. The mean diameter for the beads in phantom 1 is 6.4 μm and is 3.5 μm in phantom 2.
Table 1.
Weight-percents of component materials in both phantoms. Germall Plus ® is a preservative used in cosmetics and is available from Essential 7, Dexter, New Mexico, USA.
| PHANTOM 1 | PHANTOM 2 | |||
|---|---|---|---|---|
| COMPONENT MATERIAL | Background | Spheres | Background | Spheres |
| deionized water | 66.5 | 59.7 | 65.4 | 59.7 |
| propylene glycol | 4.2 | 3.8 | 4.2 | 3.8 |
| agarose (powder) | 2.1 | 1.9 | 2.1 | 1.9 |
| 3:1 ultrafiltered milk | 25.1 | 33.6 | 24.7 | 33.6 |
| Germall Plus (preserv) | 1.1 | 1.0 | 1.1 | 1.0 |
| glass bead scatterers | 1.0 | 0 | 2.6 | 0 |
Fig. 3.
Diameter distribution of glass bead scatterers in the background TM material of phantom 1. Measurements were made using a calibrated optical microscope on 500 randomly selected scatterers.
Fig. 4.
Diameter distribution of glass bead scatterers in the background TM material of phantom 2. Measurements were made using a calibrated optical microscope on 500 randomly selected scatterers.
It was considered impractical to try to produce spheres with diameters of 1 mm or less using molding techniques that have been employed for larger spheres. [1] Instead, a simple method for mass producing spheres with a broad range of diameters was employed followed by sieving out appropriate fractions.
The first step in producing the spheres was to make a molten agarose solution containing a concentration of the ultrafiltered milk to yield an attenuation essentially equal to that of the background TM material in which the spheres are suspended. Equal attenuation will prevent B-mode shadowing or enhancement distal to the spheres in the phantom. The concentrations of propylene glycol and Liquid Germall Plus® should be the same in spheres and background material; in the case of propylene glycol, equal concentrations will prevent any change in propagation speed due to diffusion. In a suitable beaker, the powdered agarose is added to the deionized water and propylene glycol solution at room temperature. The beaker is placed in a “double boiler” and heated to about 90°C when the mixture will be a transparent solution. This solution is cooled to about 62°C and the concentrated milk added after heating it also to about 62°C. (The high temperature required to create the transparent agarose is above that at which a solid containing casein can form on the surface (“skin”), a condition to be avoided; that is the reason for the 62°C temperature.) The milk/agarose solution is then cooled to 50°C and the Liquid Germall Plus (preservative) added. A few mL’s of the milk/agarose solution is then added to a 500 mL beaker of 45°C safflower oil and vigorous stirring is done to disperse the milk/agarose solution into small droplets; the droplets form spheres due to surface tension. The beaker is placed in an ice bath so that the temperature is reduced below the 38°C congealing temperature of the agarose. The solidified spheres are allowed to collect at the bottom of the beaker overnight. Most of the oil can be poured off and a solution of deionized water, propylene glycol and Liquid Germall Plus added; the concentrations of the latter (in the solution) are made to equal those in the spheres. Successive stirrings and decanting of the aqueous solution followed by adding more solution frees the spheres of safflower oil. Using more of the aqueous solution, the spheres are sieved (Fisherbrand sieves, Fisher Scientific, Pittsburgh, Pennsylvania, USA) into fractions for use in the various blocks of the phantom.
The TM material for the 3cm×3cm×1cm blocks is made in the same fashion as that for the spheres except that glass bead scatterers are added to the molten form. To make a block with randomly distributed anechoic spheres, 18 mL of the molten background material is poured into a small beaker at about 44°C. Then 2 mL of spheres-plus-interstitial-solution at 44°C is added to the 18 mL of molten background material. After mixing thoroughly, the mixture is poured into a 3cm×3cm×1cm acrylic mold with a syringe barrel attached (BD Syringe, Franklin Lakes, New Jersey, USA). A syringe piston is inserted with exclusion of air, a rubber band applied to maintain positive gauge pressure, and the mold placed in an ice bath to quickly congeal the molten background material. The reference section contains no spheres, of course. Assuming a packing fraction of about 0.6 for the spheres in solution before adding to the molten background material, the volume percent of each block composed of spheres is about 6%.
The sieve openings corresponding to each mean diameter anechoic sphere size are shown in Table 2. Each mean diameter is assumed to be adequately approximated by the average of the 2 corresponding sieve openings.
Table 2.
Mean anechoic sphere diameters and sieve openings corresponding to each.
| Approximate mean diameter of anechoic spheres (μm) | Smaller sieve opening (μm) | Larger sieve opening (μm) |
|---|---|---|
| 100 | 90 | 106 |
| 115 | 106 | 125 |
| 137 | 125 | 150 |
| 200 | 180 | 212 |
| 300 | 280 | 315 |
| 400 | 355 | 450 |
| 530 | 500 | 560 |
| 825 | 800 | 850 |
| 1090 | 1000 | 1180 |
IV. ULTRASONIC PROPERTIES
The only applicable publication found for ultrasonic properties of tissue in the 15 to 55 MHz range is that by Lockwood et al [3] regarding human artery wall and blood. We chose attenuation coefficients to be at a mid-range for artery wall and blood. The backscatter coefficients are also similar to those in that publication. The propagation speed was chosen to be the canonical 1540 m/s.
Small test cylinders (5 mm thick) with parallel 12-μm thick Saran Wrap ® windows were made of each material in the phantoms to allow measurements of ultrasonic properties in the high frequency range. Measurements of propagation speeds and attenuation coefficients were made using a through transmission method described previously. [4] Note that an error in the data reduction equation for the attenuation coefficient appears in that article; the correct expression is α(f) = (20/d) log10 (AoTtotal)/A. Corrections for transmission through the Saran Wrap (Ttotal) were made using a previously published relation. [5] Note also that it is important to correct for the fact that water has been displaced and that the attenuation coefficient αw(f) of water at these high frequencies f is not negligible. The total relation for computing α(f) is therefore α(f) = (20/d) log10 (AoTtotal)/A + αw(f).
The backscatter coefficients for the TM material surrounding the anechoic spheres in the two phantoms have been computed using a theoretical model [6] for the glass bead scatterers and the diameter distributions given in Figs. 3 and 4. The Poisson’s ratio for the TM material was taken to be that of a nearly incompressible medium, viz, 0.499, and the physical properties of the borosilicate glass composing the glass beads were used. [7]
The resulting backscatter coefficients from 15 through 60 MHz are shown in Fig. 5. For comparison, the backscatter coefficients at 40 MHz measured in vitro on human carotid and femoral artery wall media are also shown as is that for moving whole human blood. [3]
Fig. 5.
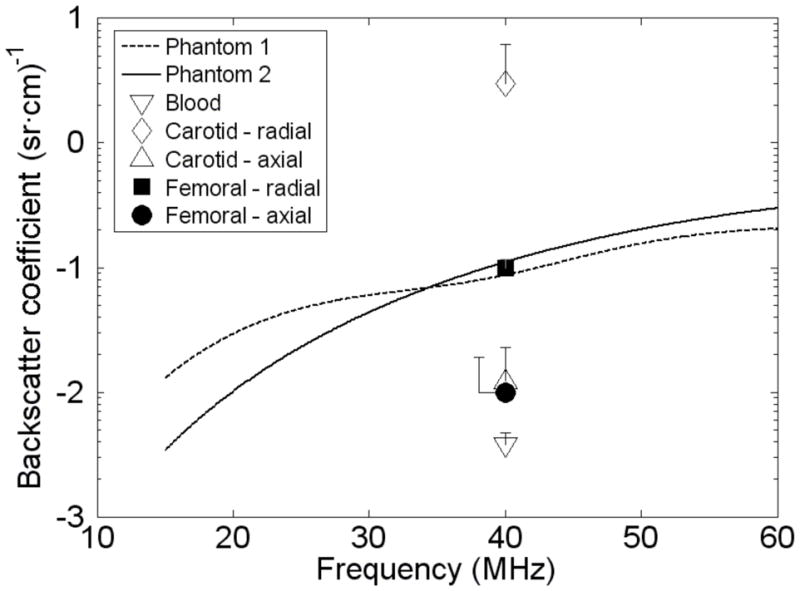
In vitro backscatter coefficients for artery wall media and moving blood [3] at 40 MHz and computed values [6] for the background materials in phantoms 1 and 2.
V. PHANTOM SHELF LIFE AND MAINTENANCE
Except for the scatterer diameter distributions and concentrations, the materials composing the phantoms have been used in laboratory and commercial phantoms for more than ten years. Provided that cylindrical test samples of the materials are kept in sealed containers in a suitably moist environment when not in use for measurements, no change or degeneration of those materials has been observed – including ultrasonic properties (propagation speed, attenuation coefficients and backscatter coefficients – as monitored over eight years or more.
Regarding a suitable moist environment for cylindrical test cylinders corresponding to phantoms 1 and 2, the appropriate storage solution has composition in percents-by-weight of 4.4% propylene glycol, 94.1% de-ionized water and 1.5% Liquid Germall Plus. The cylindrical test cylinders used in measuring ultrasonic properties are kept in a storage container, such as an 8.9″×11.5″×7.4 (W, L and H) (Lock & Lock ® container, cat. no. ZHPL838P (www.heritagemint.com/jump.jsp?itemID=287&itemType=PRODUCT&path=1%2C2%2C7%2C52&iProductID=287). The storage solution forms about a 0.7 cm depth beneath a 1-cm high perforated platform, and the test cylinders are stored on the platform. The storage container has a cover with a seal.
It is probably inconvenient to store the phantoms themselves in such a moist environment. Long-term desiccation occurs primarily through the 12-μm thick Saran Wrap scanning window. All other surfaces are covered with a plastic-coated 25-μm-thick layer of aluminum foil, including such a layer to which the cork base is glued. A removable cap covers the scanning window further discouraging liquid diffusion through the window; the surface of the cap in contact with the scanning window is also covered with the plastic-coated aluminum foil.
After about 10 months the scanning window of phantom 2 was depressed about 0.5 mm due presumably to desiccation.
Following is a six-step way to restore lost liquid.
Clamp a constraining flat plate over the scanning window.
Place the phantom on its side, remove a patch of the plastic-coated aluminum foil from one corner of the phantom (upper surface), clean the glue from the exposed surface and glue an upright acrylic tube -- about 2 cm long and outer diameter about 10 mm onto the exposed plastic.
Immerse the phantom and tube in a container of the storage solution specified above and drill a 2mm hole along the axis of the acrylic tube and through the polycarbonate wall of the phantom so that the tissue-mimicking material is exposed to the storage solution.
Place a 30 cm vertical length of Tygon ® tube (inner diameter about 8 mm) over the acrylic tube and fill to a height of about 20 cm with storage solution. Place a small piece of plastic wrap over the top end of the Tygon tube to prevent short-term evaporation, but make sure that the end is not sealed entirely so that atmospheric pressure is maintained on the upper level of the storage solution.
After 48 hours or less the lost solution will have been replaced, and the scanning window will be flat.
Remove the acrylic tube and Tygon tube and glue a polycarbonate peg (stopper) in the filling hole with Weld-On 4052 glue (IPS Corp., Gardena, CA, USA).
The tissue-mimicking material in the phantom will absorb the infused solution so that the phantom is completely restored.
Note that for custom phantoms made for other labs, we do these “transfusions” for the cost of shipping only.
VI. RESULTS
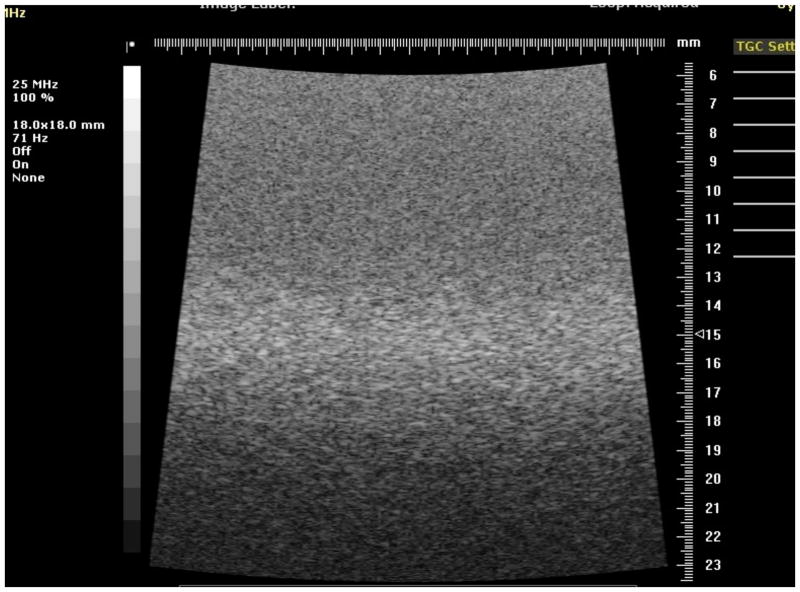
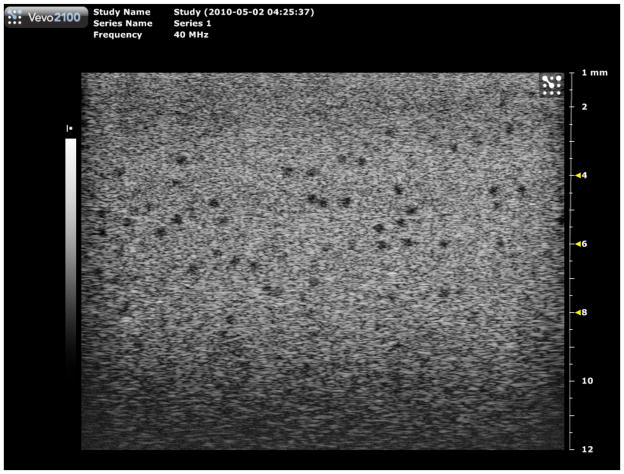
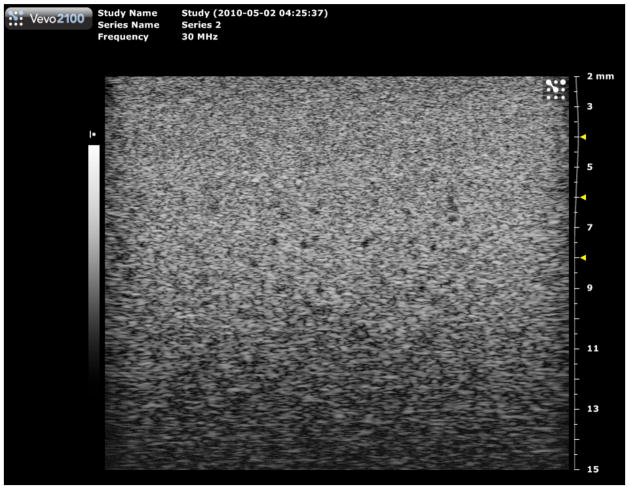
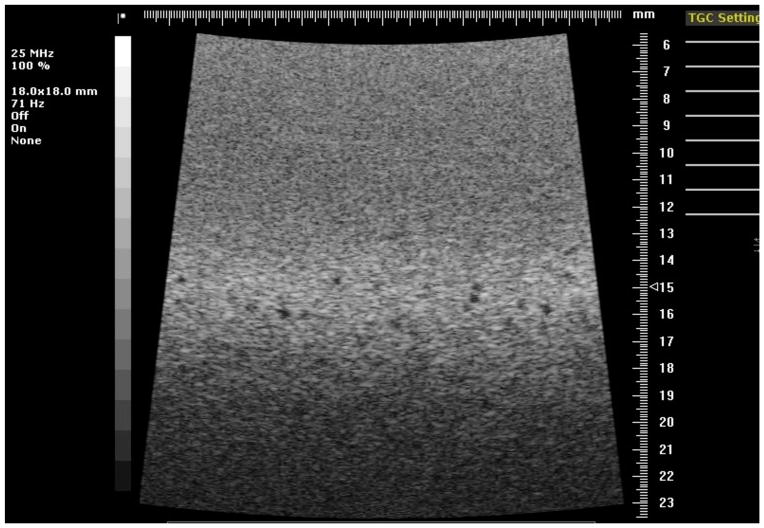
Both phantoms were scanned with VisualSonics models 770 and 2100 for comparison of depth ranges of detectability for the various sphere sizes. Images of the phantoms made with the model 770 are shown in Figures 6–9, and images using the Vevo 2100 are shown in Figures 10 and 11.
Fig. 6.
Image of the reference section of phantom 1 using the 25 MHz model 710B transducer.
Fig. 9.
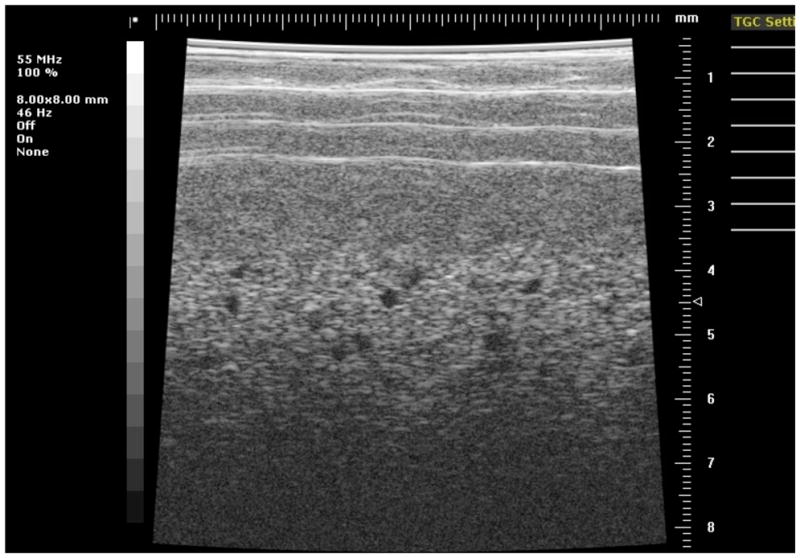
Image of the section of phantom 1 containing 300-μm diameter anechoic spheres using the 55 MHz model 708 transducer.
Fig. 10.
Image of the section of phantom 2 containing 290-μm diameter anechoic spheres using the Vevo 2100 40 MHz model 550 linear array transducer. Multiple focuses at 4, 6 and 8 mm were used corresponding to the results shown in Figure 14. Note that this image was made at a little greater field of view than those used in generating Fig. 15.
Fig. 11.
Image of the section of phantom 2 containing 290-μm diameter anechoic spheres using the Vevo 2100 30 MHz model 400 linear array transducer. Multiple focuses at 4, 6 and 8 mm were used corresponding to the results shown in Figures 13 and 14. Note that this image was made at a little greater field of view than those used in generating Figs. 14 and 15.
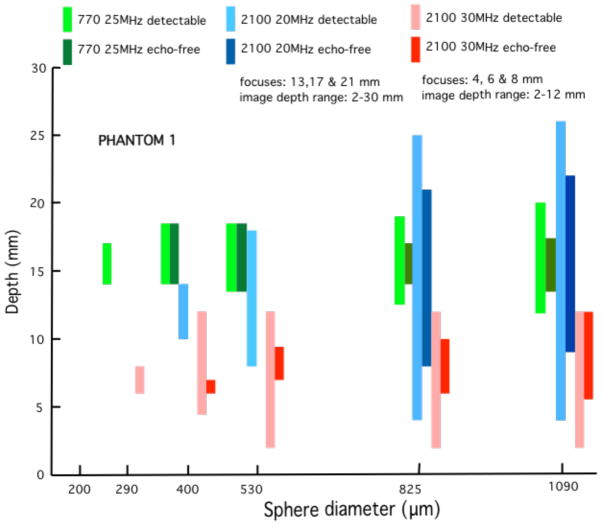
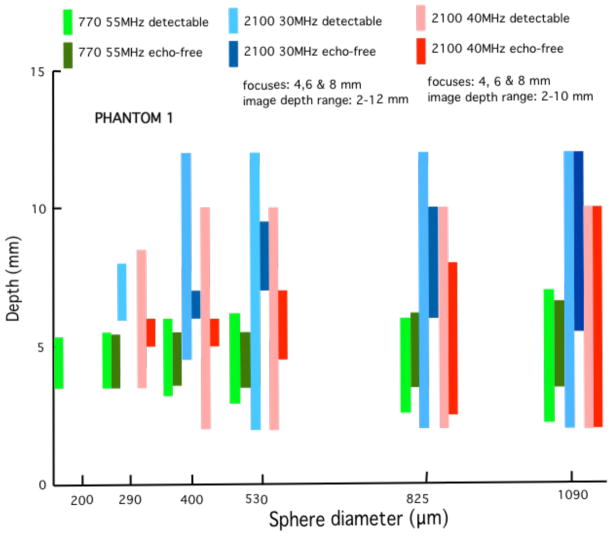
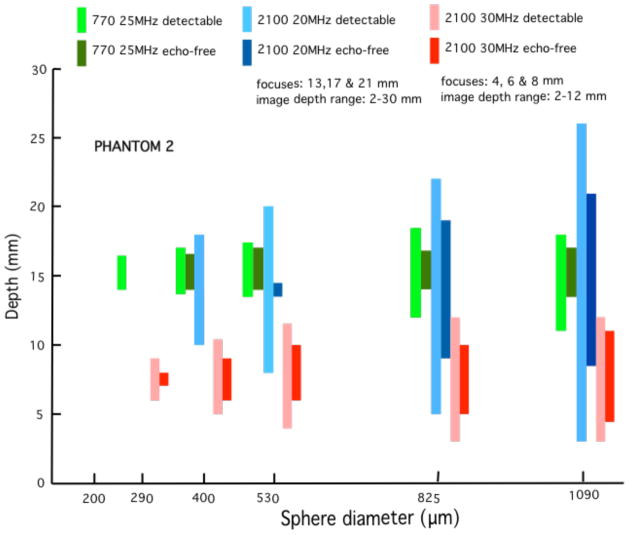
Quantitative results in the form of bar graphs are shown in Figures 12–15. Figures 12 and 13 correspond to use of phantom 1, and Figures 14 and 15 to use of phantom 2. For each sphere diameter, there are six horizontal positions for a bar: the left-most position is for a light green bar corresponding to the depth range over which spheres were detectable in the images using the 770; the next position is for a dark green bar corresponding to the depth range over which the detectable spheres had a significant echo-free area; the next two positions are for bars for detectability and echo-free cases, respectively, at a lower frequency using the 2100; the right-most pair of bars correspond to detectability and echo-free cases, respectively, at a higher frequency using the 2100. The nominal frequencies are comparable. Multiple focus depths for the 2100 linear arrays are shown in the figures. Also, when the 2100 was used, the displayed image depth ranges were restricted and these limits are noted on the figures.
Fig. 12.
Phantom 1 comparison of depth ranges for detectability of -- and for echo-free conditions of -- spheres for the model 770 25 MHz single-element transducer with the cases of the model 2100 20 MHz and 30 MHz linear arrays. The elevational focus of the 20 MHz linear array is most comparable to the fixed focus of the 770 transducer than that of the 30 MHz linear array. As expected, the depth range for detectability of spheres is much more restricted for the single element transducer than for the linear arrays. However, the single element transducer does a little better job of detecting the smallest detectable 300-μm spheres.
Fig. 15.
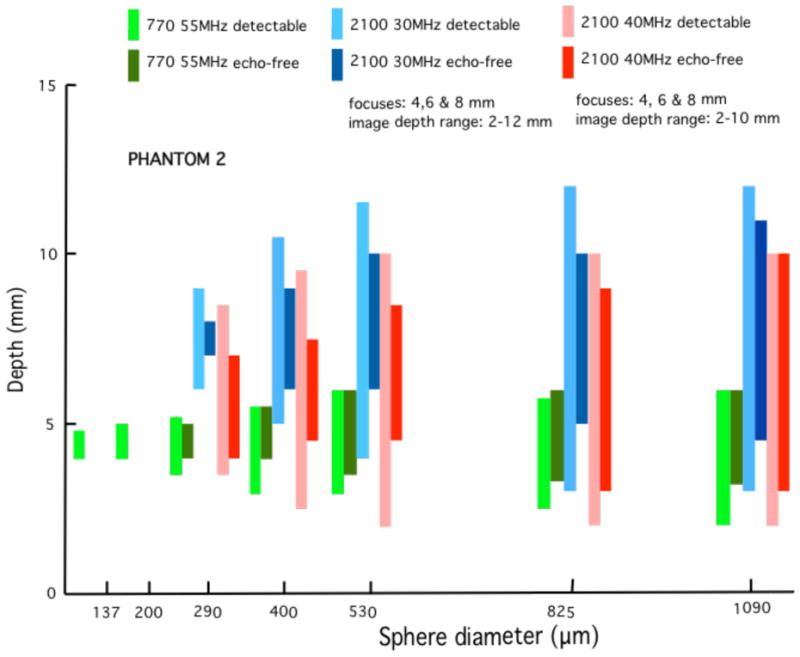
These bar graphs correspond to those in Figure 11 where phantom 2 has been used instead of phantom 1. Results are similar to those obtained using phantom 1. Phantom 2, however, contains a block with 137-μm spheres instead of 115-μm spheres. The 137-μm spheres were detected using the 770 single-element 55 MHz transducer, whereas no such detection occurred for the 115-μm spheres in phantom 1.
Fig. 13.
The same set of bar graphs as in Figure 10, except that the model 770 with single-element 55 MHz transducer is compared with the model 2100 30 and 40 MHz linear arrays. The elevational focus of the 40 MHz linear array appears to be a little closer to the focus of the 55 MHz single element transducer than is that of the 30 MHz linear array. Except for no detection of the 200-μm spheres, the 40 MHz linear array is superior to the single element transducer in terms of the much greater detection depth ranges. The 30 MHz linear array is also very good.
Fig. 14.
These bar graphs correspond to those in Figure 10 where phantom 2 has been used instead of phantom 1. Results are similar to those obtained using phantom 1.
VII. DISCUSSION AND CONCLUSIONS
The two phantoms differ regarding the diameter distribution and concentration (g/mL) of glass bead scatterers in the background TM material. The results are similar, though not identical, for both phantoms. The expected result that the depth ranges of detectability are greater for the linear arrays than for the single-element transducer has been quantified. Also, the single-element transducers -- though very limited in depth ranges of detectability – are somewhat better able than the linear arrays to detect the smallest anechoic spheres. However, the severe limitation in detection depth ranges for the single-element transducers supports the superiority of the linear array system for practical small animal imaging.
These phantoms provide a means for comparing the performance of different versions of high frequency imagers – and comparing different configurations for one system. They will also provide a means for monthly quality assurance for users of those imagers. Addition of a phantom section with accurately positioned and appropriately small diameter fibers for assessing distance measurement accuracy is under development.
The concept of detection of very small anechoic spheres in a realistic tissue-mimicking background can be extended to include other high frequency imagers, such as those used in dermatology and ophthalmology. Particularly in the latter case, some degree of anatomical mimicking may be important.
Fig. 7.
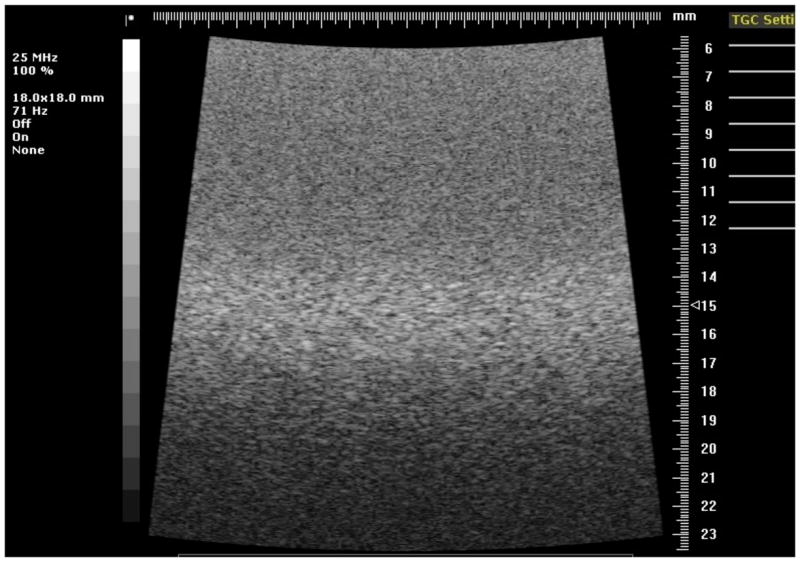
Image of the section of phantom 1 containing 300-μm diameter anechoic spheres using the 25 MHz model 710B transducer.
Fig. 8.
Image of the section of phantom 1 containing 400-μm diameter anechoic spheres using the 25 MHz model 710B transducer.
Table 3.
Ultrasonic propagation speeds and attenuation coefficients at 22°C for materials in phantom 1.
| BACKGROUND | SPHERES | |||||
|---|---|---|---|---|---|---|
| FREQUENCY (MHz) | SPEED (m/s) | ATTEN COEFF (dB/cm) | ATTEN COEFF ÷ FREQUENCY (dB/cm/MHz) | SPEED (m/s) | ATTEN COEFF (dB/cm) | ATTEN COEFF ÷ FREQUENCY (dB/cm/MHz) |
| 20 | 1538.4 | 9.48 | 0.47 | 1538.3 | 9.17 | 0.46 |
| 30 | 1539.8 | 16.72 | 0.56 | 1539.3 | 15.93 | 0.53 |
| 40 | 1540.6 | 27.84 | 0.70 | 1539.8 | 25.25 | 0.63 |
| 50 | 1541.2 | 38.65 | 0.77 | 1540.3 | 34.60 | 0.69 |
Table 4.
Ultrasonic propagation speeds and attenuation coefficients at 22°C for materials in phantom 2.
| BACKGROUND | SPHERES | |||||
|---|---|---|---|---|---|---|
| FREQUENCY (MHz) | SPEED (m/s) | ATTEN COEFF (dB/cm) | ATTEN COEFF ÷ FREQUENCY (dB/cm/MHz) | SPEED (m/s) | ATTEN COEFF (dB/cm) | ATTEN COEFF ÷ FREQUENCY (dB/cm/MHz) |
| 20 | 1540.2 | 9.82 | 0.49 | 1539.3 | 9.23 | 0.46 |
| 30 | 1541.9 | 16.72 | 0.56 | 1540.5 | 14.98 | 0.50 |
| 40 | 1542.2 | 26.27 | 0.66 | 1541.2 | 24.40 | 0.61 |
| 50 | 1543.1 | 37.60 | 0.75 | 1542.2 | 32.11 | 0.64 |
References
- 1.Kofler JM, Jr, Madsen EL. Improved method for determining resolution zones in ultrasound phantoms with spherical simulated lesions. Ultrasound in Med & Biol. 2001;27(12):1667–1676. doi: 10.1016/s0301-5629(01)00473-2. [DOI] [PubMed] [Google Scholar]
- 2.Madsen EL, Frank GR, Dong F. Liquid or solid ultrasonically tissue-mimicking materials with very low scatter. Ultrasound in Med & Biol. 1998;24(4):535–542. doi: 10.1016/s0301-5629(98)00013-1. [DOI] [PubMed] [Google Scholar]
- 3.Lockwood GR, Ryan LK, Hunt JW, Foster FS. Measurement of the ultrasonic properties of vascular tissues and blood from 35–65 MHz. Ultrasound in Med & Biol. 1991;17(7):653–666. doi: 10.1016/0301-5629(91)90096-f. [DOI] [PubMed] [Google Scholar]
- 4.Madsen EL, Dong F, Frank GR, Garra BS, Wear KA, et al. Interlaboratory comparison of ultrasonic backscatter, attenuation, and speed measurements. J Ultrasound Med. 1999;18:615–631. doi: 10.7863/jum.1999.18.9.615. See page 617. [DOI] [PubMed] [Google Scholar]
- 5.Wear KW, Stiles TA, Frank GR, Madsen EL, Cheng F, Feleppa EJ, et al. Interlaboratory comparison of ultrasonic backscatter coefficient measurements from 2 to 9 MHz. J Ultrasound Med. 1999;25:1235–1250. doi: 10.7863/jum.2005.24.9.1235. See pages 1237 & 1238. [DOI] [PubMed] [Google Scholar]
- 6.Faran JJ., Jr Sound scattering by solid cylinders and spheres. J Acoust Soc Am. 1951;23(4):405–418. [Google Scholar]
- 7.Millet J, Bourne N. The shear strength of a shocked borosilicate glass with an internal interface. Scripta Mater. 2000;42:681–685. [Google Scholar]


