

Abstract
Autosomal recessive polycystic kidney disease (ARPKD) is a severe, monogenetically inherited kidney and liver disease. PCK rats carrying the orthologous mutant gene serve as a model of human disease, and alterations in lipid profiles in PCK rats suggest that defined subsets of lipids may be useful as molecular disease markers. Whereas MALDI protein imaging mass spectrometry (IMS) has become a promising tool for disease classification, widely applicable workflows that link MALDI lipid imaging and identification as well as structural characterization of candidate disease-classifying marker lipids are lacking. Here, we combine selective MALDI imaging of sulfated kidney lipids and Fisher discriminant analysis (FDA) of imaging data sets for identification of candidate markers of progressive disease in PCK rats. Our study highlights strong increases in lower mass lipids as main classifiers of cystic disease. Structure determination by high-resolution mass spectrometry identifies these altered lipids as taurine-conjugated bile acids. These sulfated lipids are selectively elevated in the PCK rat model but not in models of related hepatorenal fibrocystic diseases, suggesting that they be molecular markers of the disease and that a combination of MALDI imaging with high-resolution MS methods and Fisher discriminant data analysis may be applicable for lipid marker discovery.
Keywords: autosomal recessive polycystic kidney disease, imaging mass spectrometry, Fisher discriminant analysis, taurocholic acid, Fourier transform ion cyclotron resonance mass spectrometry, Matrix-assisted laser desorption/ionization
Autosomal recessive polycystic kidney disease (ARPKD) is a severe childhood-onset, hepatorenal fibrocystic disease (HRFCD), affecting approximately 1 in 20,000 children (1). It is characterized by the progressive formation of massive renal cysts and by biliary dysgenesis resulting in congenital hepatic fibrosis (2, 3). Human ARPKD is caused by mutations in polycystic kidney and hepatic disease 1, one of the largest known human genes, which is expressed in adult and fetal kidney, liver, pancreas, and lung (4). Clinical outcome of ARPKD is highly variable with different grades of renal and/or hepatic symptoms, but ultimately fatal no later than in early adulthood (1, 5). While hepatocellular function remains relatively stable in ARPKD, decreased urinary concentration capability is commonly the first symptom, followed by successive renal insufficiency. As a consequence, the majority of ARPKD patients undergo kidney transplantation with or without liver transplantation (6, 7). No disease-specific treatment is currently available for ARPKD patients. Therapy is directed at long-term complications, such as hypertension, portal hypertension, renal infections, and recurrent cholangitis (7, 8). Up to now, no simple diagnostic test for ARPKD has been available. Clinical diagnosis and disease monitoring is currently based on imaging techniques, such as ultrasound combined with radiography, magnetic resonance, or computed tomography imaging (1, 2). As clinical manifestations in ARPKD vary in renal and hepatic involvement and as morphological changes might not be indicative for a single type of HRFCD (9, 10), the identification of body fluid-derived markers that could distinguish ARPKD from other HRFCDs is urgently needed.
Recently, glycosphingolipids (GSL) and other sphingolipids have been associated with a variety of diseases, including kidney cancer and some forms of HRFCD (11). For instance, neutral GSL and the acidic ganglioside GM3 are markedly increased in autosomal dominant polycystic kidney disease (ADPKD) and nephronophthisis with mutations in Nphp3 or Nphp9 genes (12–14). However, little is known about GSL levels in ARPKD: In contrast to elevations of some acidic GSLs in ADPKD models, sulfatide levels, for instance, are decreased in cpk/cpk mice, an ARPKD model (15). In contrast to these mice, the disease gene in PCK rats is orthologous to the polycystic kidney and hepatic disease 1 gene affected in human ARPKD (16). Several characteristics of human disease are manifest in homozygous PCK rats (17), allowing for investigation of the molecular pathogenesis and testing of experimental therapeutics (18). We therefore set out to establish a workflow for identification of candidate lipid makers that link molecular alterations in relevant tissues with analytes that could possibly be measured in body fluids.
Until now, use of MALDI imaging mass spectrometry (IMS) for identification of candidate biomarkers has primarily focused on the examination of protein patterns (19–21). However, the identification of proteins corresponding to disease-classifying m/z values, although occasionally accomplished (22), remains a challenging analytical task, as MALDI-IMS protein signals are typically weak and obtained in low-resolution linear detection mode (20). Protein IMS biomarker discovery workflows therefore require follow-up with complementary proteomics methods (22, 23) and immunohistochemical validation (19, 21). On the other hand, mounting experimental evidence suggests that GSLs could be useful molecular markers of disease (24), while at the same time being present in higher concentrations than most proteins and being more readily extracted and analyzed in organic solvents typically used for MALDI-IMS (25). Due to a mass usually below 1,500 Da, lipids are also amenable to MALDI-IMS in reflectron mode, resulting in higher resolution and enabling fragmentation of selected ions for identification by tandem mass spectrometry (25). Therefore, MALDI-IMS of tissue slices may be a useful tool for unbiased preclinical and clinical lipidomic studies (26). In contrast to the analysis of lipid extracts that requires time-consuming handling steps and where distinct classes of lipids might be depleted during certain purification steps (for example, alkaline hydrolysis of phospholipids), MALDI-IMS facilitates exploratory data analysis of numerous lipid classes within their biological environment. We have recently introduced 9-aminoacridine (9-AA) as an IMS matrix for selective and label-free imaging of sulfated lipids in kidney cryosections (27). Hence, we sought to apply MALDI-IMS for the discovery of candidate molecular lipid markers in rat ARPKD kidneys.
Statistical analysis of IMS data sets remains a major challenge in marker discovery utilizing MALDI-IMS (28). Most available computing processes and algorithms, such as principal component analysis or hierarchical clustering, enable the classification of different tissues, e.g., healthy versus diseased, but fail to pinpoint discriminating m/z values that are needed for identification of the corresponding biomolecules. Recently, nonimaging MALDI-TOF MS has been combined with linear discriminant analysis to achieve that goal (29). In microarray data sets even larger than MALDI images, Fisher discriminant analysis (FDA), a related discriminant analysis method, has successfully been applied for gene selection (30); it has previously been used for discrimination of magnetic resonance or positron emission tomography images (31–33). FDA does not make the assumptions of a t-test, such as normally distributed classes, and may therefore be suitable for analysis of MALDI-IMS data sets for which no normal distribution can be assumed.
Here, we present a new workflow for identification of candidate lipid biomarkers of ARPKD, comprising MALDI-IMS with a selective matrix and FDA for feature selection in IMS data sets. This approach revealed a small set of top-scoring FDA m/z values of unexpectedly low mass (m/z 512.3 and 514.3). Detailed investigation of these m/z values in kidney and liver extracts by MALDI-TOF MS indicated strong increases in diseased animals that correlated with disease progression. Furthermore, to enable noninvasive detection and diagnosis, we established relative quantification of these marker candidates in urine. Using chemical reasoning and Fourier transform ion cyclotron resonance (FTICR) MS, taurine-conjugated bile acids were identified as differentiating metabolites that were able to distinguish ARPKD and related rodent HRFCDs.
MATERIALS AND METHODS
Materials
Analytical grade solvents [acetonitrile (ACN), acetone, chloroform, methanol, acetic acid], were obtained from Merck (Darmstadt, Germany). DEAE A-25, potassium acetate, potassium chloride, sodium carbonate, potassium hydroxide, and taurocholic acid (TCA) sodium salt were purchased from Sigma-Aldrich (Taufkirchen, Germany), and SDS, from Fluka. MALDI matrix 9-AA was obtained from Merck, and acidic semisynthetic (3′-Sulfo)Gal-β-Cer(d18:1,C17:0) lipid standard, from Avanti Polar Lipids (Alabaster, AL).
Animals
All experiments were conducted in accordance with the German Animal Protection Law and were approved by the local authority (Regierungspräsidium Karlsruhe, Germany). The following inbred rat strains were used: PCK as model for ARPKD, with Sprague Dawley rats (SDR) as healthy controls. PKD2 mut and PKD/Mhm rats were used as models for ADPKD. For the latter, heterozygous (cy/+) animals (referred to as PKD) develop renal cysts. Unaffected (+/+) rats of the same strain that do not carry the mutant allele were used as controls. Rats received standard rat diet (containing 19% protein) and tap water ad libitum. Male rats were anesthetized with isoflurane prior to sacrificing by neck fracture at 0 (2–3 days), 4, or 10 weeks of age. Kidneys and livers were snap-frozen in liquid nitrogen and stored at −80°C until lipid and RNA extraction. For cryosectioning, organs were slowly frozen on ice-cold isopentane, wrapped in aluminum foil, further frozen in liquid nitrogen and stored at –80°C. For urine collection, 10-week-old male rats were kept in metabolic cages for 24 h and pcy mice (16 weeks of age) for 16 h.
MALDI IMS
MALDI imaging was performed as described previously (27). In brief, frozen rat kidneys were sliced into 10 μm sections using a Leica CM 1900 cryostat (Leica Biosystems, Nussloch, Germany) at −20°C and thaw-mounted onto indium tin oxide-coated conductive glass slides (Bruker Daltonics, Bremen, Germany). Kidney tissue sections of 0- and 4-week-old PCKs and SDRs were measured on the same indium tin oxide glass slide. Likewise, 10-week-old PCKs and SDRs were placed and analyzed together. A following section was transferred onto a normal glass slide for hematoxylin and eosin (H&E) staining. 9-AA [20 mM in ACN/water (80:20, v/v)] was deposited on cryosections using a matrix sprayer (SunChrom, Friedrichsdorf, Germany), where air pressure was set to 2.5 bar. Matrix was deposited in seven layers, where flow rate for the first layer was set to 10 µl/min; second layer, 15 µl/min; third, 20 µl/min, and fourth to seventh, 25 µl/min. Mass spectrometric measurements were performed using Autoflex III MALDI-TOF/TOF instruments (Bruker Daltonics) in negative ion-reflector mode with baseline subtraction in the range from 450 to 1000 Da. Images were acquired at a spatial resolution of 100 μm with 200 laser shots per position by flexImaging 2.1 software (Bruker Daltonics).
MALDI-IMS data classification by Fisher linear discriminant analysis
MALDI imaging raw spectra were converted to a MATLAB (Version 7.11.0584, R2010b) readable format. The conversion software is available from the authors. Un-binned m/z-ratios were averaged over class 1 (SDR) and class 2 (PCK). For noise suppression and data reduction, all m/z with intensity threshold < 1 [a.u.] in both averaged spectra were determined and subsequently excluded from the entire set of spectra. The resulting filtered spectra sets of class 1 and class 2 were normalized to standard deviation = 1 and mean = 0 (z-score normalization). Subsequently, for each remaining m/zi, the Fisher discriminant value (FDi) was determined:
| Eq. 1 |
where μi1 and μi2 denote the mean intensities of m/zi of class 1 and class 2, and σi12 and σi22 denote the corresponding variances (supplementary Fig. I). Resulting FDi were ranked in descending order, where m/z values with the most discriminating FDi were chosen for further evaluation. For comparison, a two-sample t-test with pooled variance was performed on the same MALDI-imaging data sets (supplementary Fig. II). The null hypothesis was that the data are independent random samples from normal distributions with equal means, against the alternative that the means are not equal. The formula is
| Eq. 2 |
where
| Eq. 3 |
and where n1 and n2 denote the number of observations of class 1 and class 2.
FTICR mass spectrometry
FTICR MS was performed on a solariX 12T Fourier transform mass spectrometer (FTMS) (Bruker Daltonics) equipped with a dual ESI/MALDI ion source. Spectra were acquired in ESI negative ion mode with 50 scans for each spectrum; 1 MW acquisition size and 2 MW processing size. Measurement was done in broadband mode for overview and SORI-CID for MS/MS, isolating the respective precursor mono-isotopically, including single shots for clean precursor isolation. Liver extract was dissolved in 20 vol and urine extract in 1 vol ACN/H2O (1/1, v/v) and compared with 1 pmol of TCA in ACN/H2O (1/1, v/v). Mass spectra were calibrated in DataAnalysis, where the spectrum of TCA was internally calibrated (single point correction for [M-H]−). This calibration was used to externally calibrate the urine- and liver-extract spectra.
Preparation of GSL extracts
Kidneys and livers were weighed and homogenized for 2 min on ice in 10 vol of sodium carbonate buffer (200 mM, pH 9.3) using an Polytron PT 1200E (Kinematica, Luzern, Switzerland). Urine was diluted in 2 vol of sodium carbonate buffer. The homogenate and diluted urine was freeze-dried at −49°C and 0.2 mbar, followed by lipid extraction with 20 vol chloroform/methanol/water (twice with 10:10:1, v/v/v, once with 30:60:8). The remaining pellet was dried over night at 70°C and weighted for normalization of the GSL extract to the kidney dry weight. Pooled supernatants were dried with a rotary evaporator at 45°C and redissolved in 5 vol of 0.1 M potassium hydroxide in methanol for mild alkaline hydrolysis of phospholipids (37°C). The suspension was sonicated every 20 min for 1 min. Six µl acetic acid per ml of 0.1 M potassium hydroxide was added after 2 h to neutralize the samples. The extract was dried again and resuspended in 10 vol of aqueous 0.1 M potassium chloride with sonication. For solid phase extraction, 500 mg Bond Elute C18 cartridges (Agilent Technologies) per 500 mg kidney/liver wet weight and up to 5 ml urine were used. After activating the column stepwise with (a) chloroform, (b) chloroform/methanol (1:1, v/v), (c) methanol, (d) methanol/water (1:1, v/v), and (e) 0.1 M potassium chloride, the extract was loaded. The sample tube was rinsed with 0.1 M potassium chloride and applied onto the column. The flow through was loaded again, before desalting the column with 10 column volumes of distilled water. The lipid extract was eluted with four column volumes of methanol and four column volumes of chloroform/methanol (1:1, v/v). Pooled eluates were loaded on DEAE Sephadex A-25 preconditioned with 1M methanolic potassium acetate. The column was rinsed with 9 ml methanol containing neutral GSLs. Acidic GSL were eluted with 6 ml of 1M methanolic potassium acetate followed by evaporation of the organic solvent. The dried acidic lipid fraction was redissolved in 6 ml distilled water and was applied again on a 500 mg Bond Elut C18 cartridge for desalting as described above. Finally, the eluate was dried under air stream (45°C), and stored at −20°C.
MALDI-TOF mass spectrometry on ground steel target
MALDI-TOF MS was performed on an Autoflex III MALDI-TOF/TOF instrument (Bruker Daltonics) equipped with a smartbeam laser (200 Hz) and controlled by flexControl 3.0 software (Bruker Daltonics). The instrument was set to an acceleration voltage of 19 kV; spectra were acquired in reflector negative ion mode. Acidic kidney extracts were dissolved in 25 vol ACN/H2O (1:1, v/v) of dry weight, supplemented with final concentrations of 0.25 µM (3′-Sulfo)Gal-β-Cer(d18:1,C17:0) and 0.56 µM SDS; liver extracts were dissolved in 60 vol ACN/H2O (1:1, v/v) containing 4.1 µM (3′-Sulfo)Gal-β-Cer(d18:1,C17:0) and 115 µM SDS; and urine extracts were dissolved in 2 vol ACN/H2O (1:1, v/v) supplemented with 0.31 µM (3′-Sulfo)Gal-β-Cer(d18:1,C17:0) and 0.88 µM SDS for relative quantification. This solutions were mixed 1:1 (v/v) with 4 mg/ml 9-AA in ACN/H2O (80:20, v/v) as matrix. An AutoXecute method was defined to sum up 4,000 laser shots at 20 different positions of a spot. Only spectra with minimum half width of less than 0.2 Da were accumulated, and acquisition was quit after 50 consecutive failed judgments. For relative quantitation of defined lipids, nine spots were prepared for each sample on a ground steel target. MALDI mass spectra were calibrated using the above-mentioned internal standards. Baseline subtraction, peak signal to noise (S/N) ratios, intensity, resolution, and area were determined with flexAnalysis 3.0 software (Bruker Daltonics). Mass spectrometric data were evaluated using ClinProTools 2.2 software (Bruker Daltonics), where peak picking was done with S/N threshold of >5 with a maximal peak number of 80 per single spectrum. Minimal occurrence for peak aggregation was set to 20% with aggregation width of 500 ppm. Peak calculation was based on intensities.
Biochemical analysis of blood and urine
Blood for determination of kidney and liver function parameters was taken retrobulbary under isoflurane anesthesia in Li-Heparin-containing microfuge tubes. Blood was centrifuged at 3,000 g for 15 min at 4°C, and plasma was stored at −20°C until further processing. Biochemical parameters, including cholesterol, triglycerides, total bilirubin, urea, creatinine, Ca2+, Na+, K+, PO43-, glucose, total protein, and enzyme activity of glutamate dehydrogenase (GLDH), γ-glutamyl transferase (GGT), alanine aminotransferase (ALAT), and alkaline phosphatase (ALP), were determined by standard laboratory methods (cobas c311 analyzer, Roche Diagnostics, Mannheim, Germany).
Gene expression profiling
Total RNA was isolated from frozen liver tissue of 10-week-old rats with Trizol reagent (Invitrogen) as described by the manufacturer and subjected to genome-scale gene expression profiling using GeneChip® Rat Gene 1.0 ST Array and GeneChip® Scanner 3000 7G (Affymetrix). The raw fluorescence intensity values were imported with a Custom CDF Version 15 with Entrez-based gene definition. The values were normalized applying quantile normalization. Differential gene expression was analyzed with one-way ANOVA, using a commercial software package (SAS JMP7 Genomics, version 4; SAS Institute, Cary, NC). A false-positive rate of a = 0.05 with false discovery rate correction was taken as the level of significance. Gene set enrichment analysis was used to determine whether defined sets of genes exhibit a statistically significant bias in their distribution within a ranked gene list (34). Pathways belonging to various cell functions, such as cell cycle or apoptosis, were obtained from public external databases (KEGG, http://www.genome.jp/kegg/).
Statistical analysis
Averaged peak area/intensity (A/I) ratios of the individual samples were calculated using ClinProTools software. Normalization to either (3′-Sulfo)Gal-β-Cer(d18:1,C17:0) or SDS standard, calculation of mean, standard deviation for diseased and control samples, and two-tailed t-tests were performed with Excel. ANOVA was calculated by GraphPad Prism 5.04 software. The level of significance was set to P < 0.05 unless stated otherwise.
RESULTS AND DISCUSSION
MALDI IMS and FDA of imaging data sets reveal changes in acidic lipids in the PCK rat model of ARPKD
Pursuing our goal of using lipid MALDI-IMS for the discovery of candidate markers in a rat model of ARPKD, we chose 9-AA as matrix, which preferentially facilitates ionization of sulfated lipids (27, 35). Zero, 4, and 10-week-old cystic PCK kidneys were compared with SDR kidneys as healthy controls (Fig. 1A and supplementary Fig. III). Adjacent sections were processed for MALDI-IMS analysis. Signal intensity and distribution of rodent kidney housekeeping lipids, such as phosphatidyl inositol PI(18:0;20:4) (m/z 885.6) did not differ between healthy and cystic kidneys (Fig. 1B), confirming that matrix coverage of the tissue slices was homogeneous and that MALDI-IMS data acquisition was robust. The most prominent sulfatide in rat kidney, (3′-Sulfo)Gal-β-Cer(d18:1;h24:0) (m/z 906.7), comprising a singly unsaturated sphingosine base (d18:1) and a hydroxylated fatty acid (h24:0), was mainly localized to the inner and to a lesser extent to the outer medulla in 4- and 10-week-old animals (Fig. 1C). For more information on nomenclature of sulfatides, see Ref. 27. (3′-Sulfo)Gal-β-Cer(d18:1,26:0) (m/z 918.6) served as a reference point in images (Fig. 1C, D). In contrast to sphingosine-based (3′-Sulfo)Gal-β-Cer(d18:1;h24:0), the phytosphingoid-based (3′-Sulfo)Gal-β-Cer(t18:0;h24:0) (m/z 924.6) with identical sugar head group and fatty acid was found in the papilla as well as in the inner medulla of 4- and 10-week-old PCK and SDR kidneys (Fig. 1D), confirming our earlier findings of distinct localizations of (3′-Sulfo)Gal-β-Cer isoforms containing phytosphingoid bases (27). Interestingly, intensities of all detected sulfatides in healthy and diseased kidneys were very low in neonate organs, suggesting that lipid metabolism might be different. In contrast to expectations based on studies in cpk/cpk mice (15), however, sulfatides appeared to be at best marginally reduced in PCK rats (Fig. 1C, D). For verification of whether sulfatides were reduced in the ARPKD model and possibly for identification of other acidic lipids or unknown, low-mass metabolites that might serve as marker for ARPKD, we sought to develop a statistical method for the analysis of complex MALDI-IMS data sets and for selection of discriminant m/z values. Linear FDA generally compares two or more classes of data, for which (in contrast to t-tests or ANOVA analysis) no normal distribution is assumed. Here, all spectra recorded from the PCK kidney (PCK class) and those recorded from the SDR kidney (SDR class) were compared and underwent discriminant analysis. A high FD value was obtained for those m/z values that are characterized by a large difference between the mean ion intensities of the PCK and SDR classes and low variances within each class. Two independent MALDI-IMS data sets, biological replicates of different 10-week-old PCK and SDR kidneys, were analyzed. Reproducibly, a small number of high FD values were found in the m/z range between 512.2 and 515.6 (Fig. 2 and supplementary Table I). Data analysis by Student t-test would be a less preferred data analysis option: On the one hand, it has the fundamental malus of assuming a normal distribution of data that may not be given for MALDI-IMS data sets. Nevertheless, for comparison, a Student t-test was performed on the same MALDI-IMS data (supplementary Fig. II). Indeed, the highest t-values were obtained for m/z 512.3 and 514.3. However, the plot of m/z versus t-value was noisier than that against FD values (Fig. 2 versus supplementary Fig. II). We concluded that m/z 512.3 and 514.3 were the highest scoring candidates with both data analysis methods and therefore best suited for experimental follow-up.
Fig. 1.

MALDI IMS reveals only subtle differences in renal sulfatide levels in the PCK rats. Imaging experiments were performed with kidney tissue sections of 0- and 4-week-old PCK and SDR placed on the same glass slide, and 10-week-old PCK and SDR measured together on a second glass slide. (A) Micrographs of H&E-stained adjacent tissue sections; anatomical structures are visible, such as papillae, medulla, and cortex, as well as cystic regions affecting predominantly the PCK rat medulla. (B) Uniform ion intensity distribution of the membrane component PI(18:0;20:4) with m/z 885.6 in healthy and cystic kidneys. (C) Prominent (3′-Sulfo)Gal-β-Cer (d18:1;h24:0) with m/z 906.7 (red) is primarily localized to the inner medulla and to a lesser extent to the outer medulla, whereas (3′-Sulfo)Gal-β-Cer(d18:1,26:0) with m/z 918.6 (green) is only found in the papilla. (D) Ion intensity distribution of (3′-Sulfo)Gal-β-Cer(t18:0,h24:0) with m/z 924.6 (red) in diseased and control kidneys. For (3′-Sulfo)Gal-β-Cer isoforms, a tendency toward lower ion intensities in PCK compared with SDR kidneys is observed.
Fig. 2.

FDA identifies m/z values that distinguish between cystic PCK rat and healthy Sprague-Dawley rat kidneys. (A, B) FDA of MALDI-IMS data sets obtained from two biological replicates, in which kidney sections from two different 10-week-old PCK and SDR were compared. Top scoring disease-discriminating m/z values were obtained in the mass range 512–516 Da.
Signal intensity in MALDI MS images of both m/z 512.3 and 514.3 correlated with cyst progression in PCK kidneys (Fig. 3). Whereas m/z 512.3 was detected in neither SDR kidneys nor neonate PCK rat kidneys, it was localized to papilla and medulla of 4-week-old PCK kidneys, and it was detected in virtually everywhere in 10-week-old organs, including most of the fluid-filled cysts (Fig. 3B). Localization of m/z 514.3 and 512.3 was similar, with the exception of low intensity m/z 514.3 signals that were already detected in neonate kidneys (Fig. 3C). This ion was found in both healthy and cystic kidneys, perhaps reflecting differences in metabolism between newborn rat organs and later developmental stages or an unresolved unrelated ion (see below). In contrast, no differences in signal intensity and no localization to fluid-filled cysts were observed for m/z 465.3, the mass of which is consistent with cholesterol sulfate (ChSulf) (Fig. 3D).
Fig. 3.

MALDI IMS of m/z with top-scoring FDA values illustrate dramatic increases of m/z 512.3 and 514.3 in PCK kidneys during development. (A) Micrographs of H&E-stained adjacent tissue sections. (B, C) Localization of m/z 512.3 and m/z 514.3, molecular species with highest FDA values. While m/z 512.3 is neither detected in PCK nor SDR new born rat kidneys, low intensity signals of m/z 514.3 are localized in cystic as well as healthy 0-week-old (0 w) kidneys. Both candidate markers are clearly visible in the inner part of 4-week-old (4 w) cystic kidneys. In 10-week-old (10 w) PCK kidneys, ion intensities of m/z 512.3 and 514.3 are dramatically increased, predominantly in cysts and cortex. (D) Ion distribution of m/z 465.3, consistent with ChSulf, is evenly distributed in 4- and 10 week-old diseased and control kidneys. Images are representative of two independent experiments.
To validate the findings obtained by MALDI-IMS and statistical analysis and to take biological variability into account, we extracted lipids from six PCK and six SDR kidneys (both 10 weeks of age) and subjected them to MALDI-TOF MS analysis with 9-AA matrix in a dried droplet preparation on a ground steel target. A/I ratios for individual m/z were calculated by ClinProTools software, and A/I values of peaks corresponding to high FD values were normalized to SDS. Interestingly, A/I values of m/z 512.3 and 514.3 in kidney extracts confirmed the dramatic increase of these biomolecules in PCK kidneys. Compared with unaffected SDR normalized A/I ratios for m/z 512.3 were ∼58-fold and for m/z 514.3, ∼46-fold increased, whereas m/z 465.3 (ChSulf) remained unchanged (Fig. 4A). Encouraged by these unexpected findings, we wondered whether m/z 512.3 and m/z 514.3 could be detected in urine of PCK rats as well. Aiming for an easily accessible marker for ARPKD, we established extraction and relative quantification of TCA in urine by MALDI-TOF MS using acidic extracts supplemented with SDS as standard. Surprisingly, A/I ratios of the two molecular species were ∼12-fold (m/z 512.3) and ∼21-fold (m/z 514.3) higher in PCK compared with SDR urine (Fig. 4B). As hepatic involvement is a common feature in ARPKD, we addressed the question whether m/z 512.3 and 514.3 could be found in cystic livers, too. To this end, we prepared liver acidic lipid extracts and analyzed them by MALDI-TOF MS. We noticed that concentrations of m/z 512.3 and 514.3 in liver were about 200 times higher than in kidney extracts (data not shown), suggesting that the origin of these molecular species may be liver. A/I ratios of m/z 512.3 were already significantly elevated in neonate PCK rats, with a striking increase in 4-week-old livers and a moderate increase thereafter. Much lower but significant levels of m/z 512.3 were observed in SDR livers (Fig. 4C). However, the time course of m/z 514.3 in liver was different from that of m/z 512.3: neonate levels of m/z 514.3 in both PCK and SDR livers were higher than in 4-week-old livers (compare Fig. 4D with Fig. 3B, C). Again, we wondered whether another, unresolved molecular species was interfering.
Fig. 4.

MALDI-TOF MS analysis reveals time-dependent increase of m/z with top-scoring FDA values in extracts of PCK kidney, urine, and liver. (A) Kidney A/I ratios of m/z 512.3 and 514.3 are strongly enhanced in 10-week-old (10 w) cystic PCK kidneys, whereas ChSulf (m/z 465.3) remains unchanged. Means ± SD were calculated for n = 6 each of male PCKs and SDRs for four technical replicates. (B) Urine A/I ratios of marker candidates are ∼12-fold (m/z 512.3) and ∼21-fold (m/z 514.3) higher in PCK compared with SDR urine. Means were calculated for PCK n = 3 and SDR n = 3. Results are means of three technical replicates ± SD. (C, D) Liver A/I ratios of m/z 512.3 and m/z 514.3 are significantly increased in 0-, 4-, and 10-week-old PCK rats. Means were determined for 0-week-old PCK (n = 5) and SDR (n = 6), for 4-week-old PCK (n = 3) and SDR (n = 3), and for 10-week-old PCK (n = 6) and SDR (n = 6) male rats. Means ± SD were calculated for four technical replicates. *P < 0.01, **P < 0.001, and ***P < 0.0001 by two-tailed t-test.
High resolution FTMS identified m/z 512.3 and 514.3 as TCAs
We next sought to identify the molecular species corresponding to m/z 512.3 and 514.3. Database search (http://www.lipidmaps.org/ and http://www.genome.jp/kegg/pathway.html) revealed several options for lipids possessing a mass of 514.3 ± 0.2 Da ([M-H+]−) (Fig. 5A). To discriminate between these options, we performed high-resolution FTICR MS of a urine sample and obtained an accurate mass of 514.28407 amu for the deprotonated molecular ion in urine and the likely elemental sum formula C26H44NO7S, both of which were indicative of TCA (Fig. 5B). In contrast, monoacylglycero-phosphocholine (18:4/0:0) and 2-aminoethylphosphocholate, two molecules consistent with a mass of 514.3 and corresponding to the sum formula C26H46NO7P, would have been detected with theoretical m/z 514.29391 in negative ion mode (Fig. 5A, B). The fine structure of m/z 514.28407 in the highly resolved spectrum unambiguously pointed to the presence of the element sulfur and thus again to the presence of TCA (Fig. 5C). In contrast to phosphorus, sulfur has several stable isotopes, the most prominent being 34S that is indicated as m/z 516.280193 in the simulation of the sulfur fine structure in C26H44NO7S (Fig. 5C). MS/MS experiments were performed to further prove this finding. FTICR SORI CID after mono-isotopic isolation directly yielded fragments of urine and liver m/z 514.3 [m/z 79.95739 (SO3), m/z 106.98087 (C2H3O3S), and m/z 124.00742 (NC2H5O3S)], which were indicative of a taurine-conjugated bile acid (BA) (Fig. 5D, E). To validate our chemical reasoning, we obtained pure TCA substance and demonstrated that its parent mass, derived sum formula, and fragmentation pattern were identical with the metabolite in urine and liver referred to as m/z 514.3 (Fig. 5F). Interestingly, m/z 512.26845 was measured with exactly 2.01562 Da less than 514.28407 (Fig. 5B). The molecular weight of two hydrogen atoms indicates an additional double bond in otherwise related molecules, which was confirmed by FTMS SORI-CID fragmentation of m/z 512.3 (data not shown). The position of the proposed double bond in m/z 512.3 cannot be inferred from these studies. However, it may be at C-5 (36). For validation of the unusually high m/z 514.3 levels in neonate PCK and SDR rat livers (i.e., to rule out an interfering, unresolved analyte), we compared fragments of this precursor ion in 0-week-old livers with fragments of the same m/z in urine of 10-week-old PCK rats by MALDI-TOF/TOF MS (supplementary Fig. IV-A, B). In all cases, we detected the same fragments, suggesting that m/z 514.3 in neonate PCK (supplementary Fig. IV-B) and SDR livers (data not shown) was the same molecule as that in urine of adult PCK rats (supplementary Fig. IV-A). It is tempting to speculate that the observed biphasic behavior of m/z 514.3 in liver might be explained by changes in homeostasis of cholesterol-oxidoreductase enzyme activities during rat development (36).
Fig. 5.

High-resolution FTMS identifies candidate molecular markers as taurine-conjugated bile acids. (A) Structures, sum formulae, and theoretical m/z values of candidate molecules suggested by a lipid database search (515.3 ± 0.5 Da): Monoacylglycero-phosphocholine (18:4/0:0), 2-aminoethylphosphocholate, and TCA (the latter with possible MS/MS fragments of the taurine conjugate). (B) Zoom-in of the high resolution FTMS spectrum of PCK urine extract in the range m/z 511.9–514.7 obtained in ESI negative ion mode. The elemental sum formula for the accurate mass of m/z 514.28407 was calculated to be C26H44NO7S, which is consistent with the sum formula of TCA. A mass difference of 2.01562 between m/z 512.26845 and m/z 514.28407 corresponds to two hydrogen atoms. (C) Zoom-in of the M+2 isotope peak of m/z 514.28407 and (D) simulation of the characteristic 34S M+2 peak for C26H44NO7S. The presence of the element sulfur (arrow) in the spectrum instead of phosphorus confirms the identity of TCA in PCK urine extracts. SORI-CID was performed for MS/MS comparison of m/z 514.28 from (D) urine and (E) liver extracts. Parent molecular ions and characteristic fragmentation patterns with m/z 79.95739 (SO3), m/z 106.98087 (C2H3O3S), and m/z 124.00742 (NC2H5O3S) are consistent with the (F) parent mass and fragmentation pattern obtained for pure reference TCA.
Synthesized in hepatocytes from cholesterol, individual BAs and their metabolites play an important role in a number of physiological functions, such as lipid absorption and signaling (37). Nevertheless, accumulated BAs are cytotoxic and may cause severe hepatocyte damage (38, 39). Conjugation of BAs with glycine or taurine increases their water solubility and therefore supports elimination and excretion of cholesterol and BAs into feces or urine (37). It is now recognized that cilia play an important role in the regulation of bile flow (40). The pathogenesis of several hepatorenal fibrocystic diseases is linked to ciliary sensory dysfunction (1), as all defective proteins identified so far are localized to these organelles. The 447 kDa membrane-bound ARPKD-gene product of polycystic kidney and hepatic disease 1, fibrocystin/polyductin localizes at the basal bodies to primary cilias of cholangiocytes (41, 42). In complex with other functional ciliary proteins, fibrocystin/polyductin is thought to regulate intracellular calcium responses (43, 44). Decreased intracellular calcium levels and increased cAMP concentrations in rodent models of ARPKD were found to be associated with increased proliferation (8, 43, 45) and secretion of bile acids (40).
As conjugated BAs are catabolic end products of cholesterol (38, 39), we further evaluated cholesterol concentrations in plasma, revealing 2-fold increased levels (Fig. 6A), whereas concentrations of triglyceride were decreased (Fig. 6B) in 10-week-old diseased animals. In a previous study, significant hyperlipidemia with an increase in both serum cholesterol and triglycerides had been reported for PCK rats of about 18 weeks of age (17). Owing to their detergent properties, excessively accumulated liver bile acids are known to be cytotoxic and to cause hepatocyte damage (38, 39). Therefore, we assessed liver function by plasma clinical chemistry analysis of total bilirubin and enzyme activity of GLDH, GGT, and ALAT. In accordance with Ref. 17, an increase in bilirubin was observed (Fig. 6C). Both GGT and GLDH activity were dramatically increased (Fig. 6D, E), suggesting acute liver damage by accumulated bile acids, whereas ALAT, another indicator for hepatocellular injury, in particular for viral infections such as hepatitis or mononucleosis, was reduced (Fig. 6F). In contrast to recent disease stage characterization in the PCK rat (17), ALP, a marker for bile duct obstruction, was unchanged, together with unaffected levels of glucose (supplementary Table II). Renal function was not deteriorated in 10-week-old PCK rats, as total protein, urea, sodium, and creatinine levels in plasma were equal to the examined SDR control group (supplementary Table II).
Fig. 6.

Cholesterol and liver function parameters are changed in PCK rats. (A) Cholesterol is increased ∼2-fold in plasma of 10-week-old PCK, whereas (B) triglyceride concentration is decreased. (C) Total bilirubin levels as well as enzyme activity of (D) GGT and (E) GLDH were found to be markedly enhanced in plasma of cystic animals. In contrast, (F) ALAT activity decreased. Means ± SD were calculated for diseased PCK (n = 3) and control SDR (n = 3) male, 10-week-old rats. *P < 0.05 by two-tailed t-test.
In an attempt to elucidate some of the underlying mechanisms leading to increases in cholesterol and taurine-conjugated bile acids in PCK rats, we performed genome-scale gene expression profiling of PCK and SDR livers (10 weeks of age) using the GeneChip® Rat Gene 1.0 ST. Several pathways were found to be upregulated in cystic livers (supplementary Table III). The functional significance of most upregulated pathways for pathogenesis of cystic disease in PCK rats remains to be established, but enhanced expression of the steroid biosynthesis pathway (RNO00100) may be the cause of the observed increased levels of cholesterol (Fig. 6A). Surprisingly, the primary bile acid biosynthesis (RNO00120) and cysteine and methionine metabolism (RNO00270) pathways, both of which are involved in biosynthesis of TCA, were found to be downregulated in diseased livers (supplementary Table IV). Whereas this finding may suggest a compensatory mechanism in liver gene expression aiming at reducing levels of toxic BA, it does not explain the presence of very high TCA levels in the first place. Possible functional explanations for TCA accumulation include but are not limited to increased biosynthesis rate by regulation on the translational level, faster enzyme kinetics, or strongly reduced secretion or excretion. Whereas each of these possible mechanisms warrants experimental follow-up, expression levels of steroid and bile acid biosynthesis genes alone comprise a transcriptional signature that distinguishes between diseased and healthy livers, as judged by hierarchical clustering analysis (supplementary Fig. V).
TCA is specific for the PCK rat model of ARPKD and is not detected in models of related hepatorenal fibrocystic diseases
Given that TCA measured in kidney and urine extract was able to discriminate ARPKD rats from healthy animals, we wondered whether it could further distinguish ARPKD from related HRFCDs, such as ADPKD and nephronophthisis. Two ADPKD models were examined. PKD2 mut transgenic rats and PKD (cy/+) were compared with PCK rats together with the unaffected rat strains SDR and PKD (+/+) by kidney lipid extraction and MALDI-TOF MS. Interestingly, A/I ratios for TCAs in ADPKD kidney extracts were as low as in healthy kidneys. Compared with all the tested rat strains, A/I ratios of TCAs were 34- to 58-fold (m/z 512.3) and 24- to 46-fold (m/z 514.3) increased in PCK kidney extract (Fig. 7A). In addition, urine of the pcy mouse model of nephronophthisis caused by a mutation in the gene orthologous to human Nphp3 was compared with PCK urine. Here, A/I ratios were ∼11-fold (m/z 512.3) and ∼17-fold (m/z 514.3) higher in PCK compared with pcy urine (Fig. 7B).
Fig. 7.
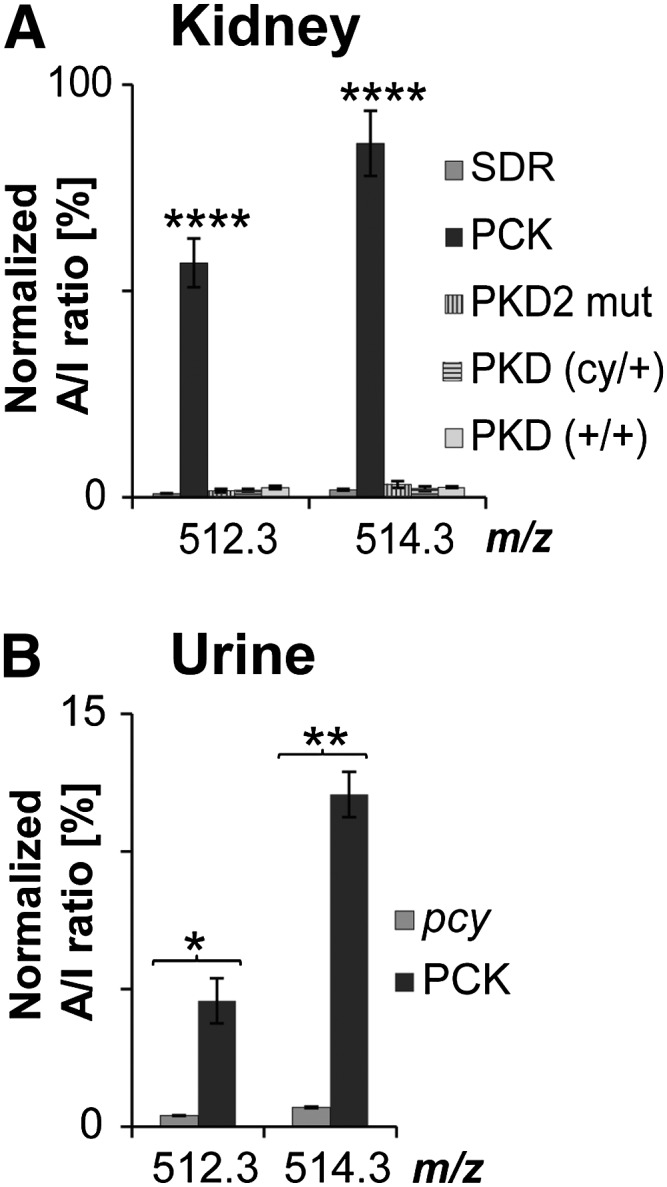
TCA is specifically increased in the PCK rat model of ARPKD but not in models of related HRFCDs. (A) Normal levels of TCA in kidney extracts of ADPKD rat models PKD2 mut and PKD. A/I ratios were 34- to 58-fold (m/z 512.3) and 24- to 46-fold (m/z 514.3) increased in PCK compared with ADPKD and healthy control rat strains. MALDI-TOF MS analysis was performed with SDR (n = 6), PKD2 mut (n = 3), unaffected PKD(+/+) (n = 5), cystic PKD(cy/+) (n = 6), and PCK (n = 6), all 10-week-old males. Values represent means ± SD of three independent experiments. ****P < 0.0001 as level of significance by a one-way ANOVA. (B) Normal levels of TCA in urine of the nephronophthisis pcy mouse model. A/I ratios were ∼11-fold (m/z 512.3) and ∼17-fold (m/z 514.3) higher in PCK compared with pcy urine. Means were calculated for PCK (n = 3) and pcy (n = 3). Values are expressed as means ± SD of three technical replicates. *P < 0.01, **P < 0.001 by two-tailed t-test.
Metabolomic profiling is now increasingly used for biomarker discovery in several pathologies, including hepatobiliary diseases (46). For example, metabolites involved in bile acid biosynthesis, such as glycochenodeoxycholic acid 3-sulfate, glycocholic acid, glycodeoxycholic acid, TCA, and taurochenodeoxycholate, are downregulated in human hepatocellular carcinoma (47), whereas urinary bile acid excretion of sulfated chenodeoxycholic acid is markedly increased in primary biliary cirrhosis and cholestatic liver disease (39, 48).
SUMMARY
Taken together, our results suggest that MALDI-IMS in combination with FDA can be useful in the discovery of disease-differentiating metabolites. Aiming for an easily accessible marker for ARPKD, we established relative quantification of the marker candidates in urine by MALDI-TOF MS. Among other possible biomolecules, TCA was precisely identified due to the pinpoint mass accuracy of FTICR MS. Finally, strong increases of TCA in kidney and urine of diseased animals were able to distinguish ARPKD and related rodent HRFCDs.
Supplementary Material
Acknowledgments
The authors thank Victoria Skude, Elisabeth Wühl, Isabell Moskal, Cathleen Fichtner, Peter Heinz, and Petra Prochazka for their assistance with the rats and mice. Clinical plasma chemistry is gratefully acknowledged to Petra Schwartz and Elisabeth Seelinger.
Footnotes
Abbreviations:
- 9-AA
- 9-aminoacridine
- ACN
- acetonitrile
- ADPKD
- autosomal dominant polycystic kidney disease
- A/I
- peak area/intensity average of individual sample
- ALAT
- alanine aminotransferase
- ALP
- alkaline phosphatase
- ARPKD
- autosomal recessive polycystic kidney disease
- BA
- bile acid
- ChSulf
- cholesterol sulfate
- FDA
- Fisher discriminant analysis
- FTICR
- Fourier transform ion cyclotron resonance
- FTMS
- Fourier transform mass spectrometry
- GGT
- gamma-glutamyl transferase
- GLDH
- glutamate dehydrogenase
- GSL
- glycosphingolipid
- H&E
- hematoxylin and eosin
- HRFCD
- hepatorenal fibrocystic disease
- IMS
- imaging mass spectrometry
- PI
- phosphatidylinositol
- SDR
- Sprague Dawley rat
- S/N
- signal to noise
- TCA
- taurocholic acid
This work was supported by the Baden-Württemberg Ministry of Science and Culture (INST 874/2-1 LAGG to C.H.) and by a joined grant (“ZAFH ABIMAS”) from ZO IV by the Landesstiftung Baden-Württemberg and the Europäischer Fonds für regionale Entwicklung (EFRE; to N.G., B.W., and C.H.).
The online version of this article (available at http://www.jlr.org) contains supplementary data in the form of five figures and four tables.
REFERENCES
- 1.Gunay-Aygun M. 2009. Liver and kidney disease in ciliopathies. Am. J. Med. Genet. C. Semin. Med. Genet. 151C: 296–306 [DOI] [PMC free article] [PubMed] [Google Scholar]
- 2.Harris P. C., Torres V. E. 2009. Polycystic kidney disease. Annu. Rev. Med. 60: 321–337 [DOI] [PMC free article] [PubMed] [Google Scholar]
- 3.Wen J. 2011. Congenital hepatic fibrosis in autosomal recessive polycystic kidney disease. Clin. Transl. Sci. 4: 460–465 [DOI] [PMC free article] [PubMed] [Google Scholar]
- 4.Ward C. J., Hogan M. C., Rossetti S., Walker D., Sneddon T., Wang X., Kubly V., Cunningham J. M., Bacallao R., Ishibashi M., et al. 2002. The gene mutated in autosomal recessive polycystic kidney disease encodes a large, receptor-like protein. Nat. Genet. 30: 259–269 [DOI] [PubMed] [Google Scholar]
- 5.Bergmann C., Senderek J., Kupper F., Schneider F., Dornia C., Windelen E., Eggermann T., Rudnik-Schoneborn S., Kirfel J., Furu L., et al. 2004. PKHD1 mutations in autosomal recessive polycystic kidney disease (ARPKD). Hum. Mutat. 23: 453–463 [DOI] [PubMed] [Google Scholar]
- 6.Chapal M., Debout A., Dufay A., Salomon R., Roussey G., Burtey S., Launay E. A., Vigneau C., Blancho G., Loirat C., et al. 2012. Kidney and liver transplantation in patients with autosomal recessive polycystic kidney disease: a multicentric study. Nephrol. Dial. Transplant. 27: 2083–2088 [DOI] [PubMed] [Google Scholar]
- 7.Dell K. M. 2011. The spectrum of polycystic kidney disease in children. Adv. Chronic Kidney Dis. 18: 339–347 [DOI] [PMC free article] [PubMed] [Google Scholar]
- 8.Sato Y., Ren X. S., Nakanuma Y. 2012. Caroli's disease: current knowledge of its biliary pathogenesis obtained from an orthologous rat model. Int. J. Hepatol. 2012: 107945. [DOI] [PMC free article] [PubMed] [Google Scholar]
- 9.Salomon R., Saunier S., Niaudet P. 2009. Nephronophthisis. Pediatr. Nephrol. 24: 2333–2344 [DOI] [PMC free article] [PubMed] [Google Scholar]
- 10.Torres V. E., Harris P. C. 2009. Autosomal dominant polycystic kidney disease: the last 3 years. Kidney Int. 76: 149–168 [DOI] [PMC free article] [PubMed] [Google Scholar]
- 11.Mather A. R., Siskind L. J. 2011. Glycosphingolipids and kidney disease. Adv. Exp. Med. Biol. 721: 121–138 [DOI] [PubMed] [Google Scholar]
- 12.Natoli T. A., Smith L. A., Rogers K. A., Wang B., Komarnitsky S., Budman Y., Belenky A., Bukanov N. O., Dackowski W. R., Husson H., et al. 2010. Inhibition of glucosylceramide accumulation results in effective blockade of polycystic kidney disease in mouse models. Nat. Med. 16: 788–792 [DOI] [PMC free article] [PubMed] [Google Scholar]
- 13.Natoli T. A., Husson H., Rogers K. A., Smith L. A., Wang B., Budman Y., Bukanov N. O., Ledbetter S. R., Klinger K. W., Leonard J. P., et al. 2012. Loss of GM3 synthase gene, but not sphingosine kinase 1, is protective against murine nephronophthisis-related polycystic kidney disease. Hum. Mol. Genet. 21: 3397–3407 [DOI] [PMC free article] [PubMed] [Google Scholar]
- 14.Chatterjee S., Shi W. Y., Wilson P., Mazumdar A. 1996. Role of lactosylceramide and MAP kinase in the proliferation of proximal tubular cells in human polycystic kidney disease. J. Lipid Res. 37: 1334–1344 [PubMed] [Google Scholar]
- 15.Deshmukh G. D., Radin N. S., Gattone V. H., 2nd, Shayman J. A. 1994. Abnormalities of glycosphingolipid, sulfatide, and ceramide in the polycystic (cpk/cpk) mouse. J. Lipid Res. 35: 1611–1618 [PubMed] [Google Scholar]
- 16.Nagao S., Kugita M., Yoshihara D., Yamaguchi T. 2012. Animal models for human polycystic kidney disease. Exp. Anim. 61: 477–488 [DOI] [PubMed] [Google Scholar]
- 17.Mason S. B., Liang Y., Sinders R. M., Miller C. A., Eggleston-Gulyas T., Crisler-Roberts R., Harris P. C., Gattone V. H., 2nd 2010. Disease stage characterization of hepatorenal fibrocystic pathology in the PCK rat model of ARPKD. Anat. Rec. (Hoboken). 293: 1279–1288 [DOI] [PMC free article] [PubMed] [Google Scholar]
- 18.Renken C., Fischer D. C., Kundt G., Gretz N., Haffner D. 2011. Inhibition of mTOR with sirolimus does not attenuate progression of liver and kidney disease in PCK rats. Nephrol. Dial. Transplant. 26: 92–100 [DOI] [PubMed] [Google Scholar]
- 19.Balluff B., Schone C., Hofler H., Walch A. 2011. MALDI imaging mass spectrometry for direct tissue analysis: technological advancements and recent applications. Histochem. Cell Biol. 136: 227–244 [DOI] [PubMed] [Google Scholar]
- 20.Cazares L. H., Troyer D. A., Wang B., Drake R. R., Semmes O. J. 2011. MALDI tissue imaging: from biomarker discovery to clinical applications. Anal. Bioanal. Chem. 401: 17–27 [DOI] [PMC free article] [PubMed] [Google Scholar]
- 21.Schwamborn K. 2012. Imaging mass spectrometry in biomarker discovery and validation. J. Proteomics. 75: 4990–4998 [DOI] [PubMed] [Google Scholar]
- 22.Rauser S., Marquardt C., Balluff B., Deininger S. O., Albers C., Belau E., Hartmer R., Suckau D., Specht K., Ebert M. P., et al. 2010. Classification of HER2 receptor status in breast cancer tissues by MALDI imaging mass spectrometry. J. Proteome Res. 9: 1854–1863 [DOI] [PubMed] [Google Scholar]
- 23.Hanrieder J., Wicher G., Bergquist J., Andersson M., Fex-Svenningsen A. 2011. MALDI mass spectrometry based molecular phenotyping of CNS glial cells for prediction in mammalian brain tissue. Anal. Bioanal. Chem. 401: 135–147 [DOI] [PubMed] [Google Scholar]
- 24.Battula V. L., Shi Y., Evans K. W., Wang R. Y., Spaeth E. L., Jacamo R. O., Guerra R., Sahin A. A., Marini F. C., Hortobagyi G., et al. 2012. Ganglioside GD2 identifies breast cancer stem cells and promotes tumorigenesis. J. Clin. Invest. 122: 2066–2078 [DOI] [PMC free article] [PubMed] [Google Scholar]
- 25.Berry K. A., Hankin J. A., Barkley R. M., Spraggins J. M., Caprioli R. M., Murphy R. C. 2011. MALDI imaging of lipid biochemistry in tissues by mass spectrometry. Chem. Rev. 111: 6491–6512 [DOI] [PMC free article] [PubMed] [Google Scholar]
- 26.Liu Y., Chen Y., Momin A., Shaner R., Wang E., Bowen N. J., Matyunina L. V., Walker L. D., McDonald J. F., Sullards M. C., et al. 2010. Elevation of sulfatides in ovarian cancer: an integrated transcriptomic and lipidomic analysis including tissue-imaging mass spectrometry. Mol. Cancer. 9: 186. [DOI] [PMC free article] [PubMed] [Google Scholar]
- 27.Marsching C., Eckhardt M., Grone H. J., Sandhoff R., Hopf C. 2011. Imaging of complex sulfatides SM3 and SB1a in mouse kidney using MALDI-TOF/TOF mass spectrometry. Anal. Bioanal. Chem. 401: 53–64 [DOI] [PubMed] [Google Scholar]
- 28.Alexandrov T. 2012. MALDI imaging mass spectrometry: statistical data analysis and current computational challenges. BMC Bioinformatics. 13(Suppl. 16): S11. [DOI] [PMC free article] [PubMed] [Google Scholar]
- 29.Hettick J. M., Kashon M. L., Slaven J. E., Ma Y., Simpson J. P., Siegel P. D., Mazurek G. N., Weissman D. N. 2006. Discrimination of intact mycobacteria at the strain level: a combined MALDI-TOF MS and biostatistical analysis. Proteomics. 6: 6416–6425 [DOI] [PubMed] [Google Scholar]
- 30.Fung E. S., Ng M. K. 2007. On sparse Fisher discriminant method for microarray data analysis. Bioinformation. 2: 230–234 [DOI] [PMC free article] [PubMed] [Google Scholar]
- 31.Merhof D., Markiewicz P. J., Platsch G., Declerck J., Weih M., Kornhuber J., Kuwert T., Matthews J. C., Herholz K. 2011. Optimized data preprocessing for multivariate analysis applied to 99mTc-ECD SPECT data sets of Alzheimer's patients and asymptomatic controls. J. Cereb. Blood Flow Metab. 31: 371–383 [DOI] [PMC free article] [PubMed] [Google Scholar]
- 32.Markiewicz P. J., Matthews J. C., Declerck J., Herholz K. 2011. Verification of predicted robustness and accuracy of multivariate analysis. Neuroimage. 56: 1382–1385 [DOI] [PMC free article] [PubMed] [Google Scholar]
- 33.Mayerhoefer M. E., Schima W., Trattnig S., Pinker K., Berger-Kulemann V., Ba-Ssalamah A. 2010. Texture-based classification of focal liver lesions on MRI at 3.0 Tesla: a feasibility study in cysts and hemangiomas. J. Magn. Reson. Imaging. 32: 352–359 [DOI] [PubMed] [Google Scholar]
- 34.Subramanian A., Tamayo P., Mootha V. K., Mukherjee S., Ebert B. L., Gillette M. A., Paulovich A., Pomeroy S. L., Golub T. R., Lander E. S., et al. 2005. Gene set enrichment analysis: a knowledge-based approach for interpreting genome-wide expression profiles. Proc. Natl. Acad. Sci. USA. 102: 15545–15550 [DOI] [PMC free article] [PubMed] [Google Scholar]
- 35.Cheng H., Sun G., Yang K., Gross R. W., Han X. 2010. Selective desorption/ionization of sulfatides by MALDI-MS facilitated using 9-aminoacridine as matrix. J. Lipid Res. 51: 1599–1609 [DOI] [PMC free article] [PubMed] [Google Scholar]
- 36.Shea H. C., Head D. D., Setchell K. D., Russell D. W. 2007. Analysis of HSD3B7 knockout mice reveals that a 3alpha-hydroxyl stereochemistry is required for bile acid function. Proc. Natl. Acad. Sci. USA. 104: 11526–11533 [DOI] [PMC free article] [PubMed] [Google Scholar]
- 37.Huang J., Bathena S. P., Csanaky I. L., Alnouti Y. 2011. Simultaneous characterization of bile acids and their sulfate metabolites in mouse liver, plasma, bile, and urine using LC-MS/MS. J. Pharm. Biomed. Anal. 55: 1111–1119 [DOI] [PubMed] [Google Scholar]
- 38.Alnouti Y. 2009. Bile Acid sulfation: a pathway of bile acid elimination and detoxification. Toxicol. Sci. 108: 225–246 [DOI] [PubMed] [Google Scholar]
- 39.Hofmann A. F., Hagey L. R. 2008. Bile acids: chemistry, pathochemistry, biology, pathobiology, and therapeutics. Cell. Mol. Life Sci. 65: 2461–2483 [DOI] [PMC free article] [PubMed] [Google Scholar]
- 40.Larusso N. F., Masyuk T. V. 2011. The role of cilia in the regulation of bile flow. Dig. Dis. 29: 6–12 [DOI] [PMC free article] [PubMed] [Google Scholar]
- 41.Ward C. J., Yuan D., Masyuk T. V., Wang X., Punyashthiti R., Whelan S., Bacallao R., Torra R., LaRusso N. F., Torres V. E., et al. 2003. Cellular and subcellular localization of the ARPKD protein; fibrocystin is expressed on primary cilia. Hum. Mol. Genet. 12: 2703–2710 [DOI] [PubMed] [Google Scholar]
- 42.Zhang M. Z., Mai W., Li C., Cho S. Y., Hao C., Moeckel G., Zhao R., Kim I., Wang J., Xiong H., et al. 2004. PKHD1 protein encoded by the gene for autosomal recessive polycystic kidney disease associates with basal bodies and primary cilia in renal epithelial cells. Proc. Natl. Acad. Sci. USA. 101: 2311–2316 [DOI] [PMC free article] [PubMed] [Google Scholar]
- 43.Wang S., Zhang J., Nauli S. M., Li X., Starremans P. G., Luo Y., Roberts K. A., Zhou J. 2007. Fibrocystin/polyductin, found in the same protein complex with polycystin-2, regulates calcium responses in kidney epithelia. Mol. Cell. Biol. 27: 3241–3252 [DOI] [PMC free article] [PubMed] [Google Scholar]
- 44.Sweeney W. E., Jr., Avner E. D. 2006. Molecular and cellular pathophysiology of autosomal recessive polycystic kidney disease (ARPKD). Cell Tissue Res. 326: 671–685 [DOI] [PubMed] [Google Scholar]
- 45.Wang X., Harris P. C., Somlo S., Batlle D., Torres V. E. 2009. Effect of calcium-sensing receptor activation in models of autosomal recessive or dominant polycystic kidney disease. Nephrol. Dial. Transplant. 24: 526–534 [DOI] [PMC free article] [PubMed] [Google Scholar]
- 46.Griffiths W. J., Koal T., Wang Y., Kohl M., Enot D. P., Deigner H. P. 2010. Targeted metabolomics for biomarker discovery. Angew. Chem. Int. Ed. Engl. 49: 5426–5445 [DOI] [PubMed] [Google Scholar]
- 47.Ressom H. W., Xiao J. F., Tuli L., Varghese R. S., Zhou B., Tsai T. H., Ranjbar M. R., Zhao Y., Wang J., Di Poto C., et al. 2012. Utilization of metabolomics to identify serum biomarkers for hepatocellular carcinoma in patients with liver cirrhosis. Anal. Chim. Acta. 743: 90–100 [DOI] [PMC free article] [PubMed] [Google Scholar]
- 48.Raedsch R., Lauterburg B. H., Hofmann A. F. 1981. Altered bile acid metabolism in primary biliary cirrhosis. Dig. Dis. Sci. 26: 394–401 [DOI] [PubMed] [Google Scholar]
Associated Data
This section collects any data citations, data availability statements, or supplementary materials included in this article.