

Abstract
Background
Cardiovascular diseases (CVD) are a leading cause of mortality among adults in India, and their risk factors (tobacco, hypertension, diabetes, overweight, and obesity) are common. Most risk-factor surveys have focused on young and middle aged adults. We measured the prevalence of risk factors for CVD among elderly (age 60 years or more) in rural India.
Methods and results
In a door-to-door cross-sectional survey we did a non-laboratory based assessment of risk factors (smoking or tobacco use in any form, diabetes mellitus, either known or newly detected hypertension, abnormal waist-hip-ratio, or a high body mass index) among elderly living in 23 villages in rural central India. Laboratory based assessment of risk factors was done in those who had two or more of the five measured conventional risk factors. We compared the distribution of risk factors between men and women. Among 2424 elderly included in the study (51% women, mean age 67), the prevalence of smokeless tobacco use was 50.8% (95% CI 48.1–52.8; smoking 10.5% (95% CI 9.3–11.8); and hypertension46.3% (95% CI 44.3–48.4). Only 10.2% participants were previously known to have had hypertension, and remaining 36.1% were detected to be hypertensive during the survey. A total of 8.2%(95% CI 7.0–9.5) participants were overweight and 4.1% (95% CI 3.3–4.9) had central obesity. The prevalence of dyslipidemia in those who underwent blood based tests was 40.6% (95% CI 36.5–44.9); and hyperglycemia 4.9% (95% CI 3.2–7.1).
Conclusions
Strategies to reduce the risk of cardiovascular disorders among elderly should be focused on reducing tobacco use and early detection and optimal control of hypertension.
Keywords: Cardiovascular, Elderly, Epidemiology, Risk factors
1. Introduction
Cardiovascular diseases (CVD; coronary artery, cerebro-vascular, and peripheral vascular diseases) are a leading cause of mortality among middle aged and older adults in India,1 with current prevalence estimates of 10–12% in urban and 4–5% in rural adults.2 It is now well known that conventional risk factors (smoking, hypertension, diabetes mellitus, obesity, dyslipidemia, unhealthy diet, and reduced physical activity) together account for more than 95% of population-attributable risk for CVD, and novel risk factors have only a small contribution to make.3 These risk factors, attributed to a set of life-style changes are prevalent both in urban and rural India.4
Most previous risk-factor studies have focused on young and middle aged adults, and results from these are usually extrapolated to elderly.5 Three decades ago, we had performed CVD risk factor prevalence studies in middle and young adults in the same villages of rural central India, and prevalence of either hypertension or manifest coronary artery disease was low.6,7 It is possible that with the passage of time, and a change in the life-style of rural people, more villagers could have acquired risk factors for CVD. Further, little is known about the prevalence of risk factors in rural elderly. Hence, we designed this study to know the distribution of CVD risk factors among elderly in rural India.
2. Materials and methods
2.1. Ethics statement
In this study, we performed a community-based door-to-door cross-sectional survey. We first held a meeting of stakeholders in the village and verbally explained the study process. After obtaining community consent, we performed a survey to identify and enumerate all members in all the households. In each household, we obtained a written informed consent from the eligible participants first at the time of risk factor interview (step 1) and subsequently before performing laboratory based measurements in those with two or more risk factors, and those who requested such testing (step 2). The study design and consent process was approved by the institutional review board for research in human subjects, at Mahatma Gandhi Institute of Medical Sciences, Sevagram (IRB # IRB00003623, FWA # 00005186).
2.2. Setting
Wardha district, located in central India, has a population of 1.2 million (2001 census), 75% of which is rural. Mahatma Gandhi Institute of Medical Sciences (MGIMS) Sevagram is a rural based teaching hospital located in the district, and has a network of community health workers who provide outreach services to surrounding villages. We conducted this study in 23 of these villages, located in Kharangana Gode and Hamdapur primary health center blocks. These villages have a combined population of about 20,000, and 15% of population is estimated to be of age 60 years or more. We conducted this study between April 2009 and March 2010.
2.3. Inclusions and exclusions
In step 1 of the study, we sought to include all individuals who: (a) normally reside in the village most of the times and; (b) self-reported themselves to be 60 years or more at the time of household survey. All the eligible and consenting individuals in step 1 of the study were eligible for step 2 if they had two or more of the following five risk factors: Smoking or tobacco use in any form, diabetes mellitus, either known or newly detected hypertension, high waist circumference, or a high body mass index (BMI). In addition individuals with fewer risk factors, but those who requested blood based tests were also included in step 2.
2.4. Study procedures
2.4.1. Risk factor questionnaire
We translated WHO-STEPS questionnaire in Marathi, a local language, pilot tested the questionnaire, and taught five community health workers for administering the questionnaire. The questionnaire included demographic variables, smoking, tobacco use, known hypertension, diabetes, stroke, and acute coronary syndrome. Each participant was asked about years of formal education completed, which was used as a surrogate for socioeconomic status. We defined use of any inhalational tobacco product (such as cigarette, bidi, or pipe) as smoking. We asked for alcohol use and number of years of exposure. If a participant smoked, we assessed the duration and frequency of smoking. We classified use of chewable tobacco or snuff as smokeless tobacco use. We inquired about the duration of smokeless tobacco use, but did not quantify this exposure as no standard pack sizes are locally available. We defined individuals to be “known hypertensive” if they were ever told by a doctor that their blood pressure was high. Individuals who were either not screened for hypertension or were told to have a normal blood pressure in the past were classified as “previously not known hypertensive.” Histories of diabetes mellitus, stroke, and acute coronary syndrome were self-reported by participants, and were verified from medical records, if available.
2.4.2. Measurement of blood pressure
We measured blood pressure by digital Omron apparatus (Omron SEM-1, Omron Corporation, Kyoto, Japan). All the community health workers were taught how to use the equipment in the same training session. After initial training, each health-care worker measured blood pressure on same set of twenty volunteers. The percent agreement between observers for systolic and diastolic blood pressure ranged from 93.02 to 97.67 (agreement beyond chance or kapaa statistic ranged from 0.53 to 0.84). The health workers obtained three readings, 3 min apart, in the sitting position, using standard methodology.
2.4.3. Anthropometry
We obtained four anthropometric measurements: Weight, height, waist circumference, and hip circumference. We used standardized mechanical spring-based weighing machines (resolution 0.5 kg, range 0–200 kg) to measure weight. In each village, we identified five sites where heights would be measured and used measuring tapes to graduate the wall of each site from 120 to 190 cm above the floor (resolution 1 cm. To measure height, we asked participants to stand on a plain surface, against the graduated wall. We used non-stretchable measuring tapes (resolution 0.1 cm, range 0–150 cm) to measure waist circumference. The waist circumference was measured in standing position at the midpoint between the lowest costal cartilage and the iliac crest.
2.4.4. Laboratory based tests
We performed blood sugar, lipid profile, and serum creatinine measurements in step 2 of the study. We estimated fasting capillary blood glucose level using portable glucometers (One touch, LifescanInc, Milpitas, USA), and defined a value greater than 126 mg/dl as hyperglycemia. Lipid levels were measured on fasting serum samples, and all tests were performed using photometry in the same accredited laboratory (Thyrocare technologies Ltd., Mumbai India). Lipid fractions were estimated using CHOD-POD formula.
2.5. Statistical analysis
We evaluated distribution of risk factor variables, and compared those in men with women. We estimated 95% confidence intervals for all proportions, and standard deviations for all means. We used chi square test to compare proportions and Student's t-test to compare means, and used P < 0.01 as a level of significance. We calculated the average of three systolic and diastolic blood pressures (SBP, DBP) readings. Individuals with “known hypertension” were classified as “uncontrolled” if the average SBP was more than or equal to 140 mmHg or average DBP more than or equal to 90 mmHg. We used JNC-7 classification to classify individuals on the basis of their blood pressure (normal, pre-hypertension, stage 1 or stage 2 hypertension). Waist circumference of more than 85 cm and 90 cm was considered as abnormal in women and men respectively. We used height and weight measurements to calculate body mass index (BMI), and BMI of 25 kg/m2or more was considered as high. We defined abnormal serum cholesterol as greater than 200 mg/dl; LDL cholesterol as 130 mg/dl; and serum triglycerides as 150 mg/dl. HDL cholesterol values lower than 40 mg/dl in men, and 50 mg/dl in women were considered as abnormal. We defined dyslipidemia as presence of any one of the above lipid abnormalities. Serum creatinine was measured using modified Jaffe's method. We used Cockcroft–Gault formula to estimate creatinine clearance.8 All statistical analyzes were performed using STATA (version 11, College station, TX).
3. Results
Of the total 2761 eligible elderly individuals, 2424 (87.7%) agreed to participate in step 1 of the study (1250 women (51.6%) and 1174 men (48.4%); mean age 67 (SD 6.5) years). The prevalence of manifest CVD was 3.3% (95% CI 2.7–4.1), Stroke 2% (95% CI 1.6–2.6), and Acute coronary syndrome 1.3% (95% CI 1.0–1.8). Information for manifest CVD events was verified from the patient records in all 36 patients with acute coronary syndrome, and 38 out of 55 (69%) patients with stroke. Step 1 risk-factor assessment was completed in 1941 (80.1%) of all participating individuals [Fig. 1]. Most participants had not received any formal education. Men tended to use tobacco more frequently compared to women. About half the study participants agreed that they had used smokeless tobacco in the past50.8% (95% CI 48.1–52.8); by contrast only a tenth of study participants had smoked (10.5% (95% CI 9.3–11.8))[Table 1].
Fig. 1.
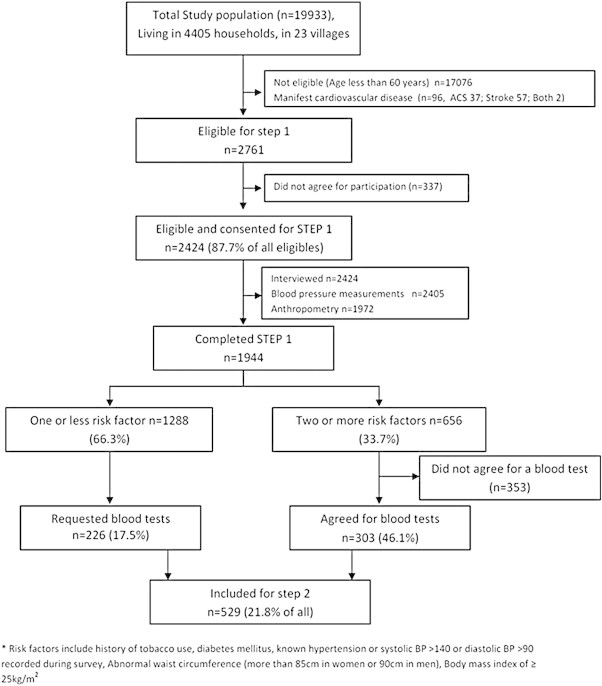
Study profile.
Table 1.
Demographic profile, and use of tobacco products and alcohol in study population (n = 2424).
| Variable | All | Women | Men | P-value |
|---|---|---|---|---|
| Total number | 2424 | 1250 | 1174 | |
| Mean age (SD) | 67.01 (6.55) | 66.1 (6.21) | 67.9 (6.78) | <0.001 |
| Age | ||||
| 60–74 years | 2004 (82.6) | 1066 (85.2) | 938 (79.8) | |
| 75 years or more | 420 (17.4) | 184 (14.8) | 236 (21.2) | <0.001 |
| Education | ||||
| No formal schooling | 1543 (63.6) | 1001 (79.8) | 548 (46.4) | |
| 1–5 years | 836 (35.4) | 247 (19.3) | 594 (50.5) | |
| 5–10 years | 38 (1.5) | 10 (0.9) | 28 (2.3) | |
| 10 years or more | 7 (0.3) | 0 (0.0) | 7 (0.8) | <0.001 |
| Smoking | ||||
| Never smoker | 2169 (89.5) | 1243(99.4) | 926 (78.9) | |
| Past smokers | 19 (0.8) | 2 (0.2) | 17 (1.5) | |
| Current smokers | 236 (9.7) | 5 (0.4) | 231 (19.6) | <0.001 |
| Smoking or oral tobacco use | ||||
| Never used either | 1011 (41.7) | 705 (56.4) | 306 (26.1) | |
| Oral tobacco alone | 1153 (47.8) | 538 (43.0) | 620 (52.8) | |
| Smoking alone | 176 (7.3) | 4 (0.4) | 172 (14.7) | |
| Used both | 79 (3.2) | 3 (0.2) | 76 (6.4) | <0.001 |
| Smoking duration | ||||
| Never used | 2169 (89.5) | 1243(99.5) | 926 (78.9) | |
| Less than 10 years | 46 (1.9) | 3 (0.2) | 43 (3.7) | |
| 10–20 years | 18 (0.7) | 3 (0.2) | 15 (1.3) | |
| 20 years or more | 191 (7.9) | 1 (0.01) | 190 (16.1) | <0.001 |
| Pack yearsaexposed | ||||
| Never used | 2169 (89.5) | 1243(99.4) | 926 (78.9) | |
| Less than 3 | 68 (2.8) | 5 (0.4) | 63 (5.4) | |
| 3.1–10 | 64 (2.6) | 2 (0.2) | 62 (5.3) | |
| 10.1–30 | 65 (2.7) | 0 (0.0) | 65 (5.5) | |
| 30.1 or more | 58 (2.4) | 0 (0.0) | 58 (4.9) | <0.001 |
| Oral tobacco use duration | ||||
| Never used | 1191 (49.2) | 713 (57.0) | 478 (40.7) | |
| Less than 10 years | 101 (4.2) | 48 (3.8) | 53 (4.6) | |
| 10–20 years | 141 (5.8) | 69 (5.6) | 72 (6.1) | |
| 20 years or more | 991 (40.8) | 420 (33.6) | 571 (48.6) | <0.001 |
| Alcohol useb | ||||
| No | 2131 (88.5) | 1231 (99.0) | 900 (77.2) | |
| Yes | 278 (11.5) | 12 (1.0) | 266 (22.8) | <0.001 |
* Indicated mean (SD).
A product of average packs of beedis or cigarettes consumed per day (pack size 20) and years of exposure. All values above indicate number (percentage of total) except where indicated.
Alcohol use defined as self-reported current consumption of at least one drink in a month.
Of the 2405 elderly in whom blood pressure measurements were obtained, 1115 (46.3% (95% CI 44.3–48.4)) had hypertension. Of these 247 (10.2%) knew that their blood pressure was high, and remaining 868 (36.1%) were detected during the study [Fig. 2]. Of the people detected to have incident hypertension, 458 (52.7% (95% CI 49.3–56.1)) had isolated systolic hypertension (ISH) and 410 (47.2% (95% CI 43.8%–50.6%) had systolic and diastolic hypertension. As compared to men, more women had prevalent-uncontrolled and incident hypertension [Table 2].
Fig. 2.
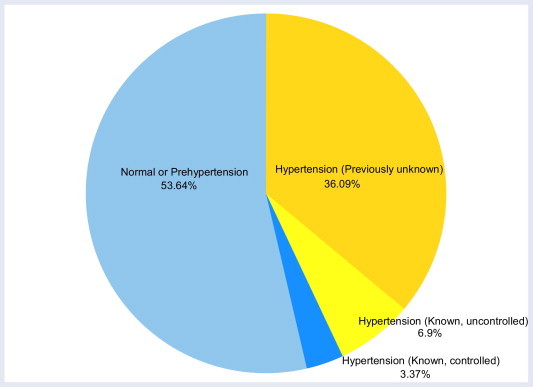
Proportion of hypertension (stage 1 and 2) among individuals (age 60 years or more) in rural communities around Sevagram (n = 2405).
Table 2.
Prevalence of CVD and its risk factors in study population (n = 2424).
| Variable | All | Women | Men | P-value |
|---|---|---|---|---|
| Total number | 2424 | 1250 | 1174 | |
| Known disease history (n) | ||||
| Hypertension | 247 (10.2) | 129 (10.4) | 118 (10.0) | 0.77 |
| Uncontrolled (>140/90) | 166 (6.9) | 99 (8.0) | 67 (5.7) | <0.001 |
| Controlled (<140/90) | 81 (3.3) | 30 (2.4) | 51 (4.3) | |
| Diabetes | 47 (1.9) | 17 (1.3) | 30 (2.5) | 0.03 |
| Previously not known hypertension | 2158 (89.8) | 1108 (89.6) | 1050 (89.9) | |
| Normal or pre-hypertension | 1290 (53.6) | 615 (49.7) | 675 (57.8) | <0.001 |
| Normal (BP < 120/80) | 564 | 242 | 322 | |
| Pre-hypertension (<140/90) | 726 | 373 | 353 | |
| Newly detected hypertension | 868 (36.2) | 493 (39.8) | 375 (32.1) | |
| Stage 1 | 500 | 272 | 228 | <0.001 |
| Stage 2 | 368 | 221 | 147 | |
| Isolated systolic hypertension | 458 | 268 | 190 | |
| Average blood pressure values among individuals with hypertensiona | ||||
| Previously known hypertension (n = 247; 129 women, 118 men) | ||||
| Systolic blood pressure | 150.9 (27.5) | 154.6 (26.9) | 146.8 (27.6) | 0.02 |
| Diastolic blood pressure | 86.2 (13.5) | 87.4 (12.6) | 85.0 (14.4) | 0.16 |
| Newly detected hypertension (n = 868; 493 women, 375 men) | ||||
| Systolic blood pressure | 159.7 (18.8) | 160.9 (18.8) | 158.1 (18.7) | 0.02 |
| Diastolic blood pressure | 89.3 (11.5) | 88.6 (11.2) | 90.1 (11.8) | 0.05 |
| Newly detected isolated systolic hypertension (n = 458; 268; women, 190 men) | ||||
| Systolic blood pressure | 155.3 (14.3) | 156.2 (14.6) | 153.9 (13.8) | 0.09 |
| Diastolic blood pressure | 80.9 (6.7) | 80.6 (6.7) | 81.2 (6.8) | 0.31 |
| Newly detected systolic and diastolic hypertension (n = 410; 225 women, 185 men) | ||||
| Systolic blood pressure | 164.6 (21.8) | 166.4 (21.6) | 162.3 (21.9) | 0.05 |
| Diastolic blood pressure | 98.7 (7.8) | 98.2 (7.3) | 99.3 (8.3) | 0.18 |
| Waist circumference (n) | 2310 | 1189 | 1121 | |
| More than 90 cm | 69 (2.9) | 22 (1.8) | 47 (4.2) | |
| 85–90 cm | 109 (4.7) | 25 (2.1) | 84 (7.5) | <0.001 |
| Less than 85 cm | 2132 (92.3) | 1142 (96.0) | 990 (88.3) | |
| Body mass index (n) | 1972 | 1015 | 957 | |
| Less than 18.5 | 748 (37.9) | 421 (41.5) | 327 (34.2) | |
| 18.5 to 24.9 | 1062 (53.9) | 512 (50.4) | 550 (57.5) | 0.04 |
| 25 to 29.9 | 138 (7.0) | 73 (7.2) | 65 (6.8) | |
| More than 30 | 24 (1.2) | 9 (0.9) | 15 (1.5) | |
| Cardiovascular risk factorsb(n) | 1944 | 996 | 948 | |
| None | 402 (20.7) | 263 (26.4) | 139 (14.6) | |
| One | 886 (45.5) | 426 (42.7) | 460 (48.5) | |
| Two | 494 (25.4) | 244 (24.5) | 250 (26.4) | <0.001 |
| Three or more | 162 (8.2) | 63 (6.3) | 99 (10.3) | |
All average blood pressure values are in mean (SD), remaining values are numbers (percentage of total).
Risk factors include history of tobacco use, diabetes mellitus, known hypertension or systolic BP > 140 or diastolic BP > 90 recorded during survey, abnormal waist circumference (more than 85 cm in women or 90 cm in men), body mass index of ≥25 kg/m2.
Only 8.2% (95% CI 7.0–9.5) of all participants had a BMI of 25 kg/m2or greater, and 4.1% (95% CI 3.3–4.9) had high waist circumferences. Of the five risk factors considered (smoking or tobacco use, hypertension (known or newly detected), diabetes, abnormal waist circumference, and high BMI), two or more risk factors were seen in 656 (33.7%) of all individuals, a proportion which was significantly more in men as compared to women [Table 2].
Of 529 elderly who participated in step 2 of the study, 226 (42.7%) had no or one risk factor (low-risk elderly), and 303 (57.3%) had two or more risk factors (high risk elderly). Of these 40.6% (95% CI 36.5–44.9) had dyslipidemia, and 4.9% (95% CI 3.2–7.1) had hyperglycemia. Serum lipid and sugar levels were similar in low and high risk elderly. While a significantly high proportion of women had hypercholesterolemia and high LDL levels, low HDL level was more frequent in men. While the prevalence of diabetes was low (1.9% (95% CI 1.4–2.5), 22 of 26 individuals detected to have fasting hyperglycemia were previously unaware of their diabetes status. A total of 94 of 529 (17.7%) elderly had a low creatinine clearance, of less than 30 ml/min [Table 3].
Table 3.
Clinical chemistry of all individuals who underwent laboratory based tests (n = 529).
| Variable |
All |
None or one risk factor |
Two or more risk factors |
P-value |
|---|---|---|---|---|
| Total number | 529 | 226 | 303 | |
| Lipid profile | ||||
| Serum Cholesterol (mg/dl) | 179.7 (35.2) | 179.2 (35.4) | 180.1 (35.1) | 0.61 |
| Serum LDL (mg/dl) | 105.6 (29.0) | 106.2 (28.1) | 105.2 (29.7) | 0.70 |
| Serum Triglyceride (mg/dl) | 105.6 (50.5) | 100.5 (48.0) | 109.5 (52.1) | 0.04 |
| Serum HDL (mg/dl) | 52.9 (11.2) | 52.6 (11.5) | 53.1 (10.9) | 0.57 |
| Dyslipidemiaa | ||||
| High Cholesterol (<200 mg/dl) | 137 (25.9) | 59 (26.1) | 78 (25.6) | 0.92 |
| Low HDLb | 149 (28.1) | 82 (36.2) | 67 (22.1) | <0.001 |
| High triglycerides (>150 mg/dl) | 74 (13.9) | 23 (10.1) | 51 (16.8) | 0.02 |
| High LDL (>130 mg/dl) | 92 (17.4) | 36 (15.9) | 56 (18.4) | 0.44 |
| Any of the above | 215 (40.6) | 90 (39.8) | 125 (41.1) | 0.95 |
| Glycemic status | ||||
| Blood sugar (mg/dl) | 101.7 (23.2) | 100.7 (19.5) | 102.6 (26.) | 0.27 |
| Hyperglycemia (>126 mg/dl)a | 26 (5.9) | 6 (2.6) | 20 (6.6) | 0.07 |
| Renal function | ||||
| Mean Creatinine clearance | 41.3 (12.9) | 39.7 (11.1) | 42.5 (13.9) | 0.01 |
| Creatinine clearance categoriesa | ||||
| <15 ml/min | 7 (1.3) | 2 (0.96) | 5 (1.66) | |
| 15–29 ml/min | 87 (17.0) | 34 (16.3) | 53 (17.5) | 0.11 |
| 30–60 ml/min | 376 (73.7) | 163 (78.3) | 213 (70.5) | |
| >60 ml/min | 40 (7.8) | 9 (4.3) | 31 (10.2) | |
All values are in mean (SD), except where indicated.
These represent number (percentage of total).
Less than 40 mg/dl in men, and 50 mg/dl in women.
4. Discussion
Our study shows that a proportion of elderly individuals in rural India have risk factors for CVD. Six out of ten elderly were exposed to tobacco; four out of ten had hypertension; and one out of ten was overweight. Only one out of five elderly with hypertension knew about high blood pressure, and only a third of those who knew had optimum blood pressure control. Two out of five high risk elderly had dyslipidemia. Women had a higher prevalence of hypertension compared to men. In this population of elderly with a low burden of cardiovascular disease (3.3%), the prevalence of hypertension (46%) and diabetes (4.9%), is lower compared to with similar age-groups in the west (hypertension >65%, diabetes 18%).9
Unawareness about their high blood pressure status was an important finding in this study. Most participants never had blood pressure measurements in the past, and as expected had little or no symptoms related to their elevated blood pressures. Only about a third of those who knew themselves to be hypertensive had their blood pressures controlled. Given a high prevalence of hypertension, we need to incorporate population level screening and management strategies, even in rural areas.
Three recent studies have estimated the prevalence of CVD risk factors in rural India. Amulti-centric cross-sectional study in about 2000 rural-siblings (age 20–69 years) of urban industrial workers10 has reported that40% for men were exposed to tobacco, 28% women had central obesity and 20% men and women had hypertension. These estimates are lower than those reported in two studies from rural Andhra Pradesh.4,11 Another multi-centric study among industrial worker families,12 (age 20–69 years) also reported that40% of all participants were exposed to tobacco and about 30%had central obesity. The prevalence of known hypertension in this study was similar to that in our study (10%), while that of incident hypertension was lower (30%). A cross-sectional study among adults (age 30 years or more)13 reports similar prevalence of hypertension in urban affluent (39%), urban slum (35%), as well in a rural community (33%). Although these studies have much younger populations, there may be some merit in comparing our study with them. Since elderly have higher blood pressures than young,5 a higher prevalence of hypertension is expected. Also, elderly are more likely to have had isolated systolic hypertension (ISH),5 a finding seen in about half of all our hypertensive elderly. If we discount ISH, the prevalence of hypertension in our study is comparable to that reported from studies on younger participants.
In our study, about two-thirds of all elderly had used some form of tobacco in their life; many had used it for longer than 20 years. Use of smokeless tobacco is more common among elderly, and in rural and economically disadvantaged communities.14,15 While the association of cigarette smoking and cardiovascular disorders is well known, smokeless tobacco is also a significant risk factor for all-cause mortality,16 and hypertension.17 About 10% of all elders, all males smoked Bidi (tobacco hand-rolled in dried leaves, an indigenous form of cigarette). Again, there are strong reasons to believe that this form of smoking has risks similar to that of cigarettes.18 Very few individuals in our study were overweight, or had central obesity. Our estimates are much lower as compared to recent estimates of about 25% in younger population in rural India.10 The estimates for dyslipidemia (about 35%) are more comparable to ours (40%).
We found that men and women differed as regards risk factors for CVD. Most men either smoked or used smokeless tobacco compared to women. By contrast, more women had high blood pressure compared to men. Use of tobacco, in any form is not culturally acceptable in our area which might explain why we found lower tobacco use by women. It is known that men and women have differential responses to elevated blood pressures. Post-menopausal women are more likely to develop left ventricular hypertrophy,19 and elderly men are more prone to develop coronary artery disease and hence reduced ejection fractions.20 Further social inequality leading to differential health-care-access is more likely to adversely impact women. Previous studies have also shown that women are less likely to achieve optimum blood pressure control.21,22 In our study men had lower HDL levels, a finding typical from studies in South Asian population which show a consistent high-tobacco, and low HDL pattern.23 Proportion of women with low HDL was small, probably related to fewer tobacco–lipid interactions.
Our study is the largest community-based study on cardiovascular risk factors among elderly people in rural India. The strengths of this study include an unbiased sampling strategy, standardized pilot tested risk-assessment methods, and a single accredited laboratory for the measurement of lipid levels. Our study has certain limitations. First, our study population belongs to a single geographic region in central India; hence the results from our study cannot be generalized to rural populations dissimilar to ours. Second, our study is cross-sectional, and we cannot directly attribute prevalent cardiovascular risk factors to subsequent occurrence of cardiovascular disease. Third, we did not measure physical activity, dietary, and psychological stress related risk factors. Fourth, blood sugars and lipid levels were measured in a sub-sample of individuals at high CVD risk and a smaller proportion of low-risk individuals who had volunteered blood tests; hence the prevalence of hyperglycemia or dyslipidemia in this study is likely to be an overestimate, and cannot be extended to entire study population. Last, logistics prevented us from using digital weight machines and stadiometers, hence there are likely accuracies issues in measurement of BMI, however we believe this to be minimal.
It is important to know distribution of CVD risk factors, so that appropriate strategies for their reduction can be designed. Such appropriate strategies can help to reduce the adverse impact of cardiovascular risk factors in a community. In the current study, tobacco use and hypertension stand out as large contributors to the burden. Tobacco use is fairly common in many communities in India, and is often a social norm.24 Despite challenges involved in tobacco cessation for the elderly, no age needs to be exempt.25 On the contrary messages targeted at elderly may have a spin-off in terms of making this practice less acceptable in the society. Blood-pressure is more amenable to control, largely by using drug therapies. There is a need for sustained provider level education, that elderly are not any different from young. Control of blood pressure among elderly has been shown to be safe and beneficial,26,27 and various guidelines have reaffirmed that except for frail elderly, and all must achieve optimum control.28–30 While innovative hypertension treatment programs for rural elderly have been initiated in middle income countries such as China31 and Korea,32 there is a need for such an initiative in India.
To conclude, the prevalence of cardiovascular risk factors among elderly in rural India is high, is comparable to other recent estimates, and explainable by known risk-factor mechanisms. Similar estimates from elderly population from other geographic regions are needed to firm up these findings. Nonetheless it is imperative to design and implement strategies for CVD risk-reduction among elderly even in rural India, with a focus on hypertension and tobacco use.
Funding source
Internal research funds in the Department of Medicine were used for this study.
Conflicts of interest
None. The authors declare that they had no financial or personal relations to other parties whose interests could have affected the content of this article in any way, either positively or negatively.
Acknowledgments
We thank Mr. Santosh Chavhan BSW, Mr. Kiran Munjewar BA, Mr. Vinod Kulkarni MSW, Mr. Prashant Raut BA, and Mr. Nitin Jinde MSW, for coordinating data collection and data entry for this study.
References
- 1.Registrar General of India and Million Death Study Investigators . Registrar General of India; New Delhi: 2009. Final Report on Causes of Death in India 2001–2003. [Google Scholar]
- 2.Gupta R., Joshi P., Mohan V., Reddy K.S., Yusuf S. Epidemiology and causation of coronary heart disease and stroke in India. Heart. 2008;94:16–26. doi: 10.1136/hrt.2007.132951. [DOI] [PubMed] [Google Scholar]
- 3.Joshi P., Islam S., Pais P. Risk factors for early myocardial infarction in South Asians compared with individuals in other countries. JAMA. 2007;297:286–294. doi: 10.1001/jama.297.3.286. [DOI] [PubMed] [Google Scholar]
- 4.Chow C., Cardona M., Raju P.K. Cardiovascular disease and risk factors among 345 adults in rural India-the Andhra Pradesh Rural Health Initiative. Int J Cardiol. 2007;116:180–185. doi: 10.1016/j.ijcard.2006.03.043. [DOI] [PubMed] [Google Scholar]
- 5.Casiglia E., Palatini P. Cardiovascular risk factors in the elderly. J Hum Hypertens. 1998;12:575–581. doi: 10.1038/sj.jhh.1000668. [DOI] [PubMed] [Google Scholar]
- 6.Jajoo U.N., Kalantri S.P., Gupta O.P., Jain A.P., Gupta K. The prevalence of hypertension in rural population around Sevagram. J Assoc Physicians India. 1993;41:422–424. [PubMed] [Google Scholar]
- 7.Jajoo U.N., Kalantri S.P., Gupta O.P., Jain A.P., Gupta K. The prevalence of coronary heart disease in rural population from central India. J Assoc Physicians India. 1988;36:689–693. [PubMed] [Google Scholar]
- 8.Cockcroft D.W., Gault M.H. Prediction of creatinine clearance from serum creatinine. Nephron. 1976;16:31–41. doi: 10.1159/000180580. [DOI] [PubMed] [Google Scholar]
- 9.Lloyd-Jones D.M., Evans J.C., Levy D. Hypertension in adults across the age spectrum: current outcomes and control in the community. JAMA. 2005;294:466–472. doi: 10.1001/jama.294.4.466. [DOI] [PubMed] [Google Scholar]
- 10.Kinra S., Bowen L.J., Lyngdoh T. Sociodemographic patterning of non-communicable disease risk factors in rural India: a cross sectional study. BMJ. 2012;341:c4974. doi: 10.1136/bmj.c4974. [DOI] [PMC free article] [PubMed] [Google Scholar]
- 11.Chow C.K., Naidu S., Raju K. Significant lipid, adiposity and metabolic abnormalities amongst 4535 Indians from a developing region of rural Andhra Pradesh. Atherosclerosis. 2008;196:943–952. doi: 10.1016/j.atherosclerosis.2007.02.027. [DOI] [PubMed] [Google Scholar]
- 12.Reddy K.S., Prabhakaran D., Chaturvedi V. Methods for establishing a surveillance system for cardiovascular diseases in Indian industrial populations. Bull World Health Organ. 2006;84:461–469. doi: 10.2471/blt.05.027037. [DOI] [PMC free article] [PubMed] [Google Scholar]
- 13.Kar S.S., Thakur J.S., Virdi N.K., Jain S., Kumar R. Risk factors for cardiovascular diseases: is the social gradient reversing in northern India? Natl Med J India. 2010;23:206–209. [PubMed] [Google Scholar]
- 14.Daniel A.B., Nagaraj K., Kamath R. Prevalence and determinants of tobacco use in a highly literate rural community in southern India. Natl Med J India. 2008;21:163–165. [PubMed] [Google Scholar]
- 15.Subramanian S.V., Nandy S., Kelly M., Gordon D., Davey Smith G. Patterns and distribution of tobacco consumption in India: cross sectional multilevel evidence from the 1998–9 national family health survey. BMJ. 2004;328:801–806. doi: 10.1136/bmj.328.7443.801. [DOI] [PMC free article] [PubMed] [Google Scholar]
- 16.Ramadas K., Sauvaget C., Thomas G., Fayette J.M., Thara S., Sankaranarayanan R. Effect of tobacco chewing, tobacco smoking and alcohol on all-cause and cancer mortality: a cohort study from Trivandrum, India. Cancer Epidemiol. 2010;34:405–412. doi: 10.1016/j.canep.2010.04.006. [DOI] [PubMed] [Google Scholar]
- 17.Pandey A., Patni N., Sarangi S. Association of exclusive smokeless tobacco consumption with hypertension in an adult male rural population of India. Tob Induc Dis. 2009;5:15. doi: 10.1186/1617-9625-5-15. [DOI] [PMC free article] [PubMed] [Google Scholar]
- 18.Patel V., Chatterji S., Chisholm D. Chronic diseases and injuries in India. Lancet. 2011;377:413–428. doi: 10.1016/S0140-6736(10)61188-9. [DOI] [PubMed] [Google Scholar]
- 19.Hayward C.S., Kelly R.P., Collins P. The roles of gender, the menopause and hormone replacement on cardiovascular function. Cardiovasc Res. 2000;46:28–49. doi: 10.1016/s0008-6363(00)00005-5. [DOI] [PubMed] [Google Scholar]
- 20.Koster N.K., Reddy Y.M., Schima S.M., Almeida N.J. Gender-specific echocardiographic findings in nonagenarians with cardiovascular disease. Am J Cardiol. 2010;105:273–276. doi: 10.1016/j.amjcard.2009.08.678. [DOI] [PubMed] [Google Scholar]
- 21.Keyhani S., Scobie J.V., Hebert P.L., McLaughlin M.A. Gender disparities in blood pressure control and cardiovascular care in a national sample of ambulatory care visits. Hypertension. 2008;51:1149–1155. doi: 10.1161/HYPERTENSIONAHA.107.107342. [DOI] [PubMed] [Google Scholar]
- 22.Bird C.E., Fremont A.M., Bierman A.S. Does quality of care for cardiovascular disease and diabetes differ by gender for enrollees in managed care plans? Womens Health Issues. 2007;17:131–138. doi: 10.1016/j.whi.2007.03.001. [DOI] [PubMed] [Google Scholar]
- 23.Ranjith N., Verho N.K., Verho M., Winkelmann B.R. Acute myocardial infarction in a young South African Indian-based population: patient characteristics on admission and gender-specific risk factor prevalence. Curr Med Res Opin. 2002;18:242–248. doi: 10.1185/030079902125000624. [DOI] [PubMed] [Google Scholar]
- 24.Ansari Z.A., Bano S.N., Zulkifle M. Prevalence of tobacco use among power loom workers - a cross-sectional study. Indian J Community Med. 2010;35:34–39. doi: 10.4103/0970-0218.62551. [DOI] [PMC free article] [PubMed] [Google Scholar]
- 25.Madruga C.S., Ferri C.P., Pinsky I., Blay S.L., Caetano R., Laranjeira R. Tobacco use among the elderly: the first Brazilian National Survey (BNAS) Aging Ment Health. 2010;14:720–724. doi: 10.1080/13607860903586177. [DOI] [PubMed] [Google Scholar]
- 26.Del Giudice A., Pompa G., Aucella F. Hypertension in the elderly. J Nephrol. 2010;23(suppl 15):S61–S71. [PubMed] [Google Scholar]
- 27.Ogihara T., Saruta T., Rakugi H. Target blood pressure for treatment of isolated systolic hypertension in the elderly: valsartan in elderly isolated systolic hypertension study. Hypertension. 2010;56:196–202. doi: 10.1161/HYPERTENSIONAHA.109.146035. [DOI] [PubMed] [Google Scholar]
- 28.Kithas P.A., Supiano M.A. Practical recommendations for treatment of hypertension in older patients. Vasc Health Risk Manag. 2010;6:561–569. doi: 10.2147/vhrm.s5245. [DOI] [PMC free article] [PubMed] [Google Scholar]
- 29.Hackam D.G., Khan N.A., Hemmelgarn B.R. The 2010 Canadian hypertension education program recommendations for the management of hypertension: part 2-therapy. Can J Cardiol. 2010;26:249–258. doi: 10.1016/s0828-282x(10)70379-2. [DOI] [PMC free article] [PubMed] [Google Scholar]
- 30.Gasowski J., Tikhonoff V., Stolarz-Skrzypek K. Treatment of hypertension in the elderly in 2010 – a brief review. Expert Opin Pharmacother. 2010;11:2609–2617. doi: 10.1517/14656566.2010.486791. [DOI] [PubMed] [Google Scholar]
- 31.Li H., Liu L.T., Zhao W.M. Traditional Chinese versus integrative treatment in elderly patients with isolated systolic hypertension: a multicenter, randomized, double-blind controlled trial. Zhong Xi Yi Jie He Xue Bao. 2010;8:410–416. doi: 10.3736/jcim20100503. [DOI] [PubMed] [Google Scholar]
- 32.Lee H.S., Park Y.M., Kwon H.S. Factors associated with control of blood pressure among elderly people diagnosed with hypertension in a rural area of South Korea: the Chungju Metabolic Disease Cohort Study (CMC study) Blood Press. 2010;19:31–39. doi: 10.3109/08037050903424117. [DOI] [PubMed] [Google Scholar]