

Abstract
Short-sleep and long-sleep duration are associated with prevalent hypertension, poor cardiovascular health, and mortality. The relation of sleep hours with increased left ventricular (LV) mass, a strong correlate of elevated blood pressure (BP) values, is not established. We conducted a cross-sectional analysis among the participants of the population-based Cardiovascular Abnormalities and Brain Lesions study. LV mass was estimated by transthoracic echocardiography. Sleep duration was assessed by reported hours of sleep on a diary kept during 24-hour BP monitoring. Multivariate linear regression models were constructed to assess the relation between sleep hours and LV mass index (LV mass divided by body surface area). Analysis of sleep hour categories (short and long sleep) was performed. Among 756 participants (mean age 71 ± 9 years, 60% women, and 71% Hispanics), the mean sleep duration was 8.6 ± 1.8 hours, and LV mass index was 103 ± 26 g/m2. A J-shaped relation between sleep hours squared and LV mass index was observed adjusting for demographics and cardiovascular risk factors. Categorical analysis showed an association between long-sleep duration (>11 hours) and LV mass index (β = 7.4; p = 0.013). Long sleepers had higher diurnal systolic BP (p = 0.012) and nocturnal systolic BP (p <0.001) compared with the reference group. A great part of the variance between sleep duration and LV mass was explained by 24-hour systolic BP (β = 0.45; p <0.0001). In conclusion, self-reported long-sleep duration was associated with increased LV mass. Higher systolic BP, especially nocturnal, may account for part of the observed association.
Increased left ventricular (LV) mass, usually measured with transthoracic echocardiography, is associated with stroke and increased mortality.1–3 Reduction of LV mass in patients with hypertension and LV hypertrophy has been shown to decrease cardiovascular morbidity.4,5 The relation of sleep hours with LV mass, a strong correlate of elevated blood pressure (BP) values, is not established. The aim of our study was to evaluate the relation between sleep hours and LV mass in a multiethnic elderly cohort and to assess the effect of BP values on this relation.
Methods
The population of this study was derived from the Cardiovascular Abnormalities and Brain Lesion (CABL) study, an ancillary study to the Northern Manhattan Study (NOMAS). The NOMAS cohort of 3,298 stroke-free participants was randomly sampled from the northern Manhattan population as previously described.6 Subjects from the NOMAS who were >50 years old, were willing to participate, and had no contraindications underwent a brain magnetic resonance imaging study and an extensive transthoracic echocardiography evaluation as part of CABL.7 For the purpose of this analysis, we included participants with simultaneous measures of self-reported sleep hours (obtained from a diary kept during 24-hour BP monitoring) and LV mass. A total of 1,004 participants were enrolled in CABL; 169 of them refused BP monitoring or could not complete it. Of the remaining 835, 75 were excluded because of incomplete information on sleep hours or echocardiographic measures and 4 were excluded because of at least moderate valvular lesions on echocardiogram. The remaining 756 participants constitute the present study population. Both CABL and NOMAS were approved by the Columbia University Medical Center Institutional Board Review and the University of Miami Institutional Board Review. All participants gave written informed consent.
Data were collected through interviews by trained bilingual (English and Spanish) research assistants using standardized data collection instruments.6 Race and ethnicity were defined by self-identification according to questions modeled after the United States census and categorized into mutually exclusive groups (Black, White, and Hispanic). Educational level was used as an indicator of socioeconomic status (SES) and classified into 2 categories: “less than high school” and “completed high school.”6 Obesity was defined by a body mass index of ≥30 kg/m2. Hypertension was defined as a systolic BP of >140 mm Hg or a diastolic BP of >90 mm Hg (average of 2 measurements obtained in sitting position) or use of antihypertensive medications.Diabetes mellitus was defined as fasting blood glucose of ≥126 mg/dl, the patient’s self-report of diabetes, use of insulin, or hypoglycemic medications. Cigarette smoking was defined by history (ever or never). Hypercholesterolemia was defined as the total serum cholesterol of >240 mg/dl, a subject self-report of hypercholesterolemia, or use of lipid-lowering medications. Renal disease was defined as a creatinine of >1.5 mg/dl. Cardiac disease included angina pectoris, myocardial infarction, coronary artery disease, atrial fibrillation, or heart failure. Depressive symptoms were evaluated with the Center for Epidemiological Studies Depression scale, a 20-item scale assessing depressive affect, somatic complaints, positive affect, and interpersonal relations. The Center for Epidemiological Studies Depression scale scores range from 0 to 60, with greater scores indicating symptoms of depression. Depressive symptoms were considered present if the sum of the Center for Epidemiological Studies Depression scale scores was ≥16.8
Sleep hours were determined using subject-entered diary reports of sleep and wake times during the 24-hour ambulatory BP monitoring, conducted as the participants performed their normal activities. Transthoracic echocardiography was performed using a commercially available system (iE 33, Philips, Andover, Massachusetts) by a trained, registered cardiac sonographer according to a standardized protocol.7 Measurements were taken from standard 2-dimensional images according to the guidelines of the American Society of Echocardiography. LV mass was calculated with the use of the corrected American Society of Echocardiography method: 0.8 × (1.04 × [(VS + LV diastolic dimension + PWT)3–(LV diastolic dimension)3] + 0.6) 0.8.LV mass was then indexed by body surface area.7,9
Ambulatory BP monitoring was performed with a commercially available BP monitor (SpaceLabs 90207, Williams Medical Supplies Ltd., Rhymney, South Wales, United Kingdom), calibrated against a reference mercury sphygmomanometer. Participants were asked to keep their usual daily activities during monitoring and to note them on a diary together with the waking and the sleeping time. Ambulatory BP monitoring was performed with a BP cuff appropriately sized to arm circumference on the nondominant arm. BP was recorded automatically every 15 minutes during awake hours and every 30 minutes during sleeping hours for a total of 24 hours.10 The variables obtained were (1) Nighttime systolic BP and diastolic BP (average of sleeping measurements), (2) daytime systolic BP and diastolic BP (average of awake measurements), and (3) nondipping status (failure of BP values to decrease by ≥10% during sleep).
Data are presented as mean ± SD for continuous variables and as proportions for categorical variables. The chi-square test was used to compare proportions. Analysis of variance was performed to test mean differences between groups. Univariate and multivariate linear regression were used to analyze the association between sleep hours and indexed LV mass. The variables included in the models either had a univariate association to LV mass or are known predictors of increased LV mass.1,2 The models were sequentially adjusted for age at echocardiography, gender, race-ethnicity, and education (model 1), and vascular risk factors such as hypertension, diabetes, hypercholesterolemia, waist circumference, body mass index, and renal and cardiac disease (model 2). To evaluate the effect of BP values on the relation between sleep hours and LV mass, we further adjusted for mean 24-hour systolic BP (model 3) and for mean 24-hour diastolic BP (model 4). After analysis of sleep hours as a continuous variable, a quadratic term for sleep hours was included for each of the above models to evaluate the possibility of a nonlinear relation between reported sleep hours and LV mass index. We then categorized sleep hours into 3 prespecified groups (short, long, and reference), which have been associated with increased cardiovascular disease and mortality.11–13 Short sleep was defined as <6 hours and long sleep as ≥11 hours, whereas 6 to 10:59 hours was the reference to evaluate the extremes of the U-shaped distribution in our sample. We compared LV mass amongst these 3 sleep duration categories. We also performed a sensitivity analysis and divided the reference group into 2 smaller categories of 6 to 8:29 hours and 8:30 to 10:59 hours and compared them with <6 hours for the prediction of indexed LV mass. We observed similar relations of these categories, 6 to 8:29 hours (p = 0.002) and 8:30 to 10:59 hours (p = 0.003) with indexed LV mass and therefore used the broader category (6 to 10:59 hours) in all subsequent analyses. Secondary analysis to further explore the relation between sleep hours and LV mass was done by including interaction terms for age, gender, race-ethnicity, and cardiovascular risk factors in the multivariate models predicting LV mass. The 95% confidence interval of smoothed spline was obtained by the method of percentile bootstrap confidence interval using 1,000 bootstrap samples in R. All analyses were carried out using SAS software version 9.2 (SAS Institute Inc., Cary, North Carolina).
Results
Of 756 participants (mean age 71 ± 9 years, 60% women, and 71% Hispanics), most had hypertension (71%) and hypercholesterolemia (63%). The mean sleep duration was 8.6 ± 1.8 hours and mean indexed LV mass was 103 ± 26 g/m2 (Table 1).
Table 1.
Baseline demographics, cardiovascular risk factors, sleep hours, and left ventricular mass (indexed by body surface area) in the study cohort
| Characteristics | n = 756 |
|---|---|
| Age (yrs) | 71 ± 9 |
| Women (%) | 454 (60) |
| Black (%) | 119 (16) |
| Hispanic (%) | 538 (71) |
| White (%) | 99 (13) |
| High school education (%) | 337 (45) |
| Waist circumference (cm) | 38 ± 5 |
| Hypertension (%) | 532 (70) |
| Diabetes mellitus (%) | 218 (29) |
| Cigarette smoker (ever, %) | 405 (54) |
| Hypercholesterolemia (%) | 472 (63) |
| Depressive symptoms (%) | 116 (16) |
| Sleep hours | 8.6 ± 1.8 |
| LV mass (index, g/m2) | 103 ± 25 |
The covariates that were associated with LV mass index were age (β = 0.46; p <0.0001), male gender (β = 5.8; p = 0.0022), waist circumference (β = 0.4; p <0.05), hypertension (β = 12.2; p <0.0001), and diabetes (β = 5.21; p = 0.0109), whereas depressive symptoms, alcohol consumption, body mass index, and cigarette smoking were not. Subjects who had education greater than high school (β = −4.3; p <0.0001) had significantly less LV mass index. There was no significant race-ethnic difference in LV mass index (data not shown).
Table 2 lists the distribution of demographics, risk factors, and mean BP values across categories of sleep duration. Eleven percent of the cohort reported ≥11 hours, whereas 6 percent reported <6 hours of sleep. There was a greater frequency of Hispanics, subjects with lower than high school education, and hypertensive subjects among long sleepers. There was no difference in the frequency of diabetes, obesity, and waist circumference among the sleep duration groups. Long sleepers (≥11 hours) had higher mean systolic BP during the day, with an even more pronounced difference at night than the reference group. In addition, long sleepers had an increased frequency of nocturnal “nondipping” of BP compared with the reference. There were no differences in diastolic BP between long sleepers and the reference. In addition, long sleepers had greater mean LV mass index.
Table 2.
Demographics, risk factors, and BP values across categories of sleep hours Variable Sleep Hours
| Variable | Sleep Hours
|
||
|---|---|---|---|
| <6 48 (6%) |
6 to 10:59 628 (83%) |
≥11 80 (11%) |
|
| Women | 25 (6) | 380 (84) | 49 (10) |
| White | 11 (11) | 82 (81) | 7 (7) |
| Black | 12 (10) | 100 (84) | 7 (6) |
| Hispanic* | 25 (5) | 450 (83) | 66 (12) |
| Less than high school* | 18 (4) | 341 (82) | 59 (14) |
| Hypertension† | 41 (8) | 431 (81) | 60 (11) |
| Diabetes | 12 (6) | 177 (81) | 29 (13) |
| Hypercholesterolemia† | 27 (6) | 384 (81) | 61 (13) |
| Ever smoker† | 32 (8) | 339 (84) | 34 (8) |
| Waist (cm) | 38 ± 4 | 38 ± 5 | 38 ± 5 |
| Obesity (BMI ≥30 kg/m2) | 13 (6) | 192 (81) | 31 (13) |
| Serum creatinine >1.5 mg/dl† | 5 (23) | 15 (68) | 2 (9) |
| Daytime systolic BP† | 130 ± 13 | 128 ± 14 | 132 ± 16 |
| Nighttime systolic BP* | 121 ± 16 | 118 ± 16 | 124 ± 17 |
| Daytime diastolic BP | 77 ± 9 | 74 ± 9 | 74 ± 10 |
| Nighttime diastolic BP | 68 ± 11 | 66 ± 9 | 68 ± 9 |
| 24-mean systolic BP | 128 ± 13 | 124 ± 14 | 128 ± 15 |
| 24-mean diastolic BP | 75 ± 9 | 71 ± 8 | 71 ± 9 |
| BP nondipping status†,‡ | 30 (6) | 383 (81) | 58 (12) |
| LV mass index (g/m2)* | 110 ± 26 | 102 ± 27 | 111 ± 28 |
Data are expressed as mean ± SD or as n (%).
BMI = body mass index.
p <0.001.
p <0.05.
Less than 10% decrease in nighttime versus daytime BP.
In univariate analysis, sleep hours as a continuous variable did not show a linear relation with LV mass index, but a nonlinear J-shaped relation was found between sleep hours squared and LV mass index (β = 0.7; p = 0.002), (Figure 1). Table 3 lists multivariate models adjusted for demographics (model 1) and cardiovascular risk factors (model 2). Categorical analysis showed that short-sleep duration (<6 hours) was associated with LV mass index after adjusting for demographic factors. This association did not persist in models adjusted for cardiovascular risk factors. A positive association between reported long-sleep duration and LV mass index was seen in the model adjusted for demographics and cardiovascular risk factors. When continuous 24-hour mean systolic BP was included in the analysis (model 3), no significant association was seen between sleep hours and LV mass index, with the majority of the variance of LV mass explained by 24-hour mean systolic BP (β = 0.45; p <0.0001). In model 4, the 24-hour mean diastolic BP attenuated but did not eliminate the overall association between sleep hours and LV mass index. Secondary analysis showed an interaction between hypertension and sleep hours squared (β = 0.99; p = 0.044) on LV mass index. We further explored the relation between morning systolic and diastolic BP surges and sleep hours, but did not observe an association between these measures. There was no interaction between sleep hours squared and age, gender, or cardiovascular risk factors (data not shown).
Figure 1.
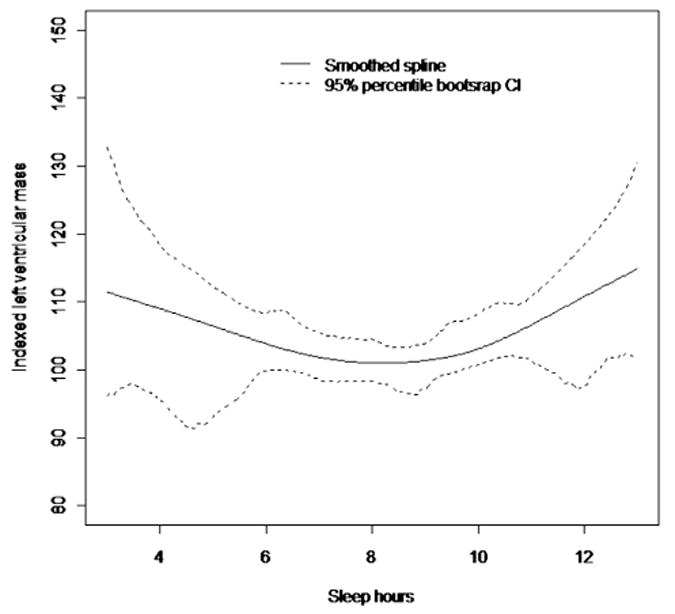
Cubic smoothing spline with smoothing parameter 1 showing the relation between sleep hours and LV mass. CI = confidence interval.
Table 3.
Relation between sleep hours and LV mass index
| Sleep Hours | Model 1
|
Model 2
|
Model 3
|
Model 4
|
||||
|---|---|---|---|---|---|---|---|---|
| β (SE) | p | β (SE) | p | β (SE) | p | β (SE) | p | |
| Squared Categorical | 0.6 (0.2) | 0.008 | 0.4 (0.2) | 0.057 | 0.3 (0.2) | 0.124 | 0.4 (0.2) | 0.085 |
| <6 h | 7.4 (3.8) | 0.05 | 4.7 (3.8) | 0.213 | 4.0 (3.7) | 0.289 | 3.7 (3.8) | 0.329 |
| ≥11 h | 7.9 (3.0) | 0.009 | 7.6 (2.8) | 0.009 | 5.9 (2.8) | 0.041 | 7.0 (2.9) | 0.016 |
| Reference | — | — | — | — | — | — | — | — |
Model 1: adjusted for age, gender, race-ethnicity, and education.
Model 2: model 1 and hypertension, diabetes, hypercholesterolemia, waist, BMI, renal disease, and cardiac disease.
Model 3: model 2 and 24-mean systolic BP.
Model 4: model 2 and 24-mean diastolic BP.
BMI = body mass index; SE = standard error.
Discussion
In the present study, we found a curvilinear J-shaped relation between sleep duration and LV mass, independent of demographics and cardiovascular risk factors. The most pronounced association was for those who reported ≥11 hours of sleep (long-sleep duration). We observed a significant interaction between long sleep and hypertension, suggesting their synergistic effect on LV mass. Long sleepers compared with average sleepers had increased 24-hour mean systolic BP, nocturnal systolic BP, and increased frequency of “nondipping.” Taken together, these findings suggest that a relation exists between long sleep and increased LV mass, which can be explained by the increased BP values of long sleepers. Various population-based studies support a relation between extremes of sleep duration and hypertension.14 Cross-sectional analyses of the population-based Sleep Heart Health Study15 and the National Health Interview Survey, 2007 to 200916 described an association between long sleep duration and prevalent hypertension, whereas other studies observed an association between sleep duration and hypertension in women but not in men.17 The few studies available have not observed an association between sleep duration and either incident or prevalent hypertension in the elderly (≥65 years).18,19 Most of these studies, similar to ours, estimated sleep duration by self-report; however, hypertension was defined by history or BP measurement at a single time point, while we were able to obtain information on the mean 24-hour systolic BP (and particularly nocturnal systolic BP) and frequency of “nondipping” of BP values during the night. In accordance to our study, the Japan Morning Surge Home Blood Pressure (J-Hop) study found that nighttime systolic BP, but not diastolic BP, correlated with increased LV mass measured by either home BP or ambulatory BP monitoring.20 Ambulatory BP is a better predictor of cardiovascular risk in the elderly than clinic or office BP measurement.4 It has been estimated that for each 10 mm Hg increase in nighttime systolic BP, cardiovascular death increased by 18%.21 In addition, nocturnal systolic BP is the strongest predictor of vascular events in diabetics,22 whereas “nondipping” of BP correlates with LV mass and predicts cardiovascular mortality, coronary heart disease, and stroke.23,24
The relation between long sleep duration and cardiovascular disease and mortality could be explained by confounders such as low SES, obesity, and diabetes, factors with a greater prevalence in minorties.25–27 Most studies on sleep hours and cardiovascular risk have examined homogenous populations, with a paucity of data from race or ethnically diverse cohorts. A greater frequency of long-sleep duration has been observed in Hispanics compared with non-Hispanic whites.26 In NOMAS, a greater proportion of Hispanics have <8 years of formal education and Medicaid or no insurance, both surrogate markers of lower SES. Lower SES is associated with a number of cardiovascular co-morbidities that could result in long-sleep duration and increased LV mass.25 However, adjustment for these factors did not modify the relation between long-sleep duration and LV mass in our study.
Our findings suggest that long-sleep duration and nocturnal BP may share a similar pathway toward increased LV mass. Sleep fragmentation, decreased slow wave sleep, and obstructive sleep apnea could lead to activation of neuroendocrine systems (corticotropic, sympathetic, and renin-aldosterone-angiotensin) which may cause increased nocturnal BP and/or not allow BP dipping.13,14 Short-sleep duration was associated with LV mass in our study, but this association was less pronounced after adjustment for vascular risk factors. Short-sleep duration has been associated with prevalent and incident hypertension, impaired insulin sensitivity, increased sympathetic tone, and elevated cortisol levels.15,28 Our results support the view that these vascular and metabolic factors may be on the causal pathway between short sleep duration and LV mass through mechanisms that seem to differ from those of the association between LV mass and long-sleep duration.
The strengths of our study include the evaluation of a large, multiethnic, community-based cohort and the use of reliable and systematically applied measures of cardiovascular risk and LV mass. Also, ambulatory BP was assessed in the entire sample, allowing correlations between sleep duration, nocturnal and diurnal BP values, and LV mass. However, our study is cross sectional, which prevents from drawing any causal inferences between sleep duration and increased LV mass. We did not have available objective measurements of sleep duration (i.e., actigraphy or polysomnography). However, epidemiologic association studies of long sleep and adverse health outcomes are mainly based on subjective reports from sleep questionnaires.12,25 Long-sleep duration might represent an increase in sleep time or just increased time in bed, which cannot be determined from our data; but increased mortality have been described in long sleepers across measures of time in bed and sleep duration29,30 Future efforts should include portable technology with objective measures of sleep duration and stages of sleep.
Acknowledgments
This work was supported by grants from the National Institute of Neurological Disorders and Stroke: supplement to R37 NS029993 (ARR); R37 NS029993 (RLS, MSVE, TR); K24 NS 062737 (TR); R01 NS 036286 (MRDT).
Footnotes
Disclosures
The authors have no conflicts of interest to disclose.
References
- 1.Di Tullio MR, Zwas DR, Sacco RL, Sciacca RR, Homma S. Left ventricular mass and geometry and the risk of ischemic stroke. Stroke. 2003;34:2380–2384. doi: 10.1161/01.STR.0000089680.77236.60. [DOI] [PMC free article] [PubMed] [Google Scholar]
- 2.Ghali JK, Liao Y, Simmons B, Castaner A, Cao G, Cooper RS. The prognostic role of left ventricular hypertrophy in patients with or without coronary artery disease. Ann Intern Med. 1992;117:831–836. doi: 10.7326/0003-4819-117-10-831. [DOI] [PubMed] [Google Scholar]
- 3.Koren MJ, Devereux RB, Casale PN, Savage DD, Laragh JH. Relation of left ventricular mass and geometry to morbidity and mortality in uncomplicated essential hypertension. Ann Intern Med. 1991;114:345–352. doi: 10.7326/0003-4819-114-5-345. [DOI] [PubMed] [Google Scholar]
- 4.Aronow WS, Fleg JL, Pepine CJ, Artinian NT, Bakris G, Brown AS, Ferdinand KC, Forciea MA, Frishman WH, Jaigobin C, Kostis JB, Mancia G, Oparil S, Ortiz E, Reisin E, Rich MW, Schocken DD, Weber MA, Wesley DJ, Harrington RA. ACCF/AHA 2011 expert consensus document on hypertension in the elderly: a report of the American College of Cardiology Foundation Task Force on Clinical Expert Consensus Documents. Circulation. 2011;123:2434–2506. doi: 10.1161/CIR.0b013e31821daaf6. [DOI] [PubMed] [Google Scholar]
- 5.Devereux RB, Wachtell K, Gerdts E, Boman K, Nieminen MS, Papademetriou V, Rokkedal J, Harris K, Aurup P, Dahlof B. Prognostic significance of left ventricular mass change during treatment of hypertension. JAMA. 2004;292:2350–2356. doi: 10.1001/jama.292.19.2350. [DOI] [PubMed] [Google Scholar]
- 6.Sacco RL, Boden-Albala B, Gan R, Chen X, Kargman DE, Shea S, Paik MC, Hauser WA. Stroke incidence among white, black, and Hispanic residents of an urban community: the Northern Manhattan Stroke Study. Am J Epidemiol. 1998;147:259–268. doi: 10.1093/oxfordjournals.aje.a009445. [DOI] [PubMed] [Google Scholar]
- 7.Russo C, Jin Z, Homma S, Rundek T, Elkind MS, Sacco RL, Di Tullio MR. Effect of obesity and overweight on left ventricular diastolic function: a community-based study in an elderly cohort. J Am Coll Cardiol. 2011;57:1368–1374. doi: 10.1016/j.jacc.2010.10.042. [DOI] [PMC free article] [PubMed] [Google Scholar]
- 8.Salaycik KJ, Kelly-Hayes M, Beiser A, Nguyen AH, Brady SM, Kase CS, Wolf PA. Depressive symptoms and risk of stroke: the Framing-ham Study. Stroke. 2007;38:16–21. doi: 10.1161/01.STR.0000251695.39877.ca. [DOI] [PubMed] [Google Scholar]
- 9.Eguchi K, Boden-Albala B, Jin Z, Rundek T, Sacco RL, Homma S, Di Tullio MR. Association between diabetes mellitus and left ventricular hypertrophy in a multiethnic population. Am J Cardiol. 2008;101:1787–1791. doi: 10.1016/j.amjcard.2008.02.082. [DOI] [PMC free article] [PubMed] [Google Scholar]
- 10.Rodriguez CJ, Burg MM, Meng J, Pickering TG, Jin Z, Sacco RL, Boden-Albala B, Homma S, Di Tullio MR. Effect of social support on nocturnal blood pressure dipping. Psychosom Med. 2008;70:7–12. doi: 10.1097/PSY.0b013e31815aab4e. [DOI] [PubMed] [Google Scholar]
- 11.Kronholm E, Laatikainen T, Peltonen M, Sippola R, Partonen T. Self-reported sleep duration, all-cause mortality, cardiovascular mortality and morbidity in Finland. Sleep Med. 2011;12:215–221. doi: 10.1016/j.sleep.2010.07.021. [DOI] [PubMed] [Google Scholar]
- 12.Mesas AE, Lopez-Garcia E, Leon-Munoz LM, Guallar-Castillon P, Rodriguez-Artalejo F. Sleep duration and mortality according to health status in older adults. J Am Geriatr Soc. 2010;58:1870–1877. doi: 10.1111/j.1532-5415.2010.03071.x. [DOI] [PubMed] [Google Scholar]
- 13.Sabanayagam C, Shankar A. Sleep duration and cardiovascular disease: results from the National Health Interview Survey. Sleep. 2010;33:1037–1042. doi: 10.1093/sleep/33.8.1037. [DOI] [PMC free article] [PubMed] [Google Scholar]
- 14.Knutson KL. Sleep duration and cardiometabolic risk: a review of the epidemiologic evidence. Best Pract Res Clin Endocrinol Metab. 2010;24:731–743. doi: 10.1016/j.beem.2010.07.001. [DOI] [PMC free article] [PubMed] [Google Scholar]
- 15.Gottlieb DJ, Redline S, Nieto FJ, Baldwin CM, Newman AB, Resnick HE, Punjabi NM. Association of usual sleep duration with hypertension: the Sleep Heart Health Study. Sleep. 2006;29:1009–1014. doi: 10.1093/sleep/29.8.1009. [DOI] [PubMed] [Google Scholar]
- 16.Fang J, Wheaton AG, Keenan NL, Greenlund KJ, Perry GS, Croft JB. Association of sleep duration and hypertension among US adults varies by age and sex. Am J Hypertens. 2011;25:335–341. doi: 10.1038/ajh.2011.201. [DOI] [PubMed] [Google Scholar]
- 17.Cappuccio FP, Stranges S, Kandala NB, Miller MA, Taggart FM, Kumari M, Ferrie JE, Shipley MJ, Brunner EJ, Marmot MG. Gender-specific associations of short sleep duration with prevalent and incident hypertension: the Whitehall II Study. Hypertension. 2007;50:693–700. doi: 10.1161/HYPERTENSIONAHA.107.095471. [DOI] [PMC free article] [PubMed] [Google Scholar]
- 18.Lima-Costa MF, Peixoto SV, Rocha FL. Usual sleep duration is not associated with hypertension in Brazilian elderly: the Bambui Health Aging Study (BHAS) Sleep Med. 2008;9:806–807. doi: 10.1016/j.sleep.2007.09.005. [DOI] [PubMed] [Google Scholar]
- 19.van den Berg JF, Tulen JH, Neven AK, Hofman A, Miedema HM, Witteman JC, Tiemeier H. Sleep duration and hypertension are not associated in the elderly. Hypertension. 2007;50:585–589. doi: 10.1161/HYPERTENSIONAHA.107.092585. [DOI] [PubMed] [Google Scholar]
- 20.Ishikawa J, Hoshide S, Eguchi K, Ishikawa S, Shimada K, Kario K. Nighttime home blood pressure and the risk of hypertensive target organ damage. Hypertension. 2012;60:921–928. doi: 10.1161/HYPERTENSIONAHA.112.198101. [DOI] [PubMed] [Google Scholar]
- 21.Burr ML, Dolan E, O’Brien EW, O’Brien ET, McCormack P. The value of ambulatory blood pressure in older adults: the Dublin Outcome Study. Age Ageing. 2008;37:201–206. doi: 10.1093/ageing/afm193. [DOI] [PubMed] [Google Scholar]
- 22.Nakano S, Ito T, Furuya K, Tsuda S, Konishi K, Nishizawa M, Nakagawa A, Kigoshi T, Uchida K. Ambulatory blood pressure level rather than dipper/nondipper status predicts vascular events in type 2 diabetic subjects. Hypertens Res. 2004;27:647–656. doi: 10.1291/hypres.27.647. [DOI] [PubMed] [Google Scholar]
- 23.Kim BK, Lim YH, Lee HT, Lee JU, Kim KS, Kim SG, Kim JH, Lim HK, Shin J. Non-dipper pattern is a determinant of the inappropriateness of left ventricular mass in essential hypertensive patients. Korean Circ J. 2011;41:191–197. doi: 10.4070/kcj.2011.41.4.191. [DOI] [PMC free article] [PubMed] [Google Scholar]
- 24.Ohkubo T, Hozawa A, Yamaguchi J, Kikuya M, Ohmori K, Michimata M, Matsubara M, Hashimoto J, Hoshi H, Araki T, Tsuji I, Satoh H, Hisamichi S, Imai Y. Prognostic significance of the nocturnal decline in blood pressure in individuals with and without high 24-h blood pressure: the Ohasama Study. J Hypertens. 2002;20:2183–2189. doi: 10.1097/00004872-200211000-00017. [DOI] [PubMed] [Google Scholar]
- 25.Patel SR, Malhotra A, Gottlieb DJ, White DP, Hu FB. Correlates of long sleep duration. Sleep. 2006;29:881–889. doi: 10.1093/sleep/29.7.881. [DOI] [PMC free article] [PubMed] [Google Scholar]
- 26.Ramos AR, Wohlgemuth WK, Dong C, Gardener H, Wright CB, Boden-Albala B, Elkind MS, Sacco RL, Rundek T. Race-ethnic differences of sleep symptoms in an elderly multi-ethnic cohort: the Northern Manhattan Study. Neuroepidemiology. 2011;37:210–215. doi: 10.1159/000334315. [DOI] [PMC free article] [PubMed] [Google Scholar]
- 27.Sacco RL, Boden-Albala B, Abel G, Lin IF, Elkind M, Hauser WA, Paik MC, Shea S. Race-ethnic disparities in the impact of stroke risk factors: the Northern Manhattan Stroke Study. Stroke. 2001;32:1725–1731. doi: 10.1161/01.str.32.8.1725. [DOI] [PubMed] [Google Scholar]
- 28.Gangwisch JE, Heymsfield SB, Boden-Albala B, Buijs RM, Kreier F, Pickering TG, Rundle AG, Zammit GK, Malaspina D. Short sleep duration as a risk factor for hypertension: analyses of the first National Health and Nutrition Examination Survey. Hypertension. 2006;47:833–839. doi: 10.1161/01.HYP.0000217362.34748.e0. [DOI] [PubMed] [Google Scholar]
- 29.Gale C, Martyn C. Larks and owls and health, wealth, and wisdom. BMJ. 1998;317:1675–1677. doi: 10.1136/bmj.317.7174.1675. [DOI] [PMC free article] [PubMed] [Google Scholar]
- 30.Youngstedt SD, Kripke DF. Long sleep and mortality: rationale for sleep restriction. Sleep Med Rev. 2004;8:159–174. doi: 10.1016/j.smrv.2003.10.002. [DOI] [PubMed] [Google Scholar]