

Abstract
Objective:
To investigate MRI and proton magnetic resonance spectroscopy (MRS) predictors of mild cognitive impairment (MCI) in cognitively normal older adults.
Methods:
Subjects were cognitively normal older adults (n = 1,156) who participated in the population-based Mayo Clinic Study of Aging MRI/MRS study from August 2005 to December 2010 and had at least one annual clinical follow-up. Single-voxel MRS was performed from the posterior cingulate gyri, and hippocampal volumes and white matter hyperintensity volumes were quantified using automated methods. Brain infarcts were assessed on MRI. Cox proportional hazards regression, with age as the time scale, was used to assess the effect of MRI and MRS markers on the risk of progression from cognitively normal to MCI. Linear mixed-effects models were used to assess the effect of MRI and MRS markers on cognitive decline.
Results:
After a median follow-up of 2.8 years, 214 participants had progressed to MCI or dementia (estimated incidence rate = 6.1% per year; 95% confidence interval = 5.3%–7.0%). In univariable modeling, hippocampal volume, white matter hyperintensity volume, and N-acetylaspartate/myo-inositol were significant predictors of MCI in cognitively normal older adults. In multivariable modeling, only decreased hippocampal volume and N-acetylaspartate/myo-inositol were independent predictors of MCI. These MRI/MRS predictors of MCI as well as infarcts were associated with cognitive decline (p < 0.05).
Conclusion:
Quantitative MRI and MRS markers predict progression to MCI and cognitive decline in cognitively normal older adults. MRS may contribute to the assessment of preclinical dementia pathologies by capturing neurodegenerative changes that are not detected by hippocampal volumetry.
Magnetic resonance markers of preclinical dementia–related pathologies are needed for identifying individuals who may benefit from preventive interventions.1 The most common dementia-related pathologies observed in cognitively normal older adults are Alzheimer disease (AD) and vascular disease.2–4 MRI and proton magnetic resonance spectroscopic (1H-MRS) findings typically associated with early neurodegenerative pathology of AD include hippocampal atrophy on structural MRI as well as elevated glial metabolite myo-inositol (mI) and decreased neuronal metabolite N-acetylaspartate (NAA) on MRS.5,6 MRI findings associated with vascular disease include brain infarcts and white matter hyperintensities (WMH) on T2-weighted or fluid-attenuated inversion recovery (FLAIR) MRI. Brain infarcts and WMH are associated with cognitive decline and dementia in older adults without dementia,7–11 and may increase the risk of mild cognitive impairment (MCI) along with the MRI and MRS abnormalities associated with preclinical AD. Hippocampal volumes and MRS abnormalities were complementary in differentiating MCI from cognitively normal subjects and in predicting memory performance in cohorts of elderly persons without dementia.12–14 We previously demonstrated that patients with MCI who have both hippocampal atrophy and MRS metabolite abnormalities have an increased risk of incident dementia compared with those who have only one of the imaging abnormalities (i.e., hippocampal atrophy or MRS abnormalities).15
We hypothesized that MRI and MRS studies performed during a single magnetic resonance examination may provide complementary information about the risk of MCI. Our objective was to determine the AD-associated and vascular disease–associated MRI and MRS predictors of MCI and cognitive decline in cognitively normal older adults from a population-based sample.
METHODS
Subjects.
Subjects of this study were cognitively normal older adults (n = 1,156) who participated in the Mayo Clinic Study of Aging (MCSA) MRI/MRS study from August 2005 to December 2010 and had at least one clinical follow-up evaluation until October 2012. The MCSA is a prospective, population-based study of older adults without dementia in Olmsted County, Minnesota. Individuals participating in the MCSA undergo clinical evaluations and a battery of neuropsychological tests approximately every 15 months as previously described.16 The operational definition of MCI was based on clinical judgment through a history from the patient and from an informant (for the majority of patients) without reference to MRI using the following published criteria: cognitive complaint, cognitive function not normal for age, decline in cognition, essentially normal functional activities, and not demented.17 Diagnosis of dementia was based on the DSM-III-R criteria.18 Diagnosis was determined by a consensus committee including the neurologist, neuropsychologist, and the nurse who evaluated each participant shielded from prior diagnosis.
Inclusion criterion for the present analyses was normal cognitive function at first MRI/MRS examination, which was judged according to the published criteria from normative data.17 Subjects who had a contraindication for MRI such as a pacemaker, or who were unable to participate in imaging studies because of severe illness, were excluded. Subjects were not excluded because of neurologic, psychiatric, or systemic illnesses to preserve the representativeness of the study sample as much as possible.
Neuropsychological testing.
Memory was evaluated by free-recall retention scores computed after a 30-minute delay for the Wechsler Memory Scale–Revised Logical Memory and Visual Reproduction subtests and the Rey Auditory Verbal Learning Test. Language tests measured naming to confrontation (i.e., the Boston Naming Test) and category fluency (i.e., naming animals, fruits, and vegetables). The attention/executive measures included the Trail Making Test part B and the Wechsler Adult Intelligence Scale–Revised Digit Symbol subtest. Visual-spatial processing was examined using the Wechsler Adult Intelligence Scale–Revised Picture Completion and Block Design subtests. All tests were administered by experienced psychometrists and supervised by a clinical neuropsychologist (R.J.I.). All raw neuropsychological test scores were scaled such that they had a mean of 0.0 and a standard deviation of 1.0 among all MCSA full participants.17 We obtained individual domain scores by averaging and scaling the tests within each domain. A global cognitive function standard score was derived by averaging and scaling the 4 standardized cognitive domain scores.
MRI and 1H-MRS.
All subjects underwent MRI and MRS examinations at 3-tesla using an 8-channel phased array coil (GE Healthcare, Waukesha, WI). A 3-dimensional, high-resolution magnetization-prepared rapid-acquisition gradient echo19 was performed for hippocampal volume measurements. Hippocampal volume was measured with FreeSurfer software (version 4.5.0)20 and was divided by subject’s total intracranial volume (TIV) and multiplied by 100 to reflect the percent of TIV occupied by the hippocampus. A FLAIR sequence with repetition time/inversion time/echo time = 11,000/2,250/147 milliseconds, 256 × 192 matrix, 24-cm field of view, and 3-mm interleaved images of the whole head was performed to quantify WMH volume and for the assessment of brain infarcts. Brain infarcts were assessed by a trained image analyst (G.M.P.) and secondarily confirmed by a radiologist (K.K.) blinded to all clinical information. Subcortical infarcts included infarcts in the white matter (WM), deep gray matter nuclei, cerebellum, and brainstem not involving the hemispheric cortices. Cortical infarcts were ≥1 cm in largest diameter. Intra-rater reliability of this assessment is excellent (proportion in agreement 0.98 for cortical and 0.94 for subcortical infarcts).13
WMH on FLAIR images were segmented using an automated slice-based seed initialization and region-growing method as previously described.21 WMH volumes were divided by the total WM volume in order to adjust for the differences in “WM-at-risk” across subjects and denoted by WMH/WM.
1H-MRS was performed using a point-resolved spectroscopic sequence with repetition time/echo time = 2,000/30 milliseconds and an 8-cm3 (2 × 2 × 2 cm) voxel, prescribed on a midsagittal slice, including right and left posterior cingulate gyri and inferior precunei.22 Metabolite intensities were quantified by referencing to an internal standard creatine (Cr).
Standard protocol approvals, registrations, and patient consents.
This study was approved by the Mayo Clinic and Olmsted Medical Center Institutional Review Board, and informed consent for participation was obtained from every subject.
Statistical analysis.
We used Cox proportional hazards regression models to evaluate associations between MRI/MRS predictors and the hazard of progression from cognitively normal to MCI or dementia. As the distribution of WMH/WM was skewed, this measure was transformed to the natural logarithm scale for analysis. Because age is strongly associated with the risk of MCI, it was used as the time scale in these regression models when evaluating these relationships. Study participants were considered to be at risk of progression from normal cognition to MCI only for those ages at which they were under observation, through the application of the “period at risk” formulation of the Cox model. The initial age was taken to be the age at the baseline magnetic resonance visit. The censoring age for subjects who did not convert to MCI or dementia was the age when the subjects were last evaluated and found to be normal. The age at incident MCI was taken to be the age at the midpoint between the study visit when MCI was diagnosed and the prior visit when the participant was last classified as having normal cognition.
Quantitative imaging measures were entered into proportional hazards models as continuous variables, modeled as restricted cubic splines with knots at the 10th, 50th, and 90th percentiles. We report hazard ratios (HRIQR) and corresponding 95% confidence intervals for hypothetical subjects whose imaging measures differ by the interquartile range (IQR) of the imaging measure. These HRs compare the “unfavorable” with the “favorable” quartiles, depending on whether larger values of the imaging measure are associated with decreased (e.g., hippocampal volume) or increased (e.g., WMH/WM) hazards of incident MCI. Our use of HRIQR is motivated by the desire to avoid strong functional assumptions for the predictors, and to facilitate comparisons across predictors. In addition to HRs, we illustrate the associations of interest by presenting Kaplan-Meier survival curves for groups defined by quartiles of the imaging features.
We performed an extensive number of sensitivity analyses to evaluate the validity of our conclusions. In particular, a) we tested the proportional hazards assumption required by the Cox models; b) we evaluated the sensitivity of our HR estimates to possible participation bias using inverse probability weighting based on associations between baseline features and participation in imaging studies; and c) we evaluated the sensitivity of our HR estimates to possible nonrandom censoring (possibly due to competing risks) using inverse probability weighting based on associations between baseline features and continued participation in the MCSA, where participation was defined conservatively as being no more than 3 months past due for a regularly scheduled follow-up visit or death.
In addition to the time-to-event analyses, we used restricted maximum likelihood linear mixed-effects models, which incorporated random subject-specific slopes and intercepts, to model longitudinal trends in a standardized composite “global z” cognitive score over time. Our models treated time from baseline magnetic resonance as the time scale and included terms for baseline age and baseline imaging measures, both modeled with restricted cubic splines as in our Cox models. Through the use of interaction terms, our models allowed a participant’s baseline cognitive score and his or her rate of cognitive change to be associated with both baseline age and baseline imaging markers. We performed a likelihood ratio test to compare the fit of the full model with one omitting the imaging measure to assess whether the imaging measure was associated with global z in general. We summarize the association between the imaging measures and global z by reporting differences at baseline and differences in rate of change for the unfavorable vs favorable quartiles, fixing age at 79 years, its mean/median. All longitudinal and survival models included sex and education as adjustment variables.
RESULTS
Baseline characteristics of the MCSA participants who had at least one clinical follow-up visit are listed in table 1. Demographic characteristics of cognitively normal subjects who underwent MRI/MRS were comparable to those of MCSA participants who did not undergo magnetic resonance examinations. However, MRI/MRS study participants had 1-year-longer median education and performed slightly better on cognitive tests than the nonparticipants, suggesting a minor nonparticipation bias. After a median (range) of progression-free follow-up of 2.8 (0.9–6.6) years, 234 participants were diagnosed with incident MCI and 9 participants were diagnosed with dementia. Because there were so few progressors to dementia, the results described for MCI include the 9 participants with incident dementia. The estimated incidence rate of progression to MCI was 6.1% per year (95% confidence interval = 5.3%–7.0%). The rate of progression to MCI was strongly associated with age (relative risk ratio for age 85 vs 75 years = 2.1; 95% confidence interval = 1.7–2.8). These rates are comparable to those reported in the entire MCSA.23 The flow chart in figure 1 demonstrates the follow-up and outcomes in the MRI/MRS study participants and nonparticipants.
Table 1.
Demographic characteristics and MRI/MRS findings among MCSA subjects with at least one follow-up visit
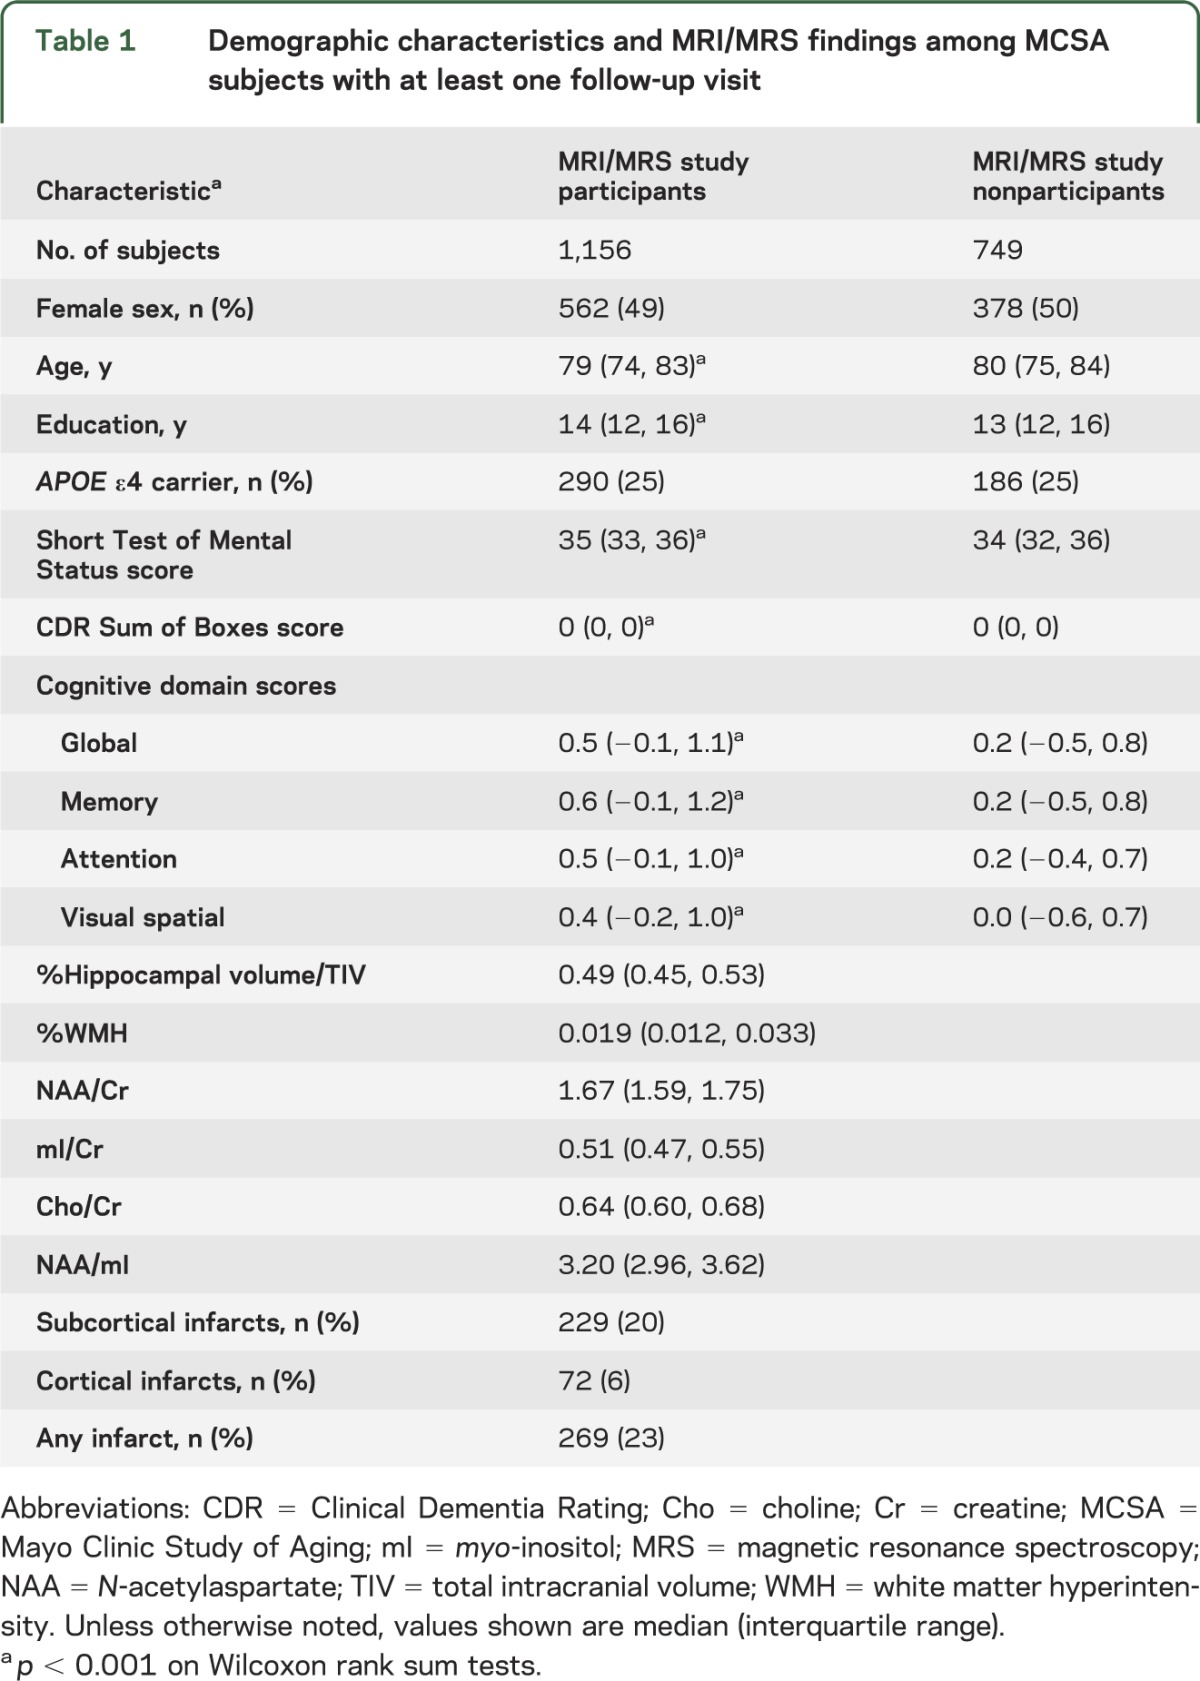
Figure 1. Flow diagram of the study population by October 2012.

We followed 1,156 subjects and observed 243 events (21%). Of the remaining 913 “nonevents,” 657 of 1,156 (57%) were censored in that by October 2012 they were not known to be dead and not more than 3 months overdue for their next scheduled follow-up visit. The remaining 256 of 1,156 (22%) were considered dropouts in that they died before follow-up (70/1,156, 6%) or were more than 3 months overdue for their visit (186/1,156, 16%). MCI = mild cognitive impairment; MCSA = Mayo Clinic Study of Aging.
Proportional hazards models for each of the MRI/MRS variables indicate that lower hippocampal volume/TIV, %WMH, NAA/Cr, mI/Cr, and NAA/mI were predictors of the risk of progression to MCI using age as the time scale and adjusting for sex and education, and choline/Cr showed a similar trend. By contrast, neither subcortical infarcts nor cortical infarcts were significantly associated with the risk of MCI in univariate modeling adjusted for sex and education (figure 2A).
Figure 2. Hazard ratio estimates and 95% confidence intervals from univariable (A) and multivariable (B) Cox proportional hazards models.

Hazard ratios for continuous predictors represent an interquartile difference (HRIQR, described in the Methods section) to aid interpretation and facilitate comparisons across variables. Cho = choline; CI = confidence interval; Cr = creatine; mI = myo-inositol; NAA = N-acetylaspartate; TIV = total intracranial volume; WM = white matter; WMH = white matter hyperintensity volume.
Although decreased NAA/Cr and NAA/mI and elevated mI/Cr ratios were associated with the risk of MCI, we only included NAA/mI ratio in multivariable modeling and excluded NAA/Cr and mI/Cr because of the colinearity with NAA/mI. Proportional hazards multivariable modeling showed independent effects of hippocampal volume/TIV and NAA/mI ratios as the only independent predictors of MCI risk using age as the time scale (figure 2B). The joint effects of the 2 independent magnetic resonance predictors are demonstrated with survival curves comparing 3 groups as defined by the quartiles in figure 3.
Figure 3. Survival curves based on tertile groups for hippocampal volume/TIV and NAA/mI.

Curves illustrate the estimated probability of remaining cognitively normal (CN), assuming normal cognition at age 70 years. The light blue line corresponds to subjects in the favorable or higher hippocampal volume/TIV and NAA/mI. The dark blue line corresponds to subjects in the middle hippocampal volume/TIV and NAA/mI. The light green line corresponds to subjects in the unfavorable or low hippocampal volume/TIV and NAA/mI. hipp. vol. = hippocampal volume; mI = myo-inositol; NAA = N-acetylaspartate; TIV = total intracranial volume.
MRI/MRS variables that were found to be associated with the risk of MCI were also associated with decline in global cognitive function (z scores) in linear mixed-effects models (table 2). Hippocampal volume/TIV, %WMH, NAA/Cr, mI/Cr, and NAA/mI at baseline were predictors of cognitive decline. In addition, we found an association between the presence of any infarct (cortical or subcortical) and cognitive decline.
Table 2.
Association between global cognitive z score and imaging measuresa

Overall, we found no evidence of participation bias and competing risk influence on our findings. Although table 1 indicates statistically significant differences between imaging participants and nonparticipants, our HRs changed little when we performed inverse probability testing. When performing inverse probability of censoring weighting, we found that older ages and lower levels of education were associated with increased odds of withdrawing from the study, and to some extent, lower cognitive performance was associated with increased odds of withdrawing. However, our HRs did not differ in the model that inversely weighted participants by their probability of withdrawing from the study.
DISCUSSION
In a population-based sample of cognitively normal older adults, MRI and MRS markers of neurodegeneration and WMH were significant predictors of progression to MCI and cognitive decline. Among these markers, only hippocampal atrophy on MRI and low NAA/mI on MRS independently predicted increased risk of MCI in multivariable modeling. Although infarcts were associated with greater decline in global cognitive function, they did not increase the risk of MCI during the median follow-up period of 2.8 years.
Single-voxel MRS is a molecular imaging modality providing an array of information on neuronal integrity, glial activity, and membrane turnover from a region of interest during a 6-minute scan. We chose to study the posterior cingulate gyrus voxel because of greater metabolite measurement reliability and higher sensitivity to early AD pathology compared with other regions of the brain, including the hippocampus.24 We found that low levels of the neuronal integrity marker NAA and high levels of the glial metabolite mI increased the risk for MCI. We combined NAA and mI as NAA/mI ratio because previously among all MRS measures, low antemortem NAA/mI was the strongest predictor of intermediate- and high-likelihood AD at autopsy,6 and showed the greatest decline in patients with AD compared with the cognitively normal controls.25 For these reasons and to avoid multicollinearity, only NAA/mI ratio was included in the multivariable modeling to detect independent predictors of MCI risk.
Hippocampal atrophy on MRI is a sensitive marker for the neurodegenerative pathology associated with AD.5 Hippocampal atrophy is included as one of the imaging markers of neurodegeneration in the National Institute on Aging–Alzheimer’s Association criteria for preclinical AD.26 We recently operationalized these criteria in the MCSA cognitively normal participants.27,28 An exception, however, is patients with the hippocampal-sparing subtype of AD, which was identified in up to 11% of a pathologically confirmed AD cohort.29 As expected, patients with the hippocampal-sparing subtype of AD have relatively preserved hippocampal volumes on MRI.30 However, there is evidence from patients with posterior cortical atrophy that the posterior cingulate gyrus NAA/mI is decreased in these individuals with AD pathology and normal hippocampal volumes.31 Thus, MRS may have added value in detecting the preclinical neurodegenerative involvement in cases of atypical AD pathology. Current study participants with preserved hippocampal volumes but low NAA/mI ratios who progressed to MCI may have atypical AD, a non-AD degenerative pathology, or cerebrovascular pathology.
In this population-based sample of cognitively normal older adults, MRI markers of small-vessel disease, such as WMH and infarcts, were modestly associated with cognitive decline or MCI. WMH was associated with the risk of MCI, and infarcts were associated with decline in cognitive function, although the decline in cognitive function in those with infarcts was not sufficient to increase the risk of MCI during the median follow-up time of 2.8 years. Findings on WMH and infarcts in the current study are consistent with the findings from community-based cohorts of similar size7,11,32,33 and other cohorts of cognitively normal elderly persons or those without dementia.8–10 Interestingly, in multivariable modeling including hippocampal volumes and MRS metabolites, WMH did not independently increase the risk of MCI. NAA levels are decreased in vascular dementia, even in cortical regions remote from the infarction.34–36 With the additional information gained from elevated glial metabolite mI, it is possible that NAA/mI ratio on MRS has a higher sensitivity in detecting cellular and molecular changes associated with small-vessel disease than WMH load. This hypothesis needs to be tested in an autopsy-confirmed sample.
Contrary to findings in WMH, we did not find an association between infarcts and the risk of MCI. One explanation is that people with infarcts that affect cognition are often diagnosed with MCI immediately after the infarction and therefore are not included in the current study on cognitively normal participants. Higher prevalence of stroke in MCI compared with cognitively normal participants in the MCSA further supports this hypothesis.37 It also is possible that the risk of cognitive decline or MCI in cognitively normal participants with infarcts will increase with longer follow-up and subsequent infarcts affecting cognition, as demonstrated previously.7,38 Another reason, however, may be nonparticipation bias. Although all MCSA participants were offered MRI/MRS examinations, only 61% of the sample with a follow-up visit participated in the MRI/MRS study. The remaining 39% were either not willing to participate or could not participate in imaging studies because of medical reasons such as having a pacemaker or poor general health (e.g., participants with poststroke disabilities). However, participation-weighted analysis indicated that participation bias did not change our findings.
Using a standard vendor-provided acquisition protocol and software for the analysis of the MRS data, we demonstrated that MRS can contribute to the assessment of preclinical dementia–related abnormalities by capturing neurodegenerative changes not reflected by hippocampal atrophy. MRS metabolite abnormalities in the posterior cingulate gyrus are not currently included among the MRI and 18F-fluorodeoxyglucose (FDG)-PET markers of neurodegeneration in preclinical staging of AD. However, in the current study, we demonstrate that both hippocampal atrophy and reduced NAA/mI can be valuable markers of early neurodegeneration and that together these quantitative magnetic resonance markers may improve the detection of preclinical dementia–related pathology. Although we have not used MRS in our operationalization of the National Institute on Aging–Alzheimer’s Association preclinical AD criteria,27,28 MRS should be included in future investigations. If MRS and FDG-PET, for example, had substantial overlap, a magnetic resonance examination alone might suffice for assessment of risk. A better understanding of the pathologic basis of MRS metabolite abnormalities in aging and dementia would further increase the impact of MRS as a biomarker in neurodegenerative diseases.
GLOSSARY
- AD
Alzheimer disease
- Cr
creatine
- DSM-III-R
Diagnostic and Statistical Manual of Mental Disorders, 3rd edition, revised
- FDG
18F-fluorodeoxyglucose
- FLAIR
fluid-attenuated inversion recovery
- 1H-MRS
proton magnetic resonance spectroscopy
- HR
hazard ratio
- IQR
interquartile range
- MCI
mild cognitive impairment
- MCSA
Mayo Clinic Study of Aging
- mI
myo-inositol
- MRS
magnetic resonance spectroscopy
- NAA
N-acetylaspartate
- TIV
total intracranial volume
- WM
white matter
- WMH
white matter hyperintensity
AUTHOR CONTRIBUTIONS
Dr. Kantarci: study concept and design, acquisition of data, analysis and interpretation of the data, drafting the manuscript. Mr. Weigand: study concept and design, analysis or interpretation of the data, critical revision of the manuscript for important intellectual content. Mr. Przybelski: analysis or interpretation of the data, critical revision of the manuscript for important intellectual content. Mr. Preboske: acquisition of data, critical revision of the manuscript for important intellectual content. Dr. Pankratz: study concept and design, analysis or interpretation of the data, critical revision of the manuscript for important intellectual content. Dr. Vemuri, Mr. Senjem, Dr. Murphy, Dr. Gunter, Dr. Machulda, Dr. Ivnik, Dr. Roberts, Dr. Boeve, Dr. Rocca, Dr. Knopman, and Dr. Petersen: acquisition of data, critical revision of the manuscript for important intellectual content. Dr. Jack: study concept and design, acquisition of data, critical revision of the manuscript for important intellectual content.
STUDY FUNDING
This work was supported by the NIH (U01 AG06786, R01 AG11378, R01 AG040042, C06 RR018898) and the Robert H. and Clarice Smith and Abigail Van Buren Alzheimer’s Disease Research Program.
DISCLOSURE
K. Kantarci serves on the data safety monitoring board for Pfizer Inc., Takeda Global Research & Development Center, Inc.; and is funded by the NIH. S. Weigand, S. Przybelski, and G. Preboski report no disclosures. V.S. Pankratz is funded by the NIH. P. Vemuri is funded by the NIH and Alzheimer’s Association New Investigator Award. M. Senjem, M. Murphy, M. Machulda, and J. Gunter report no disclosures. R. Ivnik receives research support from the NIH. R. Roberts receives research support from the NIH, Abbott Laboratories, and the Driskill Foundation. B. Boeve has served as an investigator for a clinical trial sponsored by Cephalon, Inc. He has received honoraria from the American Academy of Neurology. He receives research support from the National Institute on Aging and the Alzheimer’s Association. W. Rocca receives research support from the NIH and the DHHS. D. Knopman serves as Deputy Editor for Neurology®; serves on a data safety monitoring board for Lilly Pharmaceuticals; is an investigator in a clinical trial sponsored by Janssen Pharmaceuticals; and receives research support from the NIH. R. Petersen serves on scientific advisory boards for Elan Pharmaceuticals, Wyeth Pharmaceuticals, and GE Healthcare; and receives research support from the NIH. C. Jack serves as a consultant for Janssen, Bristol-Myers Squibb, General Electric, and Johnson & Johnson, and is involved in clinical trials sponsored by Allon and Baxter, Inc. He receives research funding from the NIH and the Alexander Family Alzheimer’s Disease Research Professorship of the Mayo Foundation. Go to Neurology.org for full disclosures.
REFERENCES
- 1.Morris JC, Kimberly A, Quaid K, et al. Role of biomarkers in studies of presymptomatic Alzheimer’s disease. Alzheimers Dement 2005;1:145–151 [DOI] [PubMed] [Google Scholar]
- 2.Knopman DS, Parisi JE, Salviati A, et al. Neuropathology of cognitively normal elderly. J Neuropathol Exp Neurol 2003;62:1087–1095 [DOI] [PubMed] [Google Scholar]
- 3.Sonnen JA, Santa Cruz K, Hemmy LS, et al. Ecology of the aging human brain. Arch Neurol 2011;68:1049–1056 [DOI] [PMC free article] [PubMed] [Google Scholar]
- 4.Schneider JA, Arvanitakis Z, Leurgans SE, Bennett DA. The neuropathology of probable Alzheimer disease and mild cognitive impairment. Ann Neurol 2009;66:200–208 [DOI] [PMC free article] [PubMed] [Google Scholar]
- 5.Jack CR, Jr, Dickson DW, Parisi JE, et al. Antemortem MRI findings correlate with hippocampal neuropathology in typical aging and dementia. Neurology 2002;58:750–757 [DOI] [PMC free article] [PubMed] [Google Scholar]
- 6.Kantarci K, Knopman DS, Dickson DW, et al. Alzheimer disease: postmortem neuropathologic correlates of antemortem 1H MR spectroscopy metabolite measurements. Radiology 2008;248:210–220 [DOI] [PMC free article] [PubMed] [Google Scholar]
- 7.Vermeer SE, Prins ND, den Heijer T, Hofman A, Koudstaal PJ, Breteler MM. Silent brain infarcts and the risk of dementia and cognitive decline. N Engl J Med 2003;348:1215–1222 [DOI] [PubMed] [Google Scholar]
- 8.Smith EE, Egorova S, Blacker D, et al. Magnetic resonance imaging white matter hyperintensities and brain volume in the prediction of mild cognitive impairment and dementia. Arch Neurol 2008;65:94–100 [DOI] [PubMed] [Google Scholar]
- 9.Silbert LC, Nelson C, Howieson DB, Moore MM, Kaye JA. Impact of white matter hyperintensity volume progression on rate of cognitive and motor decline. Neurology 2008;71:108–113 [DOI] [PMC free article] [PubMed] [Google Scholar]
- 10.DeCarli C, Miller BL, Swan GE, Reed T, Wolf PA, Carmelli D. Cerebrovascular and brain morphologic correlates of mild cognitive impairment in the National Heart, Lung, and Blood Institute Twin Study. Arch Neurol 2001;58:643–647 [DOI] [PubMed] [Google Scholar]
- 11.Debette S, Beiser A, DeCarli C, et al. Association of MRI markers of vascular brain injury with incident stroke, mild cognitive impairment, dementia, and mortality: the Framingham Offspring Study. Stroke 2010;41:600–606 [DOI] [PMC free article] [PubMed] [Google Scholar]
- 12.Zimmerman ME, Pan JW, Hetherington HP, et al. Hippocampal neurochemistry, neuromorphometry, and verbal memory in nondemented older adults. Neurology 2008;70:1594–1600 [DOI] [PMC free article] [PubMed] [Google Scholar]
- 13.Kantarci K, Petersen RC, Przybelski SA, et al. Hippocampal volumes, proton magnetic resonance spectroscopy metabolites, and cerebrovascular disease in mild cognitive impairment subtypes. Arch Neurol 2008;65:1621–1628 [DOI] [PMC free article] [PubMed] [Google Scholar]
- 14.Chao LL, Schuff N, Kramer JH, et al. Reduced medial temporal lobe N-acetylaspartate in cognitively impaired but nondemented patients. Neurology 2005;64:282–289 [DOI] [PMC free article] [PubMed] [Google Scholar]
- 15.Kantarci K, Weigand SD, Przybelski SA, et al. Risk of dementia in MCI: combined effect of cerebrovascular disease, volumetric MRI, and 1H MRS. Neurology 2009;72:1519–1525 [DOI] [PMC free article] [PubMed] [Google Scholar]
- 16.Roberts RO, Geda YE, Knopman DS, et al. The Mayo Clinic Study of Aging: design and sampling, participation, baseline measures and sample characteristics. Neuroepidemiology 2008;30:58–69 [DOI] [PMC free article] [PubMed] [Google Scholar]
- 17.Petersen RC, Roberts RO, Knopman DS, et al. Prevalence of mild cognitive impairment is higher in men. The Mayo Clinic Study of Aging. Neurology 2010;75:889–897 [DOI] [PMC free article] [PubMed] [Google Scholar]
- 18.American Pychiatric Association Diagnostic and Statistical Manual of Mental Disorders: DSM-III-R. Washington, DC: American Pychiatric Association; 1987 [Google Scholar]
- 19.Jack CR, Jr, Bernstein MA, Borowski BJ, et al. Update on the magnetic resonance imaging core of the Alzheimer’s disease neuroimaging initiative. Alzheimers Dement 2010;6:212–220 [DOI] [PMC free article] [PubMed] [Google Scholar]
- 20.Fischl B, Salat DH, Busa E, et al. Whole brain segmentation: automated labeling of neuroanatomical structures in the human brain. Neuron 2002;33:341–355 [DOI] [PubMed] [Google Scholar]
- 21.Raz L, Jayachandran M, Tosakulwong N, et al. Thrombogenic microvesicles and white matter hyperintensities in postmenopausal women. Neurology 2013;80:911–918 [DOI] [PMC free article] [PubMed] [Google Scholar]
- 22.Kantarci K, Jack CR, Jr, Xu YC, et al. Regional metabolic patterns in mild cognitive impairment and Alzheimer’s disease: a 1H MRS study. Neurology 2000;55:210–217 [DOI] [PMC free article] [PubMed] [Google Scholar]
- 23.Roberts RO, Geda YE, Knopman DS, et al. The incidence of MCI differs by subtype and is higher in men: the Mayo Clinic Study of Aging. Neurology 2012;78:342–351 [DOI] [PMC free article] [PubMed] [Google Scholar]
- 24.Kantarci K. 1H magnetic resonance spectroscopy in dementia. Br J Radiol 2007;80:S146–S152 [DOI] [PubMed] [Google Scholar]
- 25.Schott JM, Frost C, MacManus DG, Ibrahim F, Waldman AD, Fox NC. Short echo time proton magnetic resonance spectroscopy in Alzheimer’s disease: a longitudinal multiple time point study. Brain 2010;133:3315–3322 [DOI] [PMC free article] [PubMed] [Google Scholar]
- 26.Sperling RA, Aisen PS, Beckett LA, et al. Toward defining the preclinical stages of Alzheimer’s disease: recommendations from the National Institute on Aging–Alzheimer’s Association workgroups on diagnostic guidelines for Alzheimer’s disease. Alzheimers Dement 2011;7:280–292 [DOI] [PMC free article] [PubMed] [Google Scholar]
- 27.Jack CR, Jr, Knopman DS, Weigand SD, et al. An operational approach to National Institute on Aging–Alzheimer’s Association criteria for preclinical Alzheimer disease. Ann Neurol 2012;71:765–775 [DOI] [PMC free article] [PubMed] [Google Scholar]
- 28.Knopman DS, Jack CR, Jr, Wiste HJ, et al. Short-term clinical outcomes for stages of NIA-AA preclinical Alzheimer disease. Neurology 2012;78:1576–1582 [DOI] [PMC free article] [PubMed] [Google Scholar]
- 29.Murray ME, Graff-Radford NR, Ross OA, Petersen RC, Duara R, Dickson DW. Neuropathologically defined subtypes of Alzheimer’s disease with distinct clinical characteristics: a retrospective study. Lancet Neurol 2011;10:785–796 [DOI] [PMC free article] [PubMed] [Google Scholar]
- 30.Whitwell JL, Dickson D, Murray ME, Petersen RC, Jack CR, Jr, Josephs KA. MRI in pathologically defined hippocampal sparing and limbic predominant atypical variants of Alzheimer’s disease. Alzheimers Dement 2012;8:P9 [Google Scholar]
- 31.Whitwell JL, Jack CR, Jr, Kantarci K, et al. Imaging correlates of posterior cortical atrophy. Neurobiol Aging 2007;28:1051–1061 [DOI] [PMC free article] [PubMed] [Google Scholar]
- 32.Prins ND, van Dijk EJ, den Heijer T, et al. Cerebral small-vessel disease and decline in information processing speed, executive function and memory. Brain 2005;128:2034–2041 [DOI] [PubMed] [Google Scholar]
- 33.De Groot JC, De Leeuw FE, Oudkerk M, et al. Periventricular cerebral white matter lesions predict rate of cognitive decline. Ann Neurol 2002;52:335–341 [DOI] [PubMed] [Google Scholar]
- 34.Kantarci K, Petersen RC, Boeve BF, et al. 1H MR spectroscopy in common dementias. Neurology 2004;63:1393–1398 [DOI] [PMC free article] [PubMed] [Google Scholar]
- 35.Shiino A, Watanabe T, Shirakashi Y, et al. The profile of hippocampal metabolites differs between Alzheimer’s disease and subcortical ischemic vascular dementia, as measured by proton magnetic resonance spectroscopy. J Cereb Blood Flow Metab 2012;32:805–815 [DOI] [PMC free article] [PubMed] [Google Scholar]
- 36.MacKay S, Meyerhoff DJ, Constans JM, Norman D, Fein G, Weiner MW. Regional gray and white matter metabolite differences in subjects with AD, with subcortical ischemic vascular dementia, and elderly controls with 1H magnetic resonance spectroscopic imaging. Arch Neurol 1996;53:167–174 [DOI] [PMC free article] [PubMed] [Google Scholar]
- 37.Knopman DS, Roberts RO, Geda YE, et al. Association of prior stroke with cognitive function and cognitive impairment: a population-based study. Arch Neurol 2009;66:614–619 [DOI] [PMC free article] [PubMed] [Google Scholar]
- 38.Rasquin SM, van Oostenbrugge RJ, Verhey FR, Lodder J. Vascular mild cognitive impairment is highly prevalent after lacunar stroke but does not increase over time: a 2-year follow-up study. Dement Geriatr Cogn Disord 2007;24:396–401 [DOI] [PubMed] [Google Scholar]