Abstract
We describe a novel method to detect very low concentrations of bacteria in water. Our device consists of a portable horizontal geometry small confocal microscope with large pinhole and a holder for cylindrical cuvettes containing the sample. Two motors provide a fast rotational and slow vertical motion of the cuvette so the device looks like a simplified flow cytometer without flow. To achieve high sensitivity the design has two detection channels. Bacteria are stained by two different nucleic acid dyes and excited with two different lasers. Data are analyzed with a correlation filter based on particle passage pattern recognition. The passage of a particle through the illumination volume is compared with a Gaussian pattern in both channels. The width of the Gaussian correlates with the time of passage of the particle so one particle is counted when the algorithm finds a match with a Gaussian in both channels. The concentration of particles in the sample is deduced from the total number of coincident hits and the total volume scanned. This portable setup provides higher sensitivity, low cost and it could have a wide use ranging from clinical applications to pollution monitors and water and air quality control.
Keywords: Bacteria detection, ultra-low concentration, pattern recognition algorithm
1. Introduction
The rapid detection of infectious disease agents is of primary importance for medical diagnosis, public health, food safety and environment monitoring. Traditional culture-based methods for the detection and enumeration of bacteria are limited to viable and cultivable cells and are typically time consuming due to the several days of incubation necessary for the visualization of colonies (Reynolds and Fricker, 1999).
In the past years, considerable effort has been devoted toward the development of culture-independent techniques for the rapid and sensitive detection of pathogens, including non-viable or non-cultivable cells (Yang et al., 2010). In the last years different technique have been developed such as DNA microarray (Ahn and Walt, 2005; Kim et al., 2005; Cho and Tiedje, 2001), PT-PCR (Malorny et al., 2008; Kramer et al., 2009; Mafu et al., 2009), enzyme-linked immunosorbent assay (ELISA) (Ferguson et al., 2000; Tamminen et al., 2004), surface plasmon resonance (SPR) (Maalouf et al., 2007; Oh et al., 2005; Dudak and Boyaci, 2009), magnetic nanoparticle based immunoassay (Malorny et al., 2008; Gu et al., 2003), various formats of biosensors (Gehring et al., 1998; Liao and Ho, 2009; Lu et al., 2009; Wong et al., 2002) and flow cytometry (Busam et al., 2007; Hahn et al., 2008; Hibi et al., 2007; Qin et al., 2008; Moragues et al., 2004; Ferrari et al., 2004).
Among these techniques, flow cytometry has emerged as a powerful analytical tool in the hand of molecular biologists and toxicologists for quantizing bacterial amounts in food or water samples, assessing cell surface antigens with immunofluorescence, analyzing cell cycles, and testing cell viability (Hahn et al., 2008; Holmes et al., 2001; June and Moore, 2004; Steen, 2000). Compared to epifluorescence microscopy, which is time consuming and requires highly trained personnel, flow cytometry provides a faster and automatic way to detect bacteria labeled with fluorescent markers such as viability substrates, antibodies and nucleic acid probes (Reynolds and Fricker, 1999).
In flow cytometry micro-organism are detected and enumerated as they move in a fluid stream through an optical detection region where the particles interact one at a time. Measurements on cells are made by exciting them, most commonly with a laser, and an optical sensor measures the light scattered or emitted by the cells. Labeled probes and fluorescent dyes aid the detection of a variety of cell types and cell components. Flow cytometry has proved to be an efficient and rapid method, it is a powerful and versatile technique that can be applied to many biological problems, but there are limitations and drawbacks to this technology.
The measured cell concentrations are typically on the order of 104–106 particles/ml unless the sample is pre-concentrated. The sample needs to be carefully filtered to prevent obstructions of the flow. Other limitations are portability and relatively high cost and for these reasons alternative methods have been proposed (Sakamoto et al., 2007).
The purpose of this work is to present an alternative to optical flow cytometry with a portable, high-sensitive, dual channel fluorescence detection setup. The device is based on the principles of scanning Fluorescence Correlation Spectroscopy (FCS), a technique that has been extensively applied for detecting the motion of single molecules and cells (Berland et al., 1996). The setup is similar to a small confocal microscope with the observation volume located inside a cylindrical cuvette containing the sample. Two motors generate a fast rotation and slower vertical motion of the cuvette so that particles are detected as they cross the observation volume. In this sense the device looks like a simplified flow cytometer without flow. The device is able to measure the concentrations of fluorescent particles in water even at extremely low concentration (few particles/ml) and in very short sample scanning periods (about 1 minute). Our method does not require sample filtration and does not result in loss or degradation of the sample during the analysis. Other advantage in our device is that it is highly portable and easily operated by technicians without extensive training. Samples could be held in sealed cuvettes and the measurement produces no contamination of the instrument or of the environment. Therefore the method could be applied to highly toxic biomaterials or samples that need to be preserved for further analysis.
2. Experimental section
2.1. Instrument design
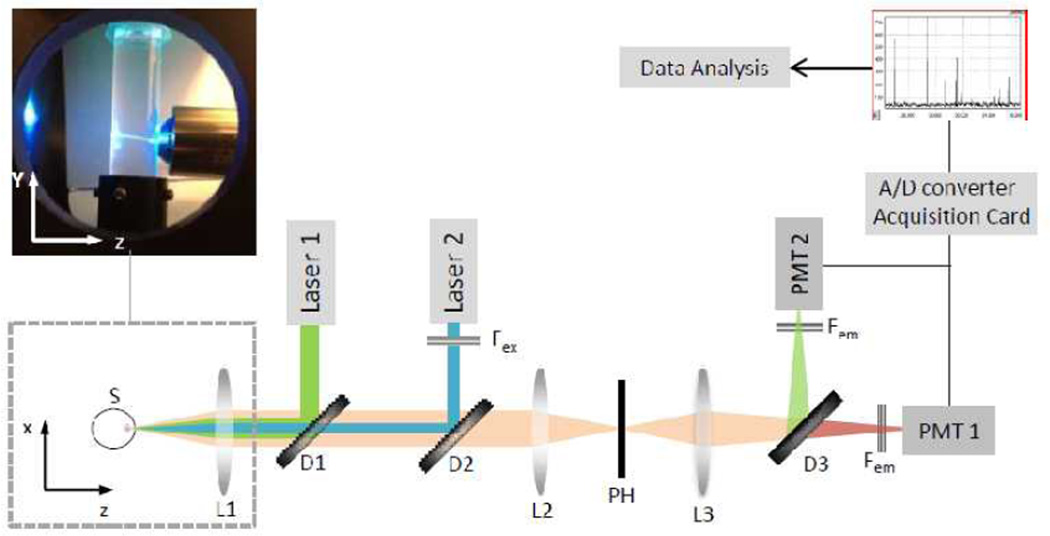
The instrument design is largely based on an original version of the device which had only a single detection channel (Gratton E., 2009).The device has been developed into a two channels setup to allow the simultaneous red and green fluorescence detection for the rapid quantification of the total number of bacterial cells. Figure 1 shows the schematic diagram of the setup.
Figure 1.
Schematic diagram of the instrument. Excitation light from the laser sources (Laser1 and Laser2) is combined through the dichroic mirrors (D1 and D2) and focused on the sample (S) through an objective lens (L1) (see photo). Emission light collected from the same objective and transmitted through the dichroic filters is focused via a lens (L2) into a confocal pinhole (PH). The light beam is further collimated by another lens (L3) toward the detection unit. A dichroic filter (D3) splits the emission beam before reaching the emission filters (Fem) placed in front of the two photomultiplier tubes (PMT1 and PMT2). The analog signals from the PMTs are converted and acquired through a card on a computer for the data analysis.
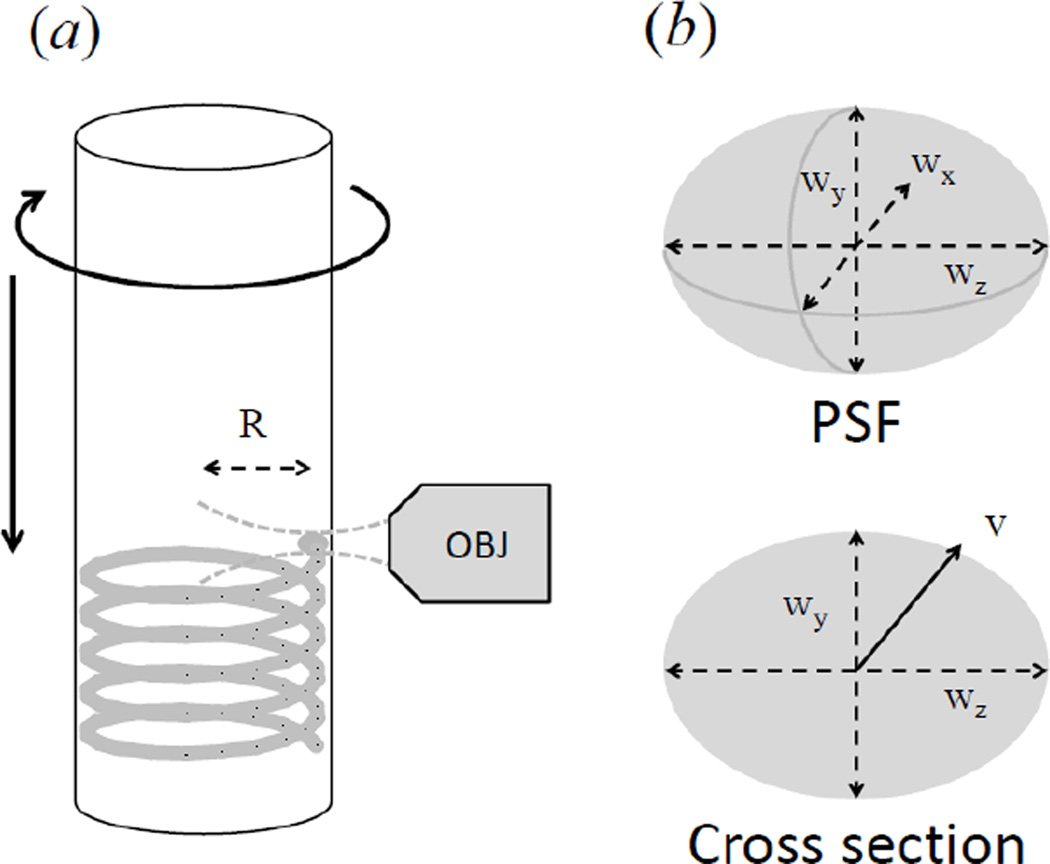
The apparatus consists of a small microscope that has a horizontal geometry and a mechanical part that holds a cylindrical cuvette whose diameter is 1cm. Two motors provide a rotational and vertical up-and-down motion of the cuvette. The software allows changing the rate of the rotational speed in the range 10–1100 rpm and the rate for the vertical motion in the range 1 to 15 mm/sec. The vertical and rotational motions are produced respectively by the Linear Actuator series3500-Haydon (Haydon Kerk, Waterbury, CT, USA) and a VEXTA stepping motor model PK233PB (Oriental Motor USA Corp., Torrance, CA, USA). These motors are connected to a stage holding the transparent cuvette containing the sample. The excitation light generated by two lasers is focused at the volume of observation. The excitation focus is positioned inside the cuvette and relatively close to the wall of the cuvette, at a distance of about 1 mm (figure 2(a)). This distance can be adjusted so that particles detection and analysis could be done even in highly scattering media.
Figure 2.
Generation of the scanned volume in the setup. (a) As the cuvette is rotated and translated, the observation volume, kept at distance R from the rotation axis, scans a helicoid pattern. (b) The static observation volume is estimated using a 3D Gaussian PSF with dimensions wx, wy and wz. The scanned volume per unit time is estimated multiplying the cross-section and the velocity v in the×direction.
The excitation sources are a diode laser emitting at 469nm (ISS, Champaign, IL, USA) and a laser pointer emitting at 532 nm (Aquaplan, Busto Arsizio, Italy). When a particle is in the volume of excitation, it fluoresces. Use of a confocal microscope in combination with a simple mechanical motion of the sample container in front of the objective provides a means for transporting the sample containing particles through an observation region without requiring complex optical system comprising moveable optical components, such as translating optical sources, mirrors or photodetectors. The excitation light from the two lasers is combined in one path through a set of dichroic filters ZT532nbdc and Z470rdc (Chroma Technology Corporation, Rockingham, VT, USA) and directed through a 20x 0.4 NA air objective (Newport, Newport Beach, CA, USA) to the same volume of excitation.
Fluorescence emitted from the sample is collected by the same objective, transmitted through the set of dichroic filters, focused by a lens into a large pinhole (diameter=2mm) and then collimated by a second lens to the detectors. A dichroic beam splitter T550lpxr-25mmNR (Chroma Technology Corporation, Rockingham, VT, USA) separates the emission in two light paths prior to its detection by two photomultiplier tubes (PMT) (Hamamatsu HC120-08, Hamamatsu, Japan). Two emission filters (FF01-HQ 500/24-25 and LP5600) (Semrock, Rochester, NY, USA) are located in front of each PMT. The signal from the PMT is sent to the Analog to Digital Converter (ADC) and to the acquisition card (IOTech, Cleveland, OH, USA). The sampling frequency was set to 100,000Hz, corresponding to a time resolution of 10µs.
The confocal aperture provided between the sample and photodetectors ensures that only fluorescence originating from the observation volume is detected by the PMTs. The photodetectors measure the fluorescence signal originating from the observation volume and generate a temporal profile of the fluorescence. Given the typical size of the observation volume (w~10µm), it’s clear that diffusion alone is not sufficient to generate fluctuations on a short time scale. For instance a particle with a diffusion coefficient D~0.1µm2/s will take hundreds of seconds to diffuse across the detection volume. The rotational motion of the cuvette is used to transport the particles across the observation volume and generate the temporal fluctuations in the intensity on a much faster time scale (typically hundreds of microseconds). The vertical motion ensures that we explore different regions inside the cuvette by scanning along the y direction.
The total volume analyzed is proportional to the total sample scanning period and depends on the rotational velocity of the cuvette and size of the observation volume. In our device the total volume explored during the scanning period can be in principle as high as 1ml/min by proper adjustment of the setup parameters.
The estimated volume of the Point Spread Function (PSF) in the confocal microscope can be defined by the expression:
| (1) |
Where we have assumed a Gaussian shape of the PSF and wx, wy and wz are the dimensions of the PSF along the x, y and z direction respectively (see figure 2)
The observation volume is scanned at a velocity v given by:
| (2) |
Wherein R is the distance of the observation volume from the rotation axis (equal to about half the cuvette size) and f is the rotational frequency of the cuvette. The total length L of the trajectory for a movement involving both rotation and vertical inversion can be calculated using the expression:
| (3) |
Wherein t is the sample scanning period.
The total volume (V) explored during a sample scanning period is provided by the expression:
| (4) |
Where we have taken into account the area of the cross section (A=π wywz/2) of the observation volume orthogonal to the direction of motion. In a typical configuration of our apparatus, for a scanning period of 60 sec, a cuvette diameter of 1 cm, a frequency of 5 revolutions per second, and dimensions of the observation volume wy~10um and wz~500um, we obtain a total volume of observation of about V~0.1ml/min.
2.2. From molecular FCS to large volume scanning
The basis for single molecule detection in FCS is that most of the time the observation volume is free of fluorescent particles and only noise is recorded, but when a particles moves into the observation volume it emits a burst of fluorescence photons. These bursts can be identified by autocorrelation of the time series. In the FCS method, one extracts information about the sample by analyzing the fluorescence signal fluctuations arising from a microscopic sub-volume. Random fluctuations of fluorescence intensity from single molecules provide information on important molecular proprieties such as translational and rotational diffusion or chemical kinetics (Magde et al., 1974)
The signal I(t) generated by particles traversing the observation volume will fluctuate around a mean value. The autocorrelation function (ACF) is defined as:
| (5) |
The functional form of G(τ) depends on the specific kind of motion of the particles. The autocorrelation curve for the particles in our system is expected to contain both a flow and a diffusion component:
| (6) |
In this equation the first term is due to a flow along the x direction characterized by a velocity v given by equation (2) and a second term is due to random motion with diffusion constant D. We have ignored the diffusion component along z, assuming that . For large enough values of the rotational frequency the flow term is predominant over the diffusion term, which becomes relevant only for very slow motion of the cuvette.
In a typical FCS experiment, the amplitude of the fluctuations G(0) is inversely proportional to the number of particles in the observation volume, and therefore to the concentration of particles in the sample:
| (7) |
Where γ is a dimensionless shape factor which depends only on the functional form of the excitation profile (Berland et al., 1996). For our setup, correlated noise inherent in the mechanical scanning device was an obstacle and prevented us from using the autocorrelation function for particle-counting purposes (i.e. using equation (7)). Indeed, in the limit of very low concentrations, where fluctuations due to the particles may be only a few, the value of G(0) is affected by fluctuations due to mechanical scanning, so that conventional FCS cannot be applied to very dilute samples, i.e. samples with concentration of fluorescent particles well below the picomolar range. In our sample the particles exhibit a very bright fluorescence, much brighter than normally dealt with in conventional FCS experiment, and the presence of the particle in the laser focus was very rare.
To apply the principles of scanning FCS in our setup we employ a different data analysis technique that would provide for a much better way of discriminate the passage of a particle from the noises in the system. Examples of noise in the system are the intensity fluctuations that arise from mechanical scanning or from fluorescent impurities in the cuvette glass. In this technique we make specific use of the shape of the burst and we exploit the relatively large brightness of the particle in relation to the quasi constant fluorescence background. If we know the shape of the fluorescence burst we can analyze the fluorescence for the presence of specific burst patterns to identify the passage of a particle in the volume of excitation. Combination of the large volume of exploration, the regular motion of the sample and the pattern recognition algorithm, results in the sensitive detection of a small number of particles in a relatively large volume.
2.3. Data acquisition and processing
In order to extract the measurement of the concentration and/or brightness of the particles in the sample, the temporal profile generated by the photodetectors has been analyzed with a pattern recognition filter implemented in the software SimFCS (Laboratory for Fluorescence Dynamics, Irvine, CA, available at http://www.lfd.uci.edu/globals/). This pattern recognition program analyzes the temporal profile of the digitized signal from the two detectors. The pattern recognition algorithm matches features in the temporal profile to a predetermined pattern that is characteristic of the time-dependent fluorescence intensity of particles passing through the observation volume.
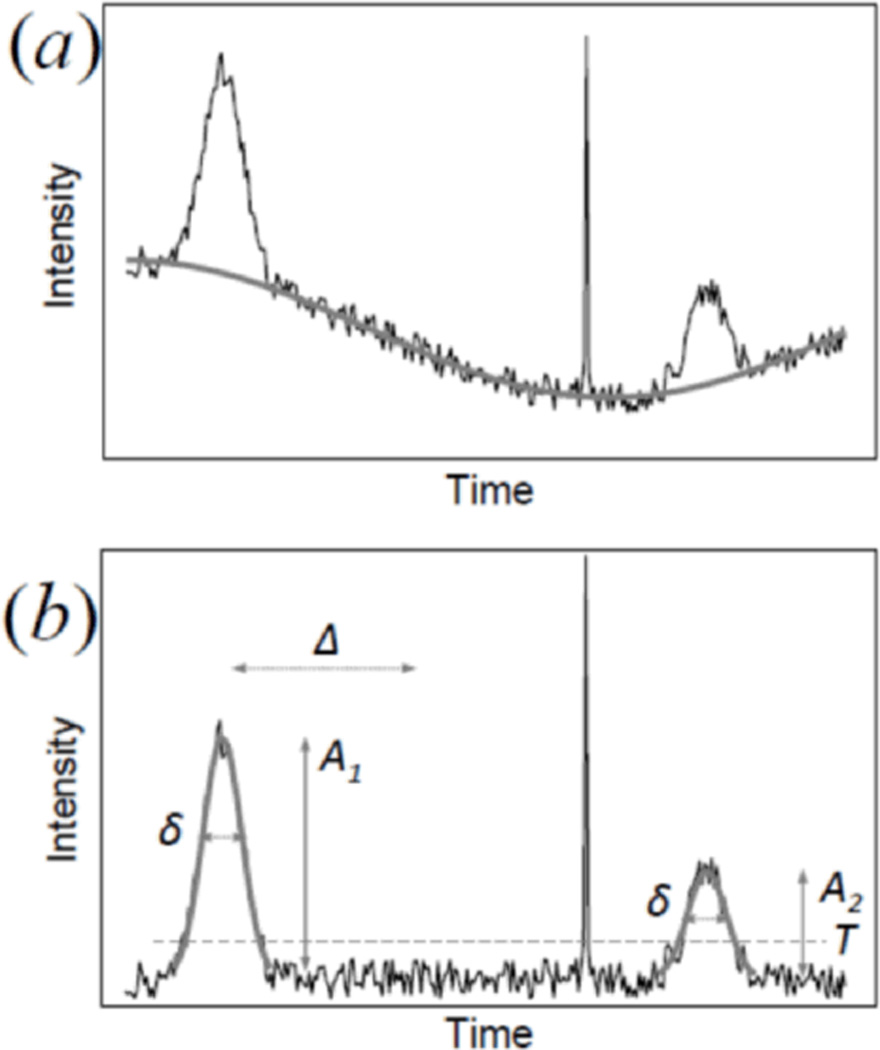
The predetermined patterns used in the recognition algorithm include distributions (e.g. Gaussian) of intensities as a function of time, which may be determined empirically taking into account the shape of the PSF of the optical setup, the speed of the particle, and the rate of signal sampling. Discrete particle detection events are identified by establishing a match between the amplitude and shape of a feature in the temporal profile and the predetermined pattern. The number of detected particles is determined by calculating the number of predetermined patterns matched to features in the temporal profile for a given sample scanning period. The operation principle of the pattern recognition algorithm is shown schematically in figure 3.
Figure 3.
Principle of the pattern recognition algorithm. (a) The slowly varying background level is determined performing a moving average of the intensity signal and subtracted. (b) At each point of the time series a fit to a pattern of predetermined shape is performed. When the Chi square of the fit is below a preset value and the amplitude of the fitted pattern is above a given threshold T, a hit is counted. After a hit, a number of points Δ must be skipped to ensure a peak is not counted twice. Then analysis of the time series continues until another hit is detected. Detected peaks share the same width δ but can have different amplitudes A1 and A2. A spike of large amplitude as shown in the figure is not counted because it has a shape different from the characteristic shape of the particles.
The algorithm proceeds first by subtracting the background level which generally is not constant due to the noise inherent in the mechanical scanning. The local background level is determined performing a moving average of the intensity signal which removes only the high frequency fluctuations but preserves the low frequency variations in the baseline (figure 3(a)). After background subtraction, the filter algorithm scans the signal performing a least square calculation at each point of the file representing the fluorescence detected as a function of time. The program calculates the best amplitude A of the filter that minimizes the local Chi square, the intensity amplitude not being restricted. The Chi square is calculated by weighting the difference between the raw data and the fit to the predetermined pattern with the sum of i) a noise level specified by the user σ n and ii) an estimate of the standard deviation σ d that accounts for the square root of the number of counts at the particular point of the file:
| (8) |
Whenever the Chi square is below a given value and the amplitude is above a given threshold value T, one hit is counted in that channel (figure 3(b)). After a hit has been detected, the software skips a given number of points Δ in the file in order to count each peak only once, then it scans again until the next match. Spikes are rejected because they are too narrow with respect to the filter, even if their intensity is above the threshold T. Note that the shape of the filter is kept constant while the amplitude value can be different between different hits.
For the enumeration of coincidence hits, the algorithm examines one channel first and then the trace of the other channel. If there is a peak at the same time where a hit has been found in the first channel, one coincident hit is counted. The threshold value can be set independently for the peak amplitude in both channels, in order to reject the noise in each channel or for instance to discard false coincidences due to bleed-through effects.
One advantage of using a predetermined pattern is that it’s not dependent on particles composition or the composition of the medium the particles are dispersed in. The use of pattern recognition in a two channels setup is advantageous in preventing detection of false hits originating from noise or spikes since only particles generating a cross-correlated intensity profile are detected.
Concentration for particles detected in each channel or in both channels are extracted from the analyzed temporal profile by dividing the number of matches by the volume V of the sample analyzed during a selected sample scanning period, which can be accurately calculated with knowledge of the size of the observation volume, rate of movement of the cuvette (rotational) and the duration of the sample scanning period, using equation (3) and (4). The size of the observation volume is controlled by the size of the confocal aperture employed in the confocal microscope.
2.4. Reagent and Chemicals
The membrane-permeable nucleic acid stains Syto9 and Syto25 were purchased from Molecular Probes (Eugene, OR). They have different spectral characteristics and both stain all cells. Syto9 excitation and emission peaks are λex=485nm and λem=498nm respectively, whereas Syto25 excitation and emission peaks are λex=521nm and λem=556nm respectively.
E. Coli MG1655 bacteria were grown over night in 5 ml of Luria Broth (LB) at a temperature of 37°C in an incubator shaker I2400 (New Brunswick Scientific Inc., Enfield, CT, USA). A PBS buffer solution (Life Technologies, Carlsbad, CA, USA) was used for sample dilutions. Petri plates were used to determine the concentration of bacteria by conventional plate-counting method. The concentration of bacteria is expressed in colony-forming units (CFU). This is a measure of the number of viable cells in a culture, capable of producing new colonies when seeded on the plates. Petri Plates were prepared using LB powder and agar powder.
Glass cuvettes 1 cm in diameter from Abbot (Abbott Park, IL, USA) were used to hold the sample. Yellow-Green and Nile-Red fluorescent microspheres (1 µm size) were purchased from Invitrogen (Carlsbad, CA, USA) to calibrate the instrument. Suspensions of fluorescent beads in water at different concentrations were prepared according to manufacturer’s instructions. Suspensions of fluorescent beads in highly scattering media were prepared using a solution of Intralipid (Intralipid 20%, Fresenius Kabi, Uppsala, Sweden) at a final concentration of 0.2%.
2.5. Fluorescence staining of bacteria cells
All experiments were performed using the E. Coli strain MG1655. Cells were rod shaped and between 0.7 and 1.5 um long. A glycerol stock was used to prepare our samples. The exponential bacteria growth was performed overnight at 37°C. A bacteria suspension was prepared at a starting concentration corresponding to a value OD600 = 0.4, as measured by a spectrophotometer (Perkin-Elmer Lambda 40, Waltham, MA, USA). The bacteria were centrifuged for 10 minutes at 5000 rpm and then resuspended in phosphate buffered saline (PBS). An aliquot of the bacteria suspension (100µl) was then added to 3ml of a PBS solution of the dyes Syto9 and Syto25 at a concentration of 1.5 µM each. Sample was vortexed and incubated for 30 min in the dark at room temperature (~25°C) before measurement. We chose this incubation time because the number of total Syto-stained cells is not expected to increase after 30 min incubation (Khan et al.)
After measurement with our setup, 1 ml of a dilution 1:10, 1:100, 1:1000, 1:10000 of our solution was plated on LB agar dishes antibiotic free. After 24 h the colonies on the plates were counted and the concentration was determined. The concentration derived from the counting of the colonies was then compared with the one obtained from the measurement with our device using the same sample.
3. Results and discussion
Before performing dual channel measurements to detect low concentration of bacteria, the detection capabilities of the device on both channels independently were tested using fluorescent spheres of different colors. Suspensions of beads were prepared at different concentrations ranging from 105 beads/ml down to 10 beads/ml. To evaluate the effectiveness of the pattern recognition algorithms in detecting particles of size comparable to that of the bacteria, instrument calibration was performed using 1µm-diameter Yellow-Green (YG) and Nile-Red (NR) fluorescent beads. The NR and YG beads have been used for calibration of the red (Ch1) and green (Ch2) channel, respectively. NR beads were excited at 532nm whereas YG beads were excited at 469nm.
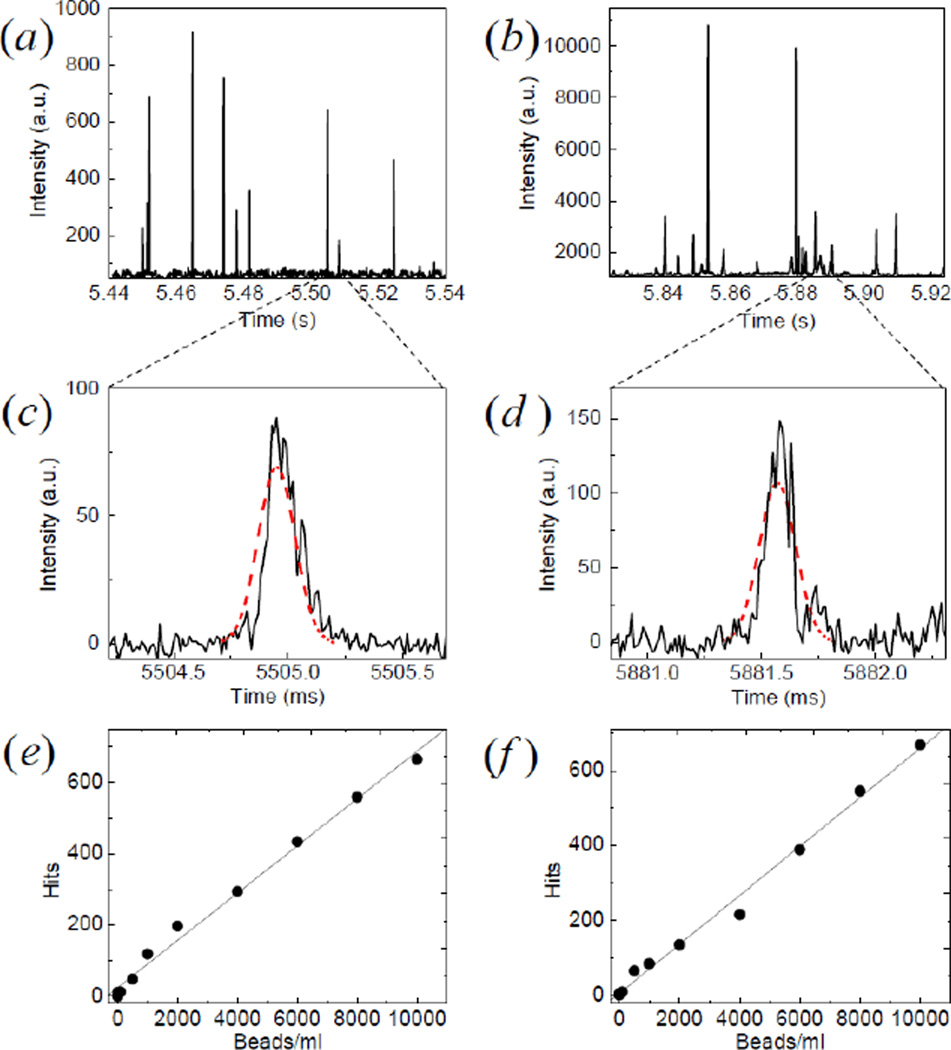
Figure 4 shows a typical time trace obtained from single channel measurements on NR (a) and YG (b) fluorescent beads at a concentration of 104/ml. The total scanning time was 1 min and the cuvette was rotated at a speed of 400 rpm while translated up and down at a speed of 10mm/sec. The bursts above the background level are due to particles passing through the observation volume and generating a characteristic intensity profile. In figure 4(c) and (d) we can show a detail of the temporal profiles in a region corresponding to a hit. The intensity profile is matched by the software to a predetermined Gaussian filter. The software allows to display individual matches.
Figure 4.
Calibration with fluorescent spheres. Typical intensity traces from NR (a and c) and YG (b and d) fluorescent beads. In the expanded regions (c and d) the intensity profile corresponding to the passage of a particle (solid) is compared with a Gaussian distribution of predetermined width (dashed). The number of hits registered during one scan is reported as a function of several concentrations of NR beads in Channel 1 (e) (linear fit: y=0.066x+24.3, R2=0.996) and YG beads in Channel 2 (f) (linear fit: y=0.065x+6.9, R2=0.992).
Figure 4 (e, f) shows the results of a concentration-dilution study obtained with the present device and employing pattern recognition data analysis. There is an excellent linear correlation between the total number of events as detected by the digital correlation filter and the actual concentration of fluorospheres in the sample for both channels. From the slope of the linear fit we get an effective scanned volume V=0.07ml.
After calibration with beads, the instrument was used to detect labeled bacteria at low concentration. E. Coli bacteria were fluorescently tagged with the nucleic acid probes Syto25 and Syto9 to be detected simultaneously in both channels. The actual concentration of bacteria in the sample was estimated independently through the standard plate counting method. The measurements were performed employing 1-minute scanning time, rotational frequency of 400 rpm and a vertical travel speed of 10mm/sec. Both channels were analyzed with the filter algorithm and the occurrence of coincident hits was quantified.
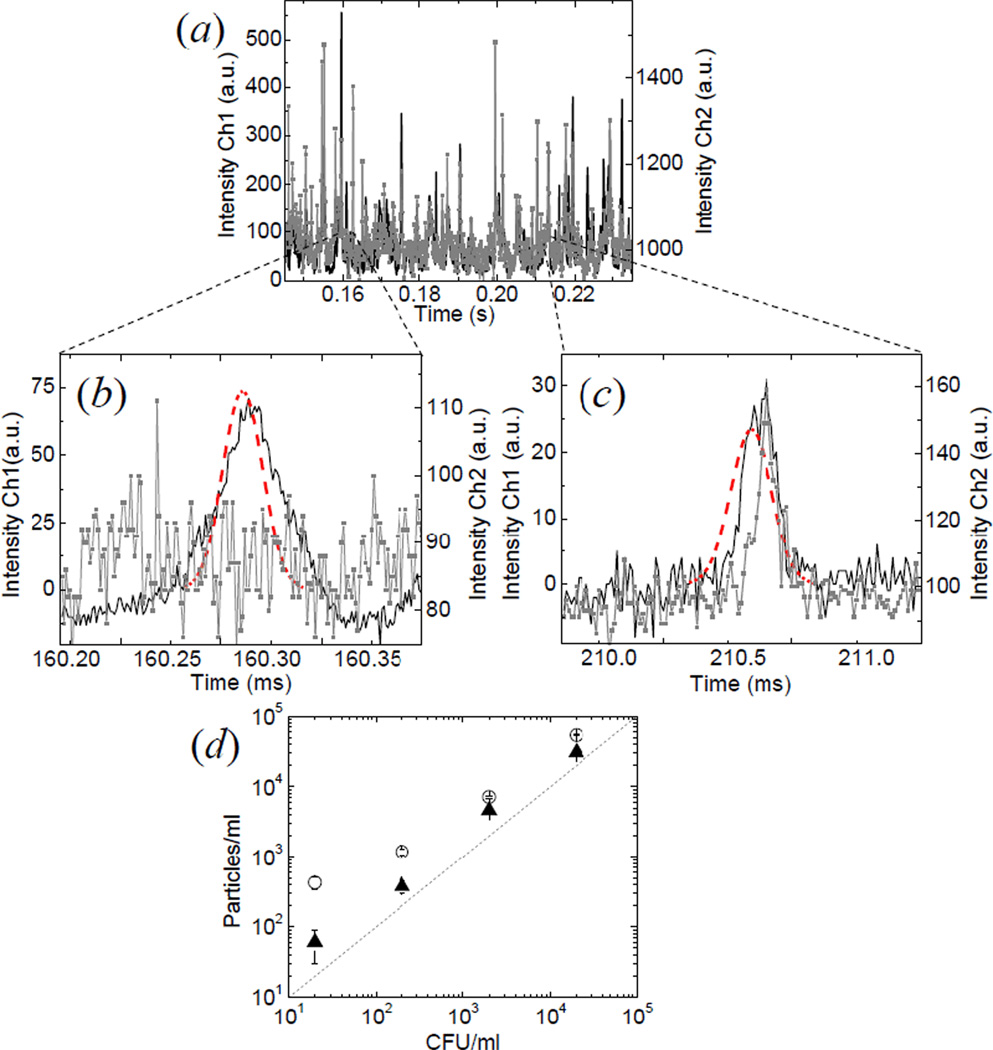
Representative data for detection of E. Coli in both channels are shown in figure 5(a). Bursts generated from bacteria crossing the observation volume are easily distinguished from the background in each channel. The software extracts the number of hits in each channel and the cross-correlated hits by examining the intensity trace in both channels using a predetermined Gaussian filter. Not every hit detected in one channel correspond to a cross-correlated hit in the other channel. One example of non-coincident hit is reported on figure 5(b), whereas figure 5(c) shows a detail of the overlapping temporal profiles in a region corresponding to a coincident hit.
Figure 5.
Dual channel detection of E. Coli bacteria stained with Syto25 and Syto9. (a) Intensity trace generated in channel 1 (solid) and channel 2 (solid with squares) by the passage of the fluorescent bacteria through the observation volume. In the expanded regions are reported the examples of a bacterium detected only in one channel (b) and a bacterium detected in both channels (c). (d) Concentration of fluorescent bacteria as determined by the single (circles) or dual (triangles) channel detection as a function of the concentration of viable bacteria determined by the colony counting method (CFU = colony forming units).
The number of detected particles has been converted into a value of concentration using the calibration factor obtained previously with the fluorescent spheres. As we decrease the concentration of bacteria in the suspension the instrument detects a linearly decreasing concentration of particles (figure 5(d)). The cross-correlated detection method yields values for the concentration of bacteria closer to the values of colony-forming units (CFU), especially at lower concentration values where the false hits due to noise become more relevant. The concentration of viable bacteria in the sample has been determined for the highest concentration (20,000 bacteria/ml) using the standard plate counting method. We can see a good linearity down to 20 CFU/ml and in particular at low concentrations. The staining protocol does not discriminate between dead and viable bacteria, so it is possible that we detect a higher concentration of particles with respect to the concentration of viable bacteria in the sample as determined from the enumeration of the colonies.
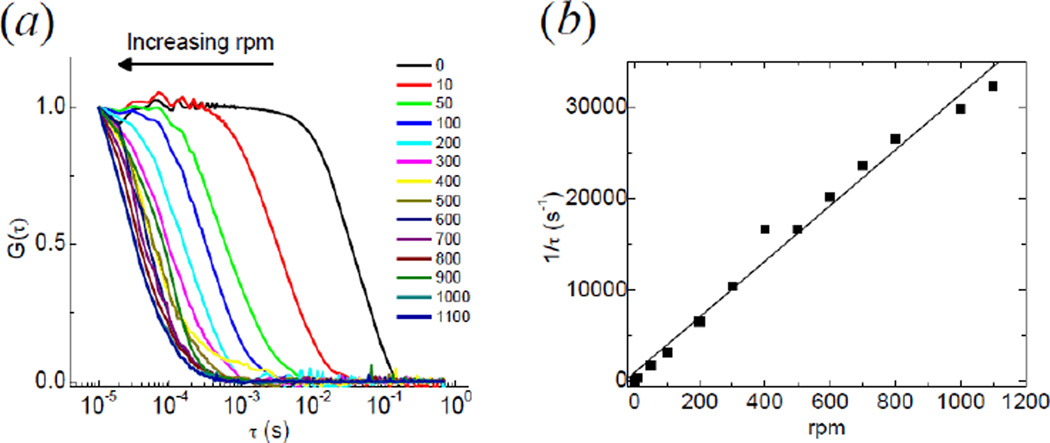
The width of the predetermined Gaussian distribution used by the filter algorithm should match the width of the intensity fluctuations generated by the passage of the particles. If we change the rotational frequency of the cuvettes we also change the velocity of the particles that are crossing the observation volume. In figure 6 we plotted the normalized autocorrelation curves of the intensity traces obtained measuring the same sample (20,000 bacteria/ml) at different values of the rotational speed of the cuvette. As we increase the rpm, the autocorrelation curve decays at a shorter time. Plotting the inverse of the characteristic time τ (determined as the value at which G(τ) =1/2) as a function of the rotational frequency confirms the linearity between 1/τ and f, as expected from equation (2) and (6) indicating that the fluctuations are mainly due to the ‘flow’ generated by the rotational motion and that the diffusion term can be neglected. From a linear fit of the data we find an effective size of the observation volume along the×direction, w0=16 µm. A smaller size of the PSF (down to 1µm) could be obtained in principle by expanding the beam before the back aperture of the objective. When the cuvette is not rotated we get a residual correlation (τ=33ms) which could be explained as arising from rare fluctuations due to bacteria crossing the observation volume while diffusing or settling down.
Figure 6.
Effect of the cuvette rotation on the characteristic time of transit through the observation volume. (a) The normalized intensity autocorrelation function shrinks toward shorter time as the value of the rotational frequency is increased. (b) The reciprocal of the characteristic time τ derived from the ACF is plotted as a function of the rpm. The straight line is a linear fit to the data.
The size of the PSF or observation volume VPSF can be modified (for instance using a different objective, varying the size of the beam at the back aperture of the objective or changing the size of the pinhole) in order to optimize the particle detection at different ranges of concentration. At very low concentrations, a too small PSF could be inconvenient due to the longer time needed to explore a relatively large portion V of the sample. In general, to increase the number of particles detected at any given concentration C during a given amount of time, we can increase the size of the PSF up to a point where saturation is reached because the condition of observing one particle at the time, C<<1/VPSF, is no more fulfilled. On the other hand, increasing the size of the confocal volume can limit the capability of detecting the particles due to an increasing level of background signal generated, for instance, by the presence of free dye in the sample. In order to discriminate the particles from the background and to achieve the same S/N ratio, the brightness of the particles needs to be larger for larger observation volumes. Therefore, for particles of given brightness and concentration, there must be a compromise between the increase in S/N ratio and increase on measuring speed that can be optimized by changing the size of the confocal volume.
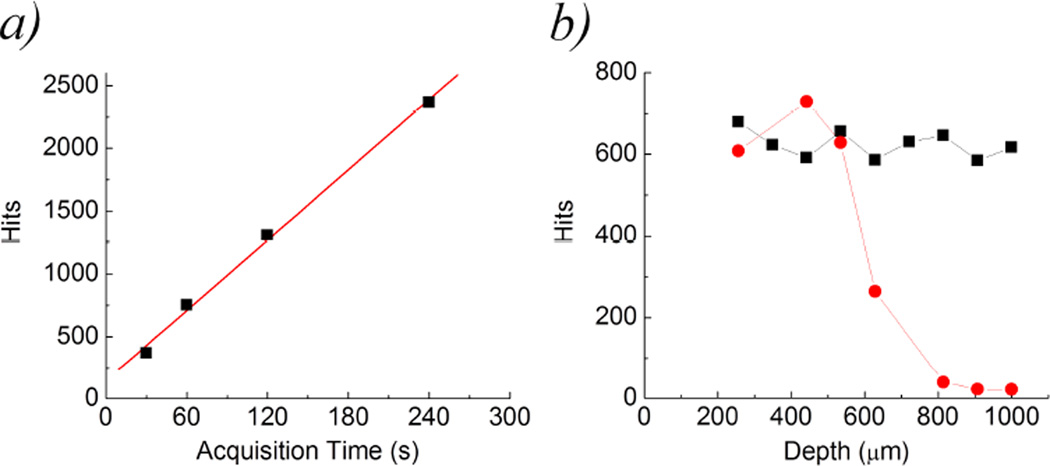
Another parameter that can be adjusted in order to increase the number of detected particles is the duration of the measurement. As shown in figure 7(a), the number of hits increases linearly with the acquisition time. Longer acquisition times are needed especially for samples of low concentration or for highly scattering samples in which detection can be more difficult. In the latter case particle detection can be optimized by changing the position of the focal spot inside the cuvette. For particles immersed in a scattering medium (water solution of Intralipid 0.2%) the number of hits decreases with increasing depth of the focal spot into the sample (figure 7(b)) whereas the number of hits in a transparent medium does not vary significantly. Thus, particle detection in highly scattering media is still possible provided that the focus is positioned closer to the wall of the cuvette.
Figure 7.
(a) For a given concentration of fluorescent microspheres (10000/ml in the example), the number of particles detected in the scanned volume (solid squares) increases linearly with the acquisition time. (b) Particle detection at different depths of the focal point with respect to the wall of the cuvette. For increasing depth the number of particles detectable in a highly scattering sample (red dots) is strongly reduced with respect to a transparent sample (black squares).
4. Conclusions
In this work we described a device capable of measuring very low concentrations of bacteria labeled with fluorescent probes. The rotational motion of a cuvette is used to make particles flow through a small observation volume. The small observation volume is obtained using laser excitation and confocal optics. The detection of the particles can be performed in one or two channels by analyzing the intensity profile generated by the passage of the particles.
We showed that through the use of a pattern recognition algorithm it is possible to filter and count the intensity fluctuations due to the bacteria passing through the confocal volume. The use of coincidence detection in two channels provides an additional filter to count only the fluctuations generated by bacteria labeled with both fluorescent probes.
The system is not limited to detection of bacteria and in principle can be applied to the detection of other kind of pathogens. In this sense we showed that the size of the observation volume can be adjusted in order to optimize the performance of the device for samples of different concentration and brightness. Given its portability, high sensitivity, speed and low cost, we suggest the use of this device for clinical applications and for water and air quality control.
Acknowledgments
This work was supported by National Institutes of Health grants: P41-RRO3155 and P50-GM076516. The authors thank Milka Stakic and Alex Dajkovic for helping in the preparation of bacteria samples, Mariagrazia Di Luca for helpful discussions. The authors also thank Alexander Dvornikov and Guido Motolese for kindly providing some of the optical components of the instrument.
References
- Ahn S, Walt DR. Detection of Salmonella spp. using microsphere-based, fiber-optic DNA microarrays. Anal Chem. 2005;77:5041–5047. doi: 10.1021/ac0505270. [DOI] [PubMed] [Google Scholar]
- Berland KM, So PT, Chen Y, Mantulin WW, Gratton E. Scanning two-photon fluctuation correlation spectroscopy: particle counting measurements for detection of molecular aggregation. Biophys J. 1996;71:410–420. doi: 10.1016/S0006-3495(96)79242-1. [DOI] [PMC free article] [PubMed] [Google Scholar]
- Busam S, McNabb M, Wackwitz A, Senevirathna W, Beggah S, Meer JR, Wells M, Breuer U, Harms H. Artificial neural network study of whole-cell bacterial bioreporter response determined using fluorescence flow cytometry. Anal Chem. 2007;79:9107–9114. doi: 10.1021/ac0713508. [DOI] [PubMed] [Google Scholar]
- Cho JC, Tiedje JM. Bacterial species determination from DNA-DNA hybridization by using genome fragments and DNA microarrays. Appl Environ Microbiol. 2001;67:3677–3682. doi: 10.1128/AEM.67.8.3677-3682.2001. [DOI] [PMC free article] [PubMed] [Google Scholar]
- Dudak FC, Boyaci IH. Rapid and label-free bacteria detection by surface plasmon resonance (SPR) biosensors. Biotechnol J. 2009;4:1003–1011. doi: 10.1002/biot.200800316. [DOI] [PubMed] [Google Scholar]
- Ferguson CM, Booth NA, Allan EJ. An ELISA for the detection of Bacillus subtilis L-form bacteria confirms their symbiosis in strawberry. Lett Appl Microbiol. 2000;31:390–394. doi: 10.1046/j.1472-765x.2000.00834.x. [DOI] [PubMed] [Google Scholar]
- Ferrari BC, Oregaard G, Sorensen SJ. Recovery of GFP-labeled bacteria for culturing and molecular analysis after cell sorting using a benchtop flow cytometer. Microb Ecol. 2004;48:239–245. doi: 10.1007/s00248-003-1069-9. [DOI] [PubMed] [Google Scholar]
- Gehring AG, Patterson DL, Tu SI. Use of a light-addressable potentiometric sensor for the detection of Escherichia coli O157:H7. Anal Biochem. 1998;258:293–298. doi: 10.1006/abio.1998.2597. [DOI] [PubMed] [Google Scholar]
- Gratton EMG, Tahari A. Methods and devices for characterizing particles in clear and turbid media. United States Patent number. 2009:7528384. [Google Scholar]
- Gu H, Ho PL, Tsang KW, Wang L, Xu B. Using biofunctional magnetic nanoparticles to capture vancomycin-resistant enterococci and other gram-positive bacteria at ultralow concentration. J Am Chem Soc. 2003;125:15702–15703. doi: 10.1021/ja0359310. [DOI] [PubMed] [Google Scholar]
- Hahn MA, Keng PC, Krauss TD. Flow cytometric analysis to detect pathogens in bacterial cell mixtures using semiconductor quantum dots. Anal Chem. 2008;80:864–872. doi: 10.1021/ac7018365. [DOI] [PubMed] [Google Scholar]
- Hibi K, Mitsubayashi K, Fukuda H, Ushio H, Hayashi T, Ren H, Endo H. Rapid direct determination using combined separation by prepared immunomagnetic and flow cytometry of Flavobacterium psychrophilum. Biosens Bioelectron. 2007;22:1916–1919. doi: 10.1016/j.bios.2006.08.016. [DOI] [PubMed] [Google Scholar]
- Holmes K, Lantz LM, Fowlkes BJ, Schmid I, Giorgi JV. Preparation of cells and reagents for flow cytometry. Curr Protoc Immunol. 2001;Chapter 5(Unit 5):3. doi: 10.1002/0471142735.im0503s44. [DOI] [PubMed] [Google Scholar]
- June CH, Moore JS. Measurement of intracellular ions by flow cytometry. Curr Protoc Immunol. 2004;Chapter 5(Unit 5) doi: 10.1002/0471142735.im0505s64. [DOI] [PubMed] [Google Scholar]
- Khan MM, Pyle BH. Camper A K Specific and rapid enumeration of viable but nonculturable and viable-culturable gram-negative bacteria by using flow cytometry. Appl Environ Microbiol. 76:5088–5096. doi: 10.1128/AEM.02932-09. [DOI] [PMC free article] [PubMed] [Google Scholar]
- Kim BC, Park JH, Gu MB. Multiple and simultaneous detection of specific bacteria in enriched bacterial communities using a DNA microarray chip with randomly generated genomic DNA probes. Anal Chem. 2005;77:2311–2317. doi: 10.1021/ac048703c. [DOI] [PubMed] [Google Scholar]
- Kramer M, Obermajer N, Bogovic Matijasic B, Rogelj I, Kmetec V. Quantification of live and dead probiotic bacteria in lyophilised product by real-time PCR and by flow cytometry. Appl Microbiol Biotechnol. 2009;84:1137–1147. doi: 10.1007/s00253-009-2068-7. [DOI] [PubMed] [Google Scholar]
- Liao WC, Ho JA. Attomole DNA electrochemical sensor for the detection of Escherichia coli O157. Anal Chem. 2009;81:2470–2476. doi: 10.1021/ac8020517. [DOI] [PubMed] [Google Scholar]
- Lu Q, Lin H, Ge S, Luo S, Cai Q, Grimes CA. Wireless, remote-query, and high sensitivity Escherichia coli O157:H7 biosensor based on the recognition action of concanavalin A. Anal Chem. 2009;81:5846–5850. doi: 10.1021/ac9008572. [DOI] [PMC free article] [PubMed] [Google Scholar]
- Maalouf R, Fournier-Wirth C, Coste J, Chebib H, Saikali Y, Vittori O, Errachid A, Cloarec JP, Martelet C, Jaffrezic-Renault N. Label-free detection of bacteria by electrochemical impedance spectroscopy: comparison to surface plasmon resonance. Anal Chem. 2007;79:4879–4886. doi: 10.1021/ac070085n. [DOI] [PubMed] [Google Scholar]
- Mafu AA, Pitre M, Sirois S. Real-time PCR as a tool for detection of pathogenic bacteria on contaminated food contact surfaces by using a single enrichment medium. J Food Prot. 2009;72:1310–1314. doi: 10.4315/0362-028x-72.6.1310. [DOI] [PubMed] [Google Scholar]
- Magde D, Elson EL, Webb WW. Fluorescence correlation spectroscopy. II. An experimental realization. Biopolymers. 1974;13:29–61. doi: 10.1002/bip.1974.360130103. [DOI] [PubMed] [Google Scholar]
- Malorny B, Lofstrom C, Wagner M, Kramer N, Hoorfar J. Enumeration of salmonella bacteria in food and feed samples by real-time PCR for quantitative microbial risk assessment. Appl Environ Microbiol. 2008;74:1299–1304. doi: 10.1128/AEM.02489-07. [DOI] [PMC free article] [PubMed] [Google Scholar]
- Moragues M, Comas-Riu J, Vives-Rego J. Rapid G+ count and subpopulation assessment of the intestinal bacteria in Apodemus sylvaticus and Mus musculus by flow cytometry. Folia Microbiol (Praha) 2004;49:587–590. doi: 10.1007/BF02931538. [DOI] [PubMed] [Google Scholar]
- Oh BK, Lee W, Chun BS, Bae YM, Lee WH, Choi JW. The fabrication of protein chip based on surface plasmon resonance for detection of pathogens. Biosens Bioelectron. 2005;20:1847–1850. doi: 10.1016/j.bios.2004.05.010. [DOI] [PubMed] [Google Scholar]
- Qin D, He X, Wang K, Tan W. Using fluorescent nanoparticles and SYBR Green I based two-color flow cytometry to determine Mycobacterium tuberculosis avoiding false positives. Biosens Bioelectron. 2008;24:626–631. doi: 10.1016/j.bios.2008.06.023. [DOI] [PubMed] [Google Scholar]
- Reynolds DT, Fricker CR. Application of laser scanning for the rapid and automated detection of bacteria in water samples. J Appl Microbiol. 1999;86:785–795. doi: 10.1046/j.1365-2672.1999.00721.x. [DOI] [PubMed] [Google Scholar]
- Sakamoto C, Yamaguchi N, Yamada M, Nagase H, Seki M, Nasu M. Rapid quantification of bacterial cells in potable water using a simplified microfluidic device. J Microbiol Methods. 2007;68:643–647. doi: 10.1016/j.mimet.2006.11.003. [DOI] [PubMed] [Google Scholar]
- Steen HB. Flow cytometry of bacteria: glimpses from the past with a view to the future. J Microbiol Methods. 2000;42:65–74. doi: 10.1016/s0167-7012(00)00177-9. [DOI] [PubMed] [Google Scholar]
- Tamminen M, Joutsjoki T, Sjoblom M, Joutsen M, Palva A, Ryhanen EL, Joutsjoki V. Screening of lactic acid bacteria from fermented vegetables by carbohydrate profiling and PCR-ELISA. Lett Appl Microbiol. 2004;39:439–444. doi: 10.1111/j.1472-765X.2004.01607.x. [DOI] [PubMed] [Google Scholar]
- Wong YY, Ng SP, Ng MH, Si SH, Yao SZ, Fung YS. Immunosensor for the differentiation and detection of Salmonella species based on a quartz crystal microbalance. Biosens Bioelectron. 2002;17:676–684. doi: 10.1016/s0956-5663(02)00030-1. [DOI] [PubMed] [Google Scholar]
- Yang L, Wu L, Zhu S, Long Y, Hang W, Yan X. Rapid, absolute, and simultaneous quantification of specific pathogenic strain and total bacterial cells using an ultrasensitive dual-color flow cytometer. Anal Chem. 2010;82:1109–1116. doi: 10.1021/ac902524a. [DOI] [PubMed] [Google Scholar]


