

Abstract
Capillary zone electrophoresis (CZE)-electrospray ionization-tandem mass spectrometry (ESI-MS/MS) was applied for rapid top-down intact protein characterization. A mixture containing four model proteins (cytochrome c, myoglobin, bovine serum albumin (BSA) and beta casein) was used as the sample. The CZE-ESI-MS system was first evaluated with the mixture. The four model proteins and five impurities were baseline separated within 12 min. The limits of detection (s/n = 3) of the four model proteins ranged from 20 amole (cytochrome c) to 800 amole (BSA). The relative standard deviations of migration time and intensity for the four model proteins were less than 3% and 30%, respectively, in quintuplicate runs. CZE-ESI-MS/MS was then applied for top-down characterization of the mixture. Three of the model proteins (all except BSA) and an impurity (bovine transthyretin) were confidently identified by database searching of the acquired tandem spectra from protein fragmentation. Modifications including phosphorylation, N-terminal acetylation, and heme group binding were identified.
Keywords: CZE-ESI-MS/MS, top-down, intact protein, throughput, sensitivity, reproducibility
Introduction
Top-down proteomics is a valuable technique that directly analyzes intact proteins [1, 2]. Top-down proteomics has distinct advantages for characterizing protein isomers and for providing a detailed map of protein post-translational modifications compared with the widely used bottom-up approach [3].
McLafferty’s group published several pioneering reports on the use of highresolution Fourier transform ion cyclotron resonance (FTICR) mass spectrometry for top-down protein analysis [4–6]. Since that early work, there have been significant advances in analysis of protein isomers, identification of post-translational modifications, characterization of components within protein complexes, and comprehensive analysis of complex protein samples [7]. For example, Han et al. identified disulfide bonds and obtained accurate sequence prediction for proteins with masses greater than 200 kDa [8]. In another example, Tran et al. applied a three-stage protein separation system for large-scale top-down proteomics analysis of a human cell lysate; this analysis identified 1,043 gene products and more than 3,000 protein species produced by post-translational modifications, alternative RNA splice forms, and proteolysis [9].
Many challenges remain for top-down proteomics. Perhaps most importantly, one of them is lack of high resolution protein separation techniques that is applicable to a wide range of proteins. Usually, reversed-phase liquid chromatography (RPLC) is directly coupled to tandem MS for top-down proteomics analysis. Unfortunately, the protein separation capacity of RPLC is not as high as peptide separation, and protein separations often results in very broad protein peaks, typically several minutes, especially for large proteins (molecular weight > 30 kDa). Often, 60 or fewer proteins are detected in a single run [10–14]. In addition, it is difficult to completely elute proteins from the reversed-phase stationary phase, which results in limited lifetime of the RPLC column, especially for membrane proteins analysis. Therefore, development of alternative protein separation techniques with high efficiency is important and necessary for top-down proteomics.
Capillary electrophoresis (CE) can produce high efficiency for protein separation [15], and CE-MS has been widely used for intact proteins analysis [16]. As an example, Smith’s group combined capillary isoelectric focusing (cIEF) and FTICR mass spectrometry for measurements of the Escherichia coli proteome, and 400–1000 putative proteins were detected in a single-run from the total injection of ~300 ng sample [17]. However, performing cIEF requires several manipulations that make its automation difficult. Furthermore, the ampholytes used for CIEF can produce interference, significant ion suppression, and mass spectrometer contamination, which limit its application for protein analysis. Capillary zone electrophoresis (CZE) is the simplest mode of CE, and CZE-MS has proven to be a valuable tool for protein characterization [18–21]. For example, Haselberg et al. coupled CZE to time-of-flight MS via a sheathless electrospray ionization (ESI) interface for the characterization of pharmaceutical glycoproteins. 18 glycoforms of the recombinant human interferon-β and 74 glycoforms of the recombinant human erythropoietin were detected [21].
The performance of CZE-MS is often dominated by the electrospray interface. The interfaces can be divided into sheath-flow and sheathless designs [22]. Haselberg et al. [20, 21] applied the porous capillary tip based sheathless CE-MS interface [23, 24] to couple CZE with ESI-MS for protein separation and detection. Highly reproducible and efficient separation of four model proteins was obtained with the CZE-MS system, and the protein detection limits were improved by 50-fold to 140-fold compared to that from a sheath-flow interface [20]. They also applied the CZE-ESI-MS system for glycoform profiling of intact pharmaceutical glycoproteins, and 74 glycoforms of recombinant human erythropoietin were resolved in a 60-min run [21]. Recently, our group developed an electrokinetically pumped sheath-flow electrospray CE-MS interface that has several advantages compared with the traditional sheath-flow interface, including reduced sample dilution due to a very low flow rate of sheath liquid generated by electrokinetic forces, elimination of mechanical pumps, and stable operation in the nanospray regime [25]. We applied the electrokinetically pumped sheath-flow interface based CZE-ESI-MS/MS system for highly sensitive and comprehensive bottom-up proteomics analyses [26–30]. These results demonstrated low amole peptide detection limit [26, 28] and we identified 1,250 E. coli peptides in a single 50 min run with an LTQ-Orbitrap Velos mass spectrometer [30].
In this report, we apply the electrokinetically pumped sheath-flow electrospray interface based CZE-ESI-MS/MS system for rapid separation and top-down identification via database searching of intact proteins. The first publication of CZE-ESI-MS/MS based top-down protein characterization is from McLafferty group in 1996 [18]. That publication reported the identification of attomole amount of carbonic anhydrase via database searching of MS/MS spectra; the migration time of the protein was less than 2 min. However, the lifetime of the separation capillary integrated with a gold-coated spray tip was roughly 1 h. The very special design of their system was not easily transferred to other laboratories, which has limited its application.
In this work, we coupled CZE to an LTQ-Orbitrap Velos via the electrokinetically pumped sheath-flow electrospray interface. Four model proteins (Cytochrome c, myoglobin, beta-casein and bovine serum albumin) with molecular weight ranged from ~12 kDa to ~66 kDa were used to evaluate the performance of the CZE-ESI-MS/MS system. We first evaluated the sensitivity and reproducibility of the CZE-ESI-MS system for intact protein separation and detection. We then applied the CZE-ESI-MS/MS system for top-down intact protein characterization. Higher energy collisional dissociation (HCD) was applied for fragmentation of the separated intact proteins, and database searching of the acquired MS/MS spectra was performed for protein identification.
Experimental section
Materials and reagents
Bovine serum albumin (BSA), bovine heart cytochrome c (cyto.c), equine myoglobin (myo), bovine beta-casein, urea, ammonium bicarbonate (NH4HCO3), dithiothreitol (DTT), and iodoacetamide (IAA) were purchased from Sigma–Aldrich (St. Louis, MO). Acetonitrile (ACN) and formic acid (FA) were purchased from Fisher Scientific (Pittsburgh, PA). Methanol was purchased from Honeywell Burdick & Jackson (Wicklow, IE). Water was deionized by a Nano Pure system from Thermo Scientific (Marietta, OH). Linear polyacrylamide (LPA)-coated fused capillary (50 μm i.d. × 150 μm o.d.) were purchased from Polymicro Technologies (Phoenix, AZ).
Sample preparation
A four-protein mixture containing BSA (0.8 mg/mL), cyto.c (0.05 mg/mL), myo (0.05 mg/mL), and beta casein (0.2 mg/mL) were dissolved in 0.1% FA. Then, 70 μL of the protein mixture was mixed with 30 μL ACN, followed by CZE-ESI-MS and MS/MS analysis.
The four-protein mixture (200 μL) was prepared in 8 M urea and 100 mM NH4HCO3 (pH 8.0). This mixture was denatured at 37oC for 30 min, followed by reduction in 8 mM DTT at 37oC for 30 min, and alkylation in 20 mM IAA at room temperature for 20 min in the dark. Next, the protein mixture was desalted, lyophilized, and redissolved in 200 μL of 0.1% FA solution. Finally, 70 μL of the treated protein mixture was mixed with 30 μL ACN, followed by CZE-ESI-MS analysis.
CZE-ESI-MS and MS/MS analysis
CZE was coupled to an LTQ-Orbitrap Velos via an electrokinetically pumped sheath-flow electrospray interface [25] for protein separation and identification. A 40-cm long LPA-coated fused capillary (50 μm i.d. × 150 μm o.d.) was used to reduce protein adsorption. The separation buffer was 0.1% (v/v) FA. The electrospray sheath liquid was 10% (v/v) methanol and 0.1% (v/v) FA. ~14 nL of the protein sample was injected into the separation capillary by pressure, followed by the CZE separation. Fig. 1 provides a diagram of the procedure. The voltage applied at the injection end of the capillary (HV I) was 17.8 kV, and the voltage applied for electrospray (HV II) was 1.8 kV. The separated proteins were electrosprayed, and then analyzed by the Orbitrap with resolution 100,000 (m/z 400), generating MS1 protein spectra. For CZE-ESI-MS analysis, no tandem spectra were acquired.
Figure 1.

Schematic diagram of the experimental design.
For CZE-MS/MS analysis, the highest intensity peak in the MS1 spectra was isolated, fragmented in the HCD cell, and detected in the Orbitrap, generating protein fragmentation spectra (MS2).
Mass spectrometer operating parameters
The LTQ-Orbitrap Velos was operated with the S-lens RF level set at 60%, and the ion transfer tube temperature set at 300oC. The source fragmentation voltage was 15V.A data dependent acquisition method was programmed for the protein fragmentation experiment. Full MS scans were acquired in the Orbitrap mass analyzer over the m/z 600–2,000 range with resolution 100,000 (m/z 400). The two most intense peaks with charge state ≥ 4 were selected with isolation width as 100 m/z, followed by fragmentation in the HCD cell with normalized collision energy as 20% or 35%, and detection in the Orbitrap with resolution 30,000 (m/z 400). The target values for MS and MS/MS acquisition were 1.00E+06 and 2.00E+05, respectively, and one microscan was used. The maximum injection time for MS and MS/MS was 500 ms and 250 ms, respectively. The peaks selected for fragmentation more than once during 15 s were excluded from selection for 15 s.
Data analysis
The tandem spectra were decharged and deisotoped by MS-Deconv (version 0.8.0.7370), followed by database searching with MS-Align+ software (version 0.7.1.7143) [31]. Briefly, raw files from Orbitrap Velos were first converted to mzXML files with ReAdW (version 4.3.1). Then, MS-Deconv (v 0.8.0.7370) was used to generate msalign files with mzXML files as the input. Finally, the MS-Align+ software (http://bix.ucsd.edu/projects/msalign/) was used for database searching with msalign files as the input. A custom database including three model proteins (cyto.c, myo and beta casein) and a potential impurity (bovine transthyretin) was used for database searching. Because the accurate mass of the 66 kDa BSA could not be determined by the Orbitrap with 100,000 resolution in this work, the BSA sequence was not included in the database. The parameters for database searching included maximum number of modifications (shift number) as 2, mass error tolerance as 17 ppm, “doOneDaltonCorrection” and “doChargeCorrection” as false, “cutoffType” as EVALUE and cutoff as 0.01. Because only four protein entries were included in the database, the protein scores were not representative. Matched fragment ions with mass error less than 15 ppm were considered as positive hits. For protein identification, at least 10 matched fragment ions with mass error less than 10 ppm were required.
Results and discussion
Evaluation of the performance of the CZE-ESI-MS system for native protein separation and detection
We chose four model proteins (cyto.c, myo, BSA, and beta casein) to evaluate the performance of the CZE-ESI-MS system for native protein analysis. The Mw of these proteins ranged from 12 kDa to 66 kDa. We analyzed a protein mixture in 30% (v/v) ACN and 0.07% (v/v) FA containing the four model proteins at concentrations of 0.56 mg/mL (BSA), 0.035 mg/mL (cyto.c), 0.035 mg/mL (myo) and 0.14 mg/mL (beta casein), Fig. 2, corresponding to loading amounts of 40 (cyto.c), 29 (myo), 82 (beta casein) and 120 fmole (BSA). The four model proteins and five impurities (i–v) were baseline separated in 12 min and the separation window was about 7 min. The signal to noise ratio (S/N) of the protein peaks was calculated by Xcalibur software (version 2.2) from Thermo Scientific, and manual noise region was set as 0–2 min.
Figure 2.

Base peak electropherogram of four standard proteins analyzed by the CZE-ESI-MS system.
The calculated limits of detection (S/N = 3) were 20 amole (cyto.c), 100 amole (myo), 200 amole (beta casein), and 800 amole (BSA). The peak widths at half peak height of these proteins were 8–15 s except for beta casein, which generated a 26 s wide peak. Peak efficiency ranged from ~2,000 (BSA) to ~10,000 (myo and impurity ii) theoretical plates, Table 1. The peak efficiency is likely limited by the relatively large injection volume. The effects of high injection volume are partially reduced by preparation of the protein sample in 30% (v/v) ACN and 0.07% (v/v) FA. The conductivity of this buffer is lower than that of the separation buffer (0.1% FA), which led to sample stacking at the beginning of the separation [30, 32, 33]. Also, the hydrophilic LPA coating reduced interaction between the protein and inner wall of the fused capillary, which again reduced peak broadening.
Table 1.
Characterization of proteins analyzed with the CZE-ESI-MS system.
| Theoretical mass (Da) | Observed mass (Da) | Mass error (Da) | Loaded amount (fmole) | Peak width (s) (50% peak height)a | Number of theoretical plates (N)b | |
|---|---|---|---|---|---|---|
| Cyto.c | 12223.21 | 12222.16 | –1.046# | 40 | 9 | 4200 |
| Myo | 16940.96c | 16940.98 | 0.02 | 29 | 8 | 9020 |
| Beta casein | 23968.22 | 23967.14d | –1.08# | 82 | 26 | 2897 |
| BSA | 66355.59e | – | – | 120 | 15 | 2025 |
| impurity if | – | 11999.180g | – | – | 10 | 8246 |
| impurity ii | – | 13669.825 | – | – | 10 | 9941 |
| impurity iii | – | 13582.847 | – | – | 12 | 7421 |
| impurity iv | – | 18994.572 | – | – | 12 | 8340 |
| impurity v | – | 19941.752 | – | – | 16 | 5510 |
Mass error of 1 Da can be attributed to the peak extraction errors.
The peak width was calculated based on the electropherogram in Figure 2.
The number of theoretical plates (N) was calculated based on the half peak height from Figure 2, and the migration time of the proteins for calculation of N was also from Figure 2.
The theoretical mass of myoglobin does not include the heme group.
The observed mass of beta casein is based on beta casein peak a in Figure 2.
The theoretical mass of BSA was calculated with Compute pI/Mw software (http://web.expasy.org/compute_pi/) based on the sequence of mature BSA and the 17 disulfide bonds were also considered.
The corresponding peaks of all the five impurities were labeled in Figure 2.
The observed mass of five impurities was manually calculated based on the obtained protein mass spectra, so the mass error might be on several Dalton level due to the potential error from manual recognition of the monoisotopic peak.
In our experiment, the capillary was flushed with the separation buffer for 5 min between runs. To confirm that there was negligible non-specific adsorption of the protein in the coated capillary, a blank was also acquired after a sample run, S-Fig. 1 in supporting material I. There is no obvious protein signal, and the background signal intensity (3.84 E4) is about 1,000 times lower than that from the sample run (4.47E7, Fig. 2). Sample carryover is negligible in this experiment.
The Orbitrap mass analyzer was operated at 100,000 resolution (m/z 400) for protein detection, which produced accurate masses for cyto.c, myo, and beta casein, Table 1. For myo, the mass error was 0.02 Da (less than 2 ppm). For cyto.c and beta casein, the mass error was about 1 Da, which can be attributed to peak extraction errors. For BSA, the Mw is larger than 66 kDa, and an accurate Mw was not determined in this work. The Mw of all the five impurities observed in this work was manually calculated, and are also listed in Table 1.
Because of the accurate mass of proteins, we can interpret the multiple peaks generated by beta casein (Fig. 2). For beta casein peaks a, b, and c in Figure 2, the corresponding protein masses are ~23 967 Da, ~24 007 Da, and ~24 077 Da, respectively. The mass difference between peak b and a is ~40 Da, and the mass difference is ~110 Da between peak c and a. According to the beta casein entry from UniprotKB (http://www.uniprot.org/uniprot/P02666), beta casein has many natural variations, i.e. A1, A2, and B. A2 beta casein is recognized as the original beta casein protein, and its theoretical mass is 23 968 Da, agreeing with the observed beta casein mass (23 967 Da, Table 1) from peak a; beta casein peak a in Figure 2 corresponds to variant A2.
Based on the UniprotKB information of beta casein, the major difference between A2 and A1 variants is an amino acid at position 67 in the mature beta casein protein sequence. A2 variant has a proline amino acid at that position, while the A1 variant has a histidine amino acid at the same position. The mass difference between proline (115 Da) and histidine (155 Da) is 40 Da, which matches the mass difference between peak b and a in Figure 2. Histidine has a basic side chain, while proline has a nonpolar side chain, so when variants A1 and A2 are separated in 0.1%FA separation buffer by CZE, the variant A1 will move faster due to higher positive charge from side chain of histidine, which is cosistent with the migration time of peak b and a in Figure 2. These results indicate that the beta casein peak b most likely corresponds to variant A1.
For variants A2 and B of beta casein, two amino acids differences exist. One is the amino acid difference at position 67 mentioned above. Another is that variant B has an arginine amino acid at position 122 (mature beta casein protein sequence), while A2 variant has a serine amino acid at the same position. The mass difference between serine (105 Da) and arginine (174 Da) is 69 Da. Therefore, the total mass difference between variants B and A2 is 109 Da, which agrees with the mass difference between peak c and a. Basic side chains of arginine and histidine will make the positive charge of variant B in 0.1%FA condition higher than variants A2 and A1, generating shorter migration time, which agrees with the migration order of peak c, b and a in Figure 2. The results demonstrate that the peak c can be recognized as variant B.
Our results for variants of beta casein (A2, A1 and B) observed by CZE-ESI-MS agree with that from Wu et al. [34] who employed RPLC intact protein fractionation and offline MS/MS analysis. Our results suggest that CZE-ESI-MS can be a useful tool for protein variants analysis.
The reproducibility of the CZE-ESI-MS system was also evaluated for protein analysis. The native four-protein mixture was sequentially analyzed by the system in quintuplicate runs, Fig. 3. The migration time of all the four model proteins was highly reproducible and the relative standard deviations (RSDs) were less than 3%, S-Table 1 in supporting material I, which is less than the peak width. The intensity of the four proteins was also reasonably consistent between runs (RSDs < 30%, S-Table 2 in supporting material I).
Figure 3.

Base plectropherograms of four standard proteins analyzed by the CZE-ESI-MS system in quintuplicate runs.
Comparison of the performance of CZE-ESI-MS for native and denatured proteins analysis
We also analyzed a mixture of denatured cyto.c, myo, BSA, and beta casein in 30% (v/v) ACN and 0.07% (v/v) FA, S-Fig. 2 in supporting material I. The sample injection, CZE separation, and MS detection conditions for the denatured proteins were the same as that for native proteins. However, the separation performance for denatured proteins was different from that for native proteins. We observed that the migration time of denatured BSA was longer than that of native BSA. Native condition BSA moved faster than native myo; denatured BSA moved slower than denatured myo. The change in migration might be due to the difference of pI in native and denatured conditions. The pI of a native protein depends on the amino acids on the protein’s surface, whereas the pI of a denatured protein only depends on its sequence. The protein intensity from denatured proteins was lower than that from native proteins, which is most likely due to the sample loss during desalting of denatured proteins with a C8- solid phase extraction column.
Fast top-down characterization of native proteins with CZE-ESI-MS/MS
We performed tandem mass spectrometry to characterize the four native model proteins (cyto.c, myo, BSA, and beta casein) by fragmenting intact proteins with HCD. The four-protein mixture in 30% (v/v) ACN and 0.07% (v/v) FA was separated by CZE. The separated proteins were analyzed by the Orbitrap. The highest intensity peaks from the acquired MS1 spectra were isolated, followed by fragmentation in the HCD cell and Orbitrap analysis.
Two values of normalized collisional energy, 20 and 35%, were used for the protein analysis. One model protein, beta casein (variant A2), was identified with 20% energy, which generated a clear tandem spectrum, Fig. 4. In total, 28 matched different fragment ions (b and y ions) were obtained after MS-Align+ database searching, and 26 of them were had less than 10 ppm mass error, which provides confident identification. The matched fragment ions are listed in supporting material II. Almost all of the highly abundant peaks in the tandem spectrum matched with the fragments of beta casein, Fig. 4A. In addition, fragmentation occurred at the N-terminus, C-terminus, and the middle of beta casein, Fig. 4B, which further confirm the identification. There are 5 phosphorylated sites for beta casein (http://www.uniprot.org/uniprot/P02666). After database searching, a ~400 Da modification was determined in one sequence close to the N-terminus (PGEIVESLSSSEESITRINKKIEKFQSEE), which is consistent with five phosphorylation modifications. The five phosphorylated sites listed in UniProtKB are labeled with circles in Fig. 4B. None of the five phosphate groups were lost during fragmentation, which is a distinct advantage of top-down approach for protein modification determination. We also carefully checked the tandem spectra from beta casein variants A1 and B. Unfortunately, no reasonable matches of the two variants were observed based on the database searching results.
Figure 4.
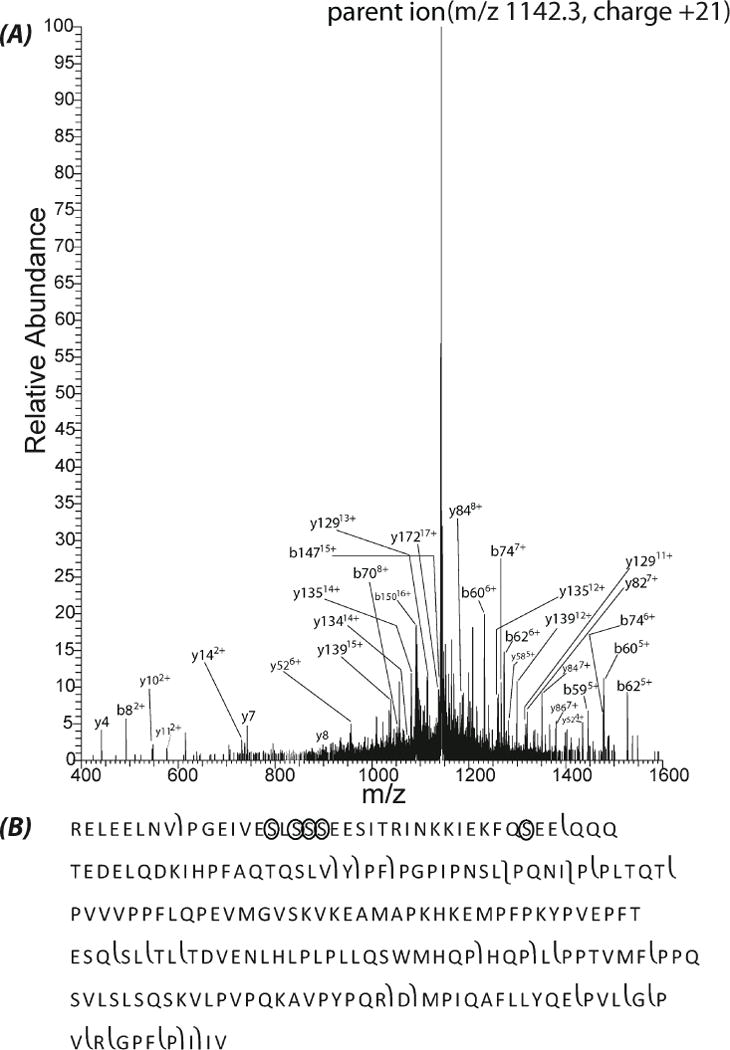
Higher energy collisional dissociation (HCD) fragmentation of beta casein. (A) Single scan fragmentation spectra of the [M+21H] 21+ charge state of beta casein with HCD (normalized collisional energy as 20%). Note that all the five phosphate groups remained attach to the fragments. (B) Sequence of beta casein with phosphorylation sites labeled with circle and the fragmentation patterns observed with HCD.
For the 35% normalized collisional energy results, the fragmentation spectrum from beta casein resulting from 35% energy was too complex for identification. This complexity is possibly due to the interferences of neutral loss peaks. For cytochrome c, 17 matched fragment ions were obtained after database searching, and 11 of them had less than 10 ppm mass error. The matched fragment ions are listed in supporting material II. Almost all of the relative high intensity peaks in the tandem spectrum match the fragment ions of cytochrome c, S-Fig. 3A in supporting material I. In addition, fragmentation occurred at the N-terminus, C-terminus, and the middle of cytochrome c, S-Fig. 3B in supporting material I, which results in confident identification. According to the database searching results, two modifications were observed in the sequence: an acetylation (42 Da) at the N-terminus and a heme group (616 Da) close to the N-terminus (Ac-GDVEKGKKIFVQKC), S-Fig. 3B in supporting material I. These modifications are consistent with the UniProtKB database (http://www.uniprot.org/uniprot/P62894). For myoglobin, 16 matched fragment ions were obtained, and 14 of them were less than 10 ppm error. The matched fragment ions are listed in supporting material II. Four continuous y ions (y234+, y244+, y254+ and y264+) matched with four relatively high intensity peaks in the tandem spectrum, S-Fig. 4A in supporting material I, and the protein fragmentation covered the terminals and middle part of myoglobin, S-Fig. 4B in supporting material I, which yield confident protein identification. The heme group of myoglobin was lost, which might be due to the non-covalent binding of heme group to this protein’s sequence.
It is worth mentioning that besides the identifications of the three model proteins, an impurity, bovine transthyretin, was also identified via database searching from both 20% and 35% energy data. The best match from 20% energy data generated 23 matched fragment ions, and 18 of them were of less than 10 ppm mass error. The best match from 35% energy data yielded 27 matched fragment ions, and 21 of them were of less than 10 ppm mass error. The information of matched fragment ions is listed in supporting material II. The injection amount of the impurity was less than 5% of the model protein according to the protein purity (≥95%), so less than 6 fmole (calculated based on the injection amounts of the model proteins in Table 1) of bovine transthyretin was loaded for analysis, which suggests the high sensitivity of the CZE-ESI-MS/MS system for protein identification.
Supplementary Material

Table of content graphic
Acknowledgments
We thank Dr. William Boggess in the Notre Dame Mass Spectrometry and Proteomics Facility for his help with this project. This work was funded by the National Institutes of Health (R01GM096767) and by a grant from Eli Lilly.
References
- 1.Kelleher NL. Anal Chem. 2004;76:196A–203A. [PubMed] [Google Scholar]
- 2.Chait BT. Science. 2006;314:65–66. doi: 10.1126/science.1133987. [DOI] [PubMed] [Google Scholar]
- 3.Siuti N, Kelleher NL. Nat methods. 2007;4:817–821. doi: 10.1038/nmeth1097. [DOI] [PMC free article] [PubMed] [Google Scholar]
- 4.Kelleher NL, Lin HY, Valaskovic GA, Aaserud DJ, Fridriksson EK, McLafferty FW. J Am Chem Soc. 1999;121:806–812. [Google Scholar]
- 5.McLafferty FW, Fridriksson EK, Horn DM, Lewis MA, Zubarev RA. Science. 1999;284:1289–1290. doi: 10.1126/science.284.5418.1289. [DOI] [PubMed] [Google Scholar]
- 6.Ge Y, Lawhorn BG, ElNaggar M, Strauss E, Park JH, Begley TP, McLafferty FW. J Am Chem Soc. 2002;124:672–678. doi: 10.1021/ja011335z. [DOI] [PubMed] [Google Scholar]
- 7.Zhou H, Ning Z, Starr AE, Abu-Farha M, Figeys D. Anal Chem. 2012;84:720–734. doi: 10.1021/ac202882y. [DOI] [PubMed] [Google Scholar]
- 8.Han X, Jin M, Breuker K, McLafferty FW. Science. 2006;314:109–112. doi: 10.1126/science.1128868. [DOI] [PubMed] [Google Scholar]
- 9.Tran JC, Zamdborg L, Ahlf DR, Lee JE, Catherman AD, Durbin KR, Tipton JD, Vellaichamy A, Kellie JF, Li M, Wu C, Sweet SMM, Early BP, Siuti N, LeDuc RD, Compton PD, Thomas PM, Kelleher NL. Nature. 2011;480:254–258. doi: 10.1038/nature10575. [DOI] [PMC free article] [PubMed] [Google Scholar]
- 10.Parks BA, Jiang L, Thomas PM, Wenger CD, Roth MJ, Boyne MT, II, Burke PV, Kwast KE, Kelleher NL. Anal Chem. 2007;79:7984–7991. doi: 10.1021/ac070553t. [DOI] [PMC free article] [PubMed] [Google Scholar]
- 11.Vellaichamy A, Tran JC, Catherman AD, Lee JE, Kellie JF, Sweet SMM, Zamdborg L, Thomas PM, Ahlf DR, Durbin KR, Valaskovic GA, Kelleher NL. Anal Chem. 2010;82:1234–1244. doi: 10.1021/ac9021083. [DOI] [PMC free article] [PubMed] [Google Scholar]
- 12.Catherman AD, Li M, Tran JC, Durbin KR, Compton PD, Early BP, Thomas PM, Kelleher NL. Anal Chem. 2013;85:1880–1888. doi: 10.1021/ac3031527. [DOI] [PMC free article] [PubMed] [Google Scholar]
- 13.Tipton JD, Tran JC, Catherman AD, Ahlf DR, Durbin KR, Lee JE, Kellie JF, Kelleher NL, Hendrickson CL, Marshall AG. Anal Chem. 2012;84:2111–2117. doi: 10.1021/ac202651v. [DOI] [PMC free article] [PubMed] [Google Scholar]
- 14.Chi A, Bai DL, Geer LY, Shabanowitz J, Hunt DF. Int J Mass Spectrom. 2007;259:197–203. doi: 10.1016/j.ijms.2006.09.030. [DOI] [PMC free article] [PubMed] [Google Scholar]
- 15.Jorgenson JW, DeArman Lukacs K. Science. 1983;222:266–272. doi: 10.1126/science.6623076. [DOI] [PubMed] [Google Scholar]
- 16.Haselberg R, de Jong GJ, Somsen GW. Electrophoresis. 2011;32:66–82. doi: 10.1002/elps.201000364. [DOI] [PubMed] [Google Scholar]
- 17.Jensen PK, Paša-Tolić L, Anderson GA, Horner JA, Lipton MS, Bruce JE, Smith RD. Anal Chem. 1999;71:2076–2084. doi: 10.1021/ac990196p. [DOI] [PubMed] [Google Scholar]
- 18.Valaskovic GA, Kelleher NL, McLafferty FW. Science. 1996;273:1199–1202. doi: 10.1126/science.273.5279.1199. [DOI] [PubMed] [Google Scholar]
- 19.Simó C, Herrero M, Neusüß C, Pelzing M, Kenndler E, Barbas C, Ibáñez E, Cifuentes A. Electrophoresis. 2005;26:2674–2683. doi: 10.1002/elps.200500055. [DOI] [PubMed] [Google Scholar]
- 20.Haselberg R, Ratnayake CK, de Jong GJ, Somsen G. J Chromatogr A. 2010;1217:7605–7611. doi: 10.1016/j.chroma.2010.10.006. [DOI] [PubMed] [Google Scholar]
- 21.Haselberg R, de Jong GJ, Somsen GW. Anal Chem. 2013;85:2289–2296. doi: 10.1021/ac303158f. [DOI] [PubMed] [Google Scholar]
- 22.Maxwell EJ, Chen DD. Anal Chim Acta. 2008;627:25–33. doi: 10.1016/j.aca.2008.06.034. [DOI] [PubMed] [Google Scholar]
- 23.Moini M. Anal Chem. 2007;79:4241–4246. doi: 10.1021/ac0704560. [DOI] [PubMed] [Google Scholar]
- 24.Busnel JM, Schoenmaker B, Ramautar R, Carrasco-Pancorbo A, Ratnayake C, Feitelson JS, Chapman JD, Deelder AM, Mayboroda OA. Anal Chem. 2010;82:9476–9483. doi: 10.1021/ac102159d. [DOI] [PubMed] [Google Scholar]
- 25.Wojcik R, Dada OO, Sadilek M, Dovichi NJ. Rapid Commun Mass Spectrom. 2010;24:2554–2560. doi: 10.1002/rcm.4672. [DOI] [PubMed] [Google Scholar]
- 26.Wojcik R, Li Y, MacCoss MJ, Dovichi NJ. Talanta. 2012;88:324–329. doi: 10.1016/j.talanta.2011.10.048. [DOI] [PMC free article] [PubMed] [Google Scholar]
- 27.Li Y, Champion MM, Sun L, Champion PAD, Wojcik R, Dovichi NJ. Anal Chem. 2012;84:1617–1622. doi: 10.1021/ac202899p. [DOI] [PMC free article] [PubMed] [Google Scholar]
- 28.Sun L, Zhu G, Li Y, Wojcik R, Yang P, Dovichi NJ. Proteomics. 2012;12:3013–3019. doi: 10.1002/pmic.201200100. [DOI] [PMC free article] [PubMed] [Google Scholar]
- 29.Li Y, Wojcik R, Dovichi NJ, Champion MM. Anal Chem. 2012;84:6116–6121. doi: 10.1021/ac300926h. [DOI] [PMC free article] [PubMed] [Google Scholar]
- 30.Zhu G, Sun L, Yan X, Dovichi NJ. Anal Chem. 2013;85:2569–2573. doi: 10.1021/ac303750g. [DOI] [PMC free article] [PubMed] [Google Scholar]
- 31.Liu X, Inbar Y, Dorrestein PC, Wynne C, Edwards N, Souda P, Whitelegge JP, Bafna V, Pevzner PA. Mol Cell Proteomics. 2010;9:2772–2782. doi: 10.1074/mcp.M110.002766. [DOI] [PMC free article] [PubMed] [Google Scholar]
- 32.Shihabi ZK. J Chromatogr A. 2000;902:107–117. doi: 10.1016/s0021-9673(00)00743-3. [DOI] [PubMed] [Google Scholar]
- 33.Yang Y, Boysen RI, Hearn MTW. Anal Chem. 2006;78:4752–4758. doi: 10.1021/ac051735v. [DOI] [PubMed] [Google Scholar]
- 34.Wu S, Lourette NM, Tolić N, Zhao R, Robinson EW, Tolmachev AV, Smith RD, Paša-Tolić L. J Proteome Res. 2009;8:1347–1357. doi: 10.1021/pr800720d. [DOI] [PMC free article] [PubMed] [Google Scholar]
Associated Data
This section collects any data citations, data availability statements, or supplementary materials included in this article.