

Abstract
Background
The Child Nutrition and WIC Reauthorization Act of 2004 (hereafter called the 2004 Reauthorization Act) was federal legislation that required school districts participating in the federally funded school meal program to develop and implement policies addressing nutrition guidelines for all foods and beverages available on school campuses by the onset of the 2006/2007 school year.
Purpose
Vending machine and school store (VMSS) availability and low-nutrient, energy-dense snacks and beverages in VMSS were assessed in a statewide sample of Minnesota secondary schools before and after the 2004 Reauthorization Act was implemented in 2006/2007.
Methods
The CDC School Health Profiles principal survey was collected from a representative sample of middle (n=170) and high (n=392) schools biennially from 2002 to 2010. Trends were estimated using general linear models with a logit link and linear spline modeling. Analyses were conducted in 2012.
Results
Among high schools, VMSS (p=0.001) and sugar-sweetened beverages (p=0.004), high-fat salty snacks (p=0.001), and candy (p=0.001) in VMSS decreased from 2002 to 2008. In 2008, a change in slope direction from negative to positive occurred for all food practices and an increase in VMSS (p=0.014) and sugar-sweetened beverages (p=0.033) was seen. Among middle schools, VMSS (p=0.027), sugar-sweetened beverages (p=0.001), high-fat salty snacks (p=0.001), and candy (p=0.029) decreased from 2002 to 2010.
Conclusions
This study supports a link between policy and sustainable decreases in some food practices but not others and a differential effect that favors middle schools over high schools. Policy-setting is a dynamic process requiring ongoing surveillance to identify shifting trends.
Background
Sugar-sweetened beverages (SSBs), high-fat salty snacks, and candy have been mainstays of vending machines and school stores (VMSS) in U.S. secondary schools and high-profile targets when considering policy strategies to combat childhood obesity.1,2 In the past decade, the IOM, numerous voluntary initiatives, and state and federal legislation have addressed the availability of low-nutrient, energy-dense snacks and beverages in the school setting.3–8 Among these, the Child Nutrition and WIC Reauthorization Act of 2004 (hereafter referred to as the 2004 Reauthorization Act) stands out as a point of reference to assess change in food practice at the school level in response to policy initiatives.
The 2004 Reauthorization Act was federal legislation that exerted a broad reach by requiring all school districts participating in the federally funded school meal program to develop and implement policies addressing nutrition guidelines for all foods and beverages available on each school campus by the onset of the 2006/2007 school year.8 In the U.S., more than 101,000 schools and institutions participate in the federally funded school meal program.9 The federal legislation also required school districts to involve key stakeholders such as school representatives, parents and students in policy development, as well as establish a plan for assessing policy implementation.8 Guidance on policy detail or a system for monitoring and enforcing policy implementation was not included in the legislation.
Since 2006, a growing literature has linked improvement in the secondary school food environment to policy initiatives.4,5,10–13 However, studies have been mostly cross-sectional or have examined change in the prevalence of low-nutrient, energy-dense snacks and beverages in VMSS over a relatively brief period before and after implementation of the federal legislation. Long-term success in creating healthy school food environments will benefit from continual monitoring of school food practices over time to better characterize changing prevalence rates and provide more informed feedback as state and national policy continue to evolve in response to the childhood obesity epidemic. In the U.S., most states participate in the CDC School Health Profiles, a biennial survey conducted in secondary schools since 1996 that measures school policies and practices.14 In 2002, Profiles added questions addressing the availability of VMSS and low-nutrient, energy-dense snacks and beverages in VMSS.15
For the current study, Profiles data from Minnesota were used to assess the availability of VMSS and SSBs, high-fat salty snacks, and candy in VMSS in secondary schools before and after the 2004 Reauthorization Act was implemented at the start of the 2006/2007 school year. Trends in availability from 2002 to 2010 also were examined. It was hypothesized that a significant and sustainable decrease in the availability of VMSS and SSBs, high-fat salty snacks, and candy in VMSS would occur following implementation of the federal legislation. The present study was conducted as part of the School Obesity-related Policy Evaluation (ScOPE) study, which aims to examine school obesity prevention policies in Minnesota secondary schools and student weight and weight-related behaviors.
Methods
For Minnesota School Health Profiles, school-level data from a stratified random cross-sectional sample of public middle (n=170) and high (n=392) schools were collected biennially from 2002 to 2010. The current study used data from the School Health Profiles principal survey, which is a self-administered, mailed survey completed by principals or designees. For each survey year, at least 70% of the principals in the sample completed the survey, with the exception of 2006, when the response rate was 66% (P. Rhode, Minnesota Department of Health, personal communication, 2012). For Profiles, weighted data are not available when response rates fall below 70%.16 Therefore, for the current study, data were analyzed without weights. However, the stratified nature of the random sample was accounted for by including an adjustment in all models for the original stratification scheme that included middle, junior high, and high schools. Further, sensitivity analysis comparing weighted to unweighted data found minimal differences for most survey items (typically < 1%).
On the survey, principals were asked: (1) whether students could purchase snack foods or beverages from one or more vending machines at school or at a school store, canteen, or snack bar; and if yes, whether students could purchase each of the following snack foods or beverages: (2) sugar-sweetened beverages (soda pop/soft drinks, sports drinks or fruit drinks that are not 100% juice); (3) any candy (chocolate candy and/or other kinds of candy); and(4) salty snacks that are not low in fat.15,17 Responses for all items were yes/no.
School-level demographics were obtained from the National Center for Educational Statistics (NCES) Common Core Data18 and included minority enrollment categorized for the current study as < 5%, 5%–20%, and > 20%; free/reduced-price lunch participation (FRLP) categorized as > 0%– < 20%, 20%–40%, and > 40%; and school type categorized as middle versus high school. High schools were defined as any school that included Grade 6 or higher and Grade 10 or higher. Middle schools were defined as any school that included Grade 6 or higher and Grade 9 or lower. School location, categorized as city, suburb, or town/rural, was determined using a combination of NCES and Rural–Urban Commuting Areas classification schemes.18,19 This study was approved by the IRB of the University of Minnesota.
All statistical models were stratified by school type and included adjustments for school-level demographics. To examine the association between each outcome and survey year, generalized estimating equation models were used that specified a binomial distribution with a logit link and an independent correlation structure to account for sampling of some schools over multiple years. Linear spline models with a knot at 2008 allowed for estimation of linear slopes on the logit scale between 2002 and 2008 and between 2008 and 2010, as well as a change between the trend from 2002 to 2008 and the trend from 2008 to 2010.20 Changes in predicted percentages were calculated from the logistic models as the difference in model-adjusted percentages between the two-year periods. Trend tests for 2002–2010 were estimated using non-spline models if the test for change in trend from 2002 to 2008 and 2008 to 2010 was not significant. For all models, interactions between year, location, minority enrollment, and FRLP were not significant and therefore were not included in the final analysis. Analyses were conducted in 2012 with SAS, version 9.2, using Proc Genmod.
Results
Figure 1 displays crude percentages by year, stratified by school type for each food practice. Across years, VMSS and SSB availability in VMSS were more common in high schools than middle schools, with a few notable exceptions. These include 2002 when SSBs were available in essentially all VMSS in both middle and high schools and 2008 when the proportion of schools reporting VMSS was similar across school type. For both school types, candy and high-fat salty snacks were offered less commonly and demonstrated steeper declines in availability over the 8-year period when compared to SSBs. From 2006 to 2008, prevalence of all food practices fell, with the exception of candy in middle schools, which essentially remained stable. From 2008 to 2010, high schools showed an increase in the prevalence of all food practices, whereas middle school prevalence decreased further and along a pattern of decline evident since 2002.
Figure 1.
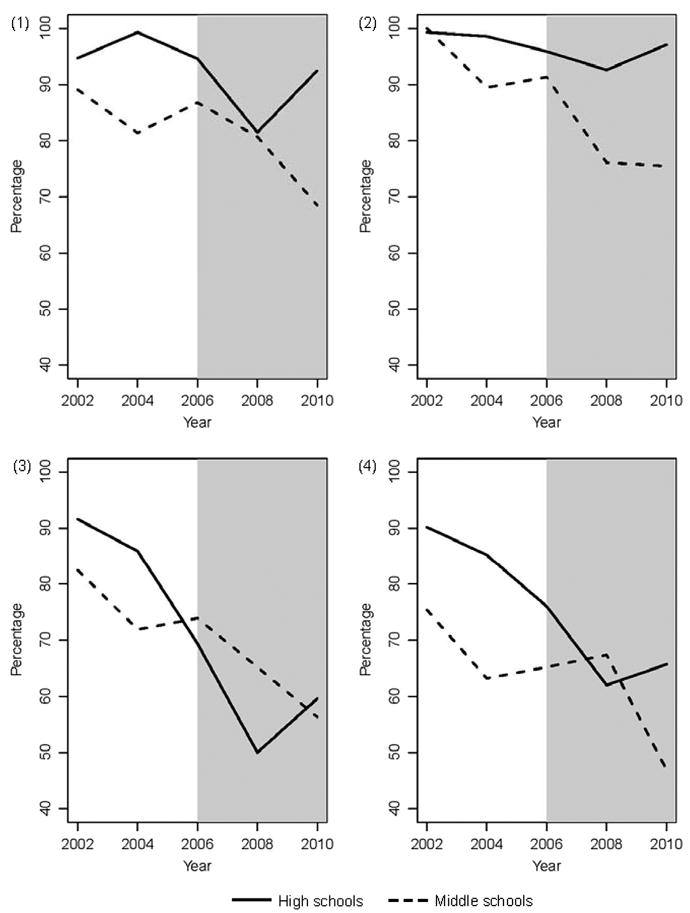
Crude percentage of middle and high schools with (1) VMSS; (2) sugar-sweetened beverages; (3) high-fat, salty snacks; and (4) candy in VMSS.
Note: The shaded region denotes the time period after the implementation of the Child Nutrition and WIC Reauthorization Act of 2004 in the 2006/2007 school year.
VMSS, vending machines and school stores
Tables 1 and 2 show trends in the school food practices from 2002 to 2010 for high and middle schools, respectively. Among high schools (Table 1), a significant decreasing trend in the percentage of schools with VMSS, as well as the availability of SSBs, candy and high-fat salty snacks in VMSS occurred from 2002 to 2008. In 2008, a significant change in the direction of the slope from negative to positive occurred for all food practices. For VMSS and SSBs in VMSS, a significant increase in availability was seen. Among middle schools (Table 2), there was no significant change in slope between 2002 to 2008 and 2008 to 2010 (data not shown); therefore, overall trends from 2002 to 2010 are reported. Substantial and significant decreasing trends in availability of VMSS and SSBs, candy, and high-fat salty snacks in VMSS occurred from 2002 to 2010.
Table 1.
Trends for select school food practices, Minnesota high schools (n=392), 2002–2010
| Availability in schools | Change in predicted %, a 2002–2008 | p-valueb | Change in predicted %, a 2008–2010 | p-valuec | p for change in trend from 2002–2008 to 2008–2010 |
|---|---|---|---|---|---|
| VMSS | −11.5 | 0.001 | +7.2 | 0.014 | 0.001 |
| Sugar-sweetened beverages in VMSS | −7.4 | 0.004 | +5.4 | 0.033 | 0.005 |
| High-fat salty snacks in VMSS | −41.8 | 0.001 | +9.5 | 0.081 | 0.001 |
| Candy in VMSS | −27.3 | 0.001 | +3.4 | 0.499 | 0.014 |
Predicted percentage estimates are from logistic regression models adjusted for minority enrollment, free/reduced-price lunch participation, and location
p for test of linear trend in logistic regression models for change in predicted % from 2002 to 2008
p for test of linear trend in logistic regression models for change in predicted % from 2008 to 2010
VMSS, vending machines and school stores
Table 2.
Trends for select school food practices, Minnesota middle schools (n=170), 2002–2010
| Availability in schools | Change in predicted %, a 2002–2010 | p-valueb |
|---|---|---|
| VMSS | −15.4 | 0.027 |
| Sugar-sweetened beverages in VMSS | −22.7 | 0.001 |
| High-fat salty snacks in VMSS | −33.6 | 0.001 |
| Candy in VMSS | −21.7 | 0.029 |
Predicted percentage estimates are from logistic regression models adjusted for minority enrollment, free/reduced-price lunch participation, and location
p for test of linear trend in logistic regression models for change in predicted percentage from 2002 to 2010
VMSS, vending machines and school stores
Discussion
This study is among the first to examine the availability of VMSS and low-nutrient, energy-dense snacks and beverages sold in VMSS in a statewide sample of secondary schools using data collected biennially from 2002 to 2010, which encompasses the 4 years before and after the 2004 Reauthorization Act was implemented at the start of the 2006/2007 school year. Study results suggest a mixed bag of gains, stalls, and possible reversals in availability of VMSS and SSB, candy, and high-fat, salty snacks in VMSS over the 8-year period, with important and informative differences by school type.
The current study describes a secondary school food environment where VMSS are still common and low-nutrient energy-dense snacks and beverages are readily available in VMSS. Consistent with other studies, prevalence of all food practices was generally higher among high schools than middle schools.1,2,4,5,10,13 However, important shifts in prevalence were noted during the 8-year period under study. For middle schools, a generally steady decline in food practice prevalence occurred from 2002 to 2010 as compared to the inconsistent and sometimes minor shifts evident among the high school sample during the same time period. For high schools, a downward trend in food practice prevalence was evident from 2002 to 2008, which is consistent with other studies examining similar time periods4,5,13 Between 2008 and 2010, a change in the direction of the trend from negative to positive occurred for all food practices. Further, an upward trend in availability of VMSS and SSBs in VMSS was seen in high schools, with prevalence rates for 2010 approaching 2002 rates.
These findings suggest a return to increasing availability of VMSS and low-nutrient, energy-dense snacks and beverages sold in VMSS in high schools. Other recently released studies lend support to this hypothesis. An October 2012 report using School Health Profiles data examined snack food availability in secondary schools across the U.S. from 2002 to 2010 and found that reductions in less-healthy snack foods stalled from 2008 to 2010.21 Findings for that report were not stratified by school type.
Another study using a nationally representative sample of U.S. schools with Grades 8, 10, or 12 examined beverage availability in competitive food venues (VMSS and a la carte programs) from 2006 to 2010 and found an overall decline in beverage venues and SSB availability, across school types.22 However, from 2008 to 2010, modest declines in SSB availability from 69% to 63% and 90% to 88% were seen in middle and high schools, respectively.22 Among middle schools, from 2008 to 2010, the prevalence of vending machines decreased from 71% to 63% and school stores from 42% to 38%; among high schools, vending machine prevalence of 96% and 90.5% and school store prevalence of 56% and 57% were reported in 2008 and 2010, respectively.22 Ongoing surveillance of prevalence rates with attention to differences by school type is necessary to monitor shifting trends.
The difference in practice prevalence between middle and high schools merits further consideration. This persistent pattern seen across studies is especially relevant following the implementation of the 2004 Reauthorization Act, which required policy development and implementation at the district level.8 One might reasonably expect district policy-setting to result in a similar pattern of decline and less overall difference in food practice prevalence across middle and high schools, even when considering nutrition standards that vary by age group and developmental differences.7,23 The relatively steep decline in the prevalence of high-fat, salty snacks in VMSS seen across school type since 2002 and comparable prevalence rates evident in 2010 support this hypothesis.
The absolute decrease in availability of candy in VMSS over the 8-year study period of 22% and 24% for middle and high schools, respectively, also is noteworthy. Interestingly, the decline in candy and salty snack availability was evident well before the 2006 implementation of the federal legislation, suggesting that these declines may have continued independent of the legislation. However, it also is possible that the legislation fortified interest among school districts to build on gains already in progress and likely supported and accepted at the school level. In contrast, availability of VMSS and SSBs in VMSS showed little change from 2002 to 2006, with minimal differences noted by school type. From 2006 to 2008, declines in availability were seen across school type, with further decreases in prevalence seen among middle schools by 2010 as compared to the increase in VMSS and SSBs seen among high schools, where a return or near return to pre-2006 rates was evident.
Altogether, these findings suggest a differential effect of policy that is dependent on food practice and for select food practices, on school type. The 2004 Reauthorization Act was an unfunded mandate and inconsistencies in implementation have been noted, particularly among high schools as compared to middle schools and elementary schools.7,10,12,24,25 This study adds to the literature by qualifying some of the inconsistencies and providing a more constructive dissection that distinguishes solid gains from areas that require more targeted effort if desired results are to be achieved. Strategies used by middle and high schools to successfully reduce high-fat salty snacks and candy availability in VMSS and by middle schools that have resulted in significant and sustained decreases in VMSS and the SSBs in VMSS should be identified and inform future policy and practice efforts.
The current study also highlights the sluggish response by high schools to enact meaningful and sustainable decreases in SSB availability in VMSS. This is an especially worrisome finding that requires focused attention, given the strong association between SSB consumption and weight gain and the link to chronic conditions that include obesity and diabetes.26–28 Prior studies have shown that disproportionately more high schools than middle schools receive revenue and other incentives from soft drink sales.1 Future studies should re-examine the link between revenue generation and SSB availability relative to school- and district-level policy-setting, as well as other factors, such as student, staff, and parent resistance, that may slow efforts to decrease SSB availability in the high school setting.
Strengths and Limitations
This study has several strengths, which include the use of statewide, school-level data collected biennially from 2002 to 2010, a time frame that captures food practice prevalence 4 years before and after implementation of the 2004 Reauthorization Act at the start of the 2006/2007 school year. The linking of school data to sociodemographic characteristics that included location, minority enrollment, and free and reduced-price lunch allowed for control of these potential confounders in all statistical models.
There are also important study limitations. School-level data about nutrition practices were self-reported by school principals or designees and are subject to bias. It also is possible that a respondent was lacking in accurate or current knowledge about the practices assessed, leading to under- or over-reporting of a practice. Although response rates were considered generally good, it is possible that schools that participated were different in important ways from schools that did not participate. Although this study provides support for a link between nutrition policy and food practice at the school level, causality cannot be inferred. Further, attribution of this association to a particular initiative or legislative act is not possible given the numerous policy-related initiatives put in place at different times over the past several years. Results may not be generalizable to secondary schools outside Minnesota. However, a 2007 report assessing the nutritional quality of food and beverages sold in VMSS, a la carte, and fundraisers grouped Minnesota with 20 other states that received the lowest ranking.29
Conclusion
Creating a healthy secondary school food environment that is sustainable over time remains a challenging goal. Policy initiatives that limit student access to low-nutrient, energy-dense snacks and beverages during the school day are a popular strategy advocated by many to achieve this goal. Results from the current study support a link between policy and a sustainable decline in some food practices but not others. Results also suggest a differential effect that favors middle schools over high schools. Finally, this study highlights the dynamic nature of policy-setting and the need to maintain ongoing surveillance of school food practices and assessment of trends that may vary over time. This is especially relevant as the federal government moves forward with the planning and implementation of provisions of the Healthy, Hunger-Free Kids Act of 2010 that require the establishment of nutrition standards for all foods and beverages sold outside the school meal program that are consistent with the Dietary Guidelines for Americans, as well as more detailed requirements for school districts on the measuring and reporting of policy implementation.30
Acknowledgments
This research was supported by the Eunice Kennedy Shriver National Institute of Child Health & Human Development, grant R01-HD070738 awarded to MSN.
No financial disclosures were reported by the authors of this paper.
Contributor Information
Martha Y. Kubik, School of Nursing, Minneapolis, Minnesota.
Cynthia Davey, Clinical and Translational Science Institute, Minneapolis, Minnesota.
Marilyn S. Nanney, Family Medicine and Community Health, Minneapolis, Minnesota.
Richard F. MacLehose, Division of Epidemiology and Community Health, Minneapolis, Minnesota.
Toben F. Nelson, Division of Epidemiology and Community Health, Minneapolis, Minnesota.
Brandon Coombes, Clinical and Translational Science Institute, Minneapolis, Minnesota.
References
- 1.O’Toole TP, Anderson S, Miller C, et al. Nutrition services and foods and beverages available at school: results from the School Health Policies and Programs Study 2006. J Sch Health. 2007;77:500–21. doi: 10.1111/j.1746-1561.2007.00232.x. [DOI] [PubMed] [Google Scholar]
- 2.U.S. Department of Agriculture, Food and Nutrition Services. School Nutrition Dietary Assessment Study–III, summary of findings. Office of Research, Nutrition and Analysis. 2007 Nov; www.fns.usda.gov/ora/MENU/Published/CNP/FILES/SNDAIII-SummaryofFindings.pdf.
- 3.Alliance School Beverage Guidelines. Alliance competitive foods guidelines. www.healthiergeneration.org/schools.aspx?id_3470.
- 4.Woodward-Lopez G, Gosliner W, Samuels SE, Craypo L, Kao J, Crawford PB. Lessons learned from evaluations of California’s statewide school nutrition standards. Am J Public Health. 2010;100:2137–45. doi: 10.2105/AJPH.2010.193490. [DOI] [PMC free article] [PubMed] [Google Scholar]
- 5.Phillips MM, Raczynski JM, West DS, Pulley L, Bursac Z, Heath Gauss C, Walker JF. Changes in the school environments with implementation of Arkansas Act 1220 of 2003. Obesity. 2010;18(S1):S54–S61. doi: 10.1038/oby.2009.432. [DOI] [PubMed] [Google Scholar]
- 6.Boehmer TK, Brownson RC, Haire-Joshu D, Dreisinger ML. Patterns of childhood obesity prevention legislation in the U.S. Prev Chronic Dis. 2007;4(3):A56. www.cdc.gov/pcd/issues/2007/jul/06_0082.htm. [PMC free article] [PubMed] [Google Scholar]
- 7.IOM. Nutrition standards for foods in schools: leading the way toward healthier youth. Washington DC: National Academies Press; 2007. Report brief. [Google Scholar]
- 8.Public Law 108-265, 118 Stat 729. Child Nutrition and WIC Reauthorization Act of 2004. www.govtrack.us/congress/bill.xpd?bill_s108-2507.
- 9.Schirm Allen, Kirkendall Nancy, editors. National Research Council; Committee on National Statistics, Division of Behavioral and Social Sciences and Education. Using American Community Survey data to expand access to the school meals programs. Panel on estimating children eligible for school nutrition programs using the American Community Survey. Washington DC: National Academies Press; 2012. [Google Scholar]
- 10.Kubik MY, Wall M, Shen L, et al. State but not district nutrition policies are associated with less junk food in vending machines and school stores in U.S. public schools. J Am Diet Assoc. 2010;110:1043–8. doi: 10.1016/j.jada.2010.04.008. [DOI] [PMC free article] [PubMed] [Google Scholar]
- 11.Kubik MY, Farbaksh K, Lytle LA. Two years later: wellness councils and healthier vending in a cohort of middle and high schools. J Adolesc Health. 2011;49:550–2. doi: 10.1016/j.jadohealth.2011.03.011. [DOI] [PMC free article] [PubMed] [Google Scholar]
- 12.Brener ND, Chriqui JF, O’Toole TP, Schwartz MB, McManus T. Establishing a baseline measure of school wellness-related policies implemented in a nationally representative sample of school districts. J Am Diet Assoc. 2011;111:894–901. doi: 10.1016/j.jada.2011.03.016. [DOI] [PubMed] [Google Scholar]
- 13.Terry-McElrath YM, O’Malley PM, Delva J, Johnston LD. The school food environment and student body mass index and food consumption: 2004 to 2007 national data. J Adolesc Health. 2009;45:S45–S56. doi: 10.1016/j.jadohealth.2009.04.007. [DOI] [PMC free article] [PubMed] [Google Scholar]
- 14.CDC. Adolescent and school health. School health profiles. www.cdc.gov/HealthyYouth/profiles/index.htm.
- 15.Whalen LG, Grunbaum JA, Kann L, Hawkins J, McManus T, Davis KS. School health profiles: surveillance for characteristics of health programs among secondary schools (Profiles2002) Atlanta GA: CDC; 2004. [Google Scholar]
- 16.CDC. Adolescent and school health. School health profiles. Participation history and data quality, 1996-2010. www.cdc.gov/healthyyouth/profiles/history.htm.
- 17.Brener ND, Demissie Z, Foti K, et al. School health profiles 2010: characteristics of health programs among secondary schools. Atlanta GA: CDC; 2011. [Google Scholar]
- 18.National Center for Education Statistics. Common Core of Data. nces.ed.gov/ccd/
- 19.U.S. Department of Agriculture Economic Research Service. Rural-urban community area codes. www.ers.usda.gov/data-products/rural-urban-commuting-area-codes.aspx.
- 20.Rothman KJ, Greenland S, Lash T. Modern epidemiology. 3. Philadelphia PA: Lippincott Williams & Wilkins; 2008. pp. 410–2. [Google Scholar]
- 21.Robert Wood Johnson and PEW Health Group. Kids’ safe healthful foods project. Out of balance. A look at snack foods in secondary schools across the states. 2012 Oct; www.pewstates.org/research/reports/out-of-balance-85899427383.
- 22.Terry-McElrath YM, Johnston LD, O’Malley PM. Trends in competitive venue beverage availability: findings from U.S. secondary schools. Arch Pediatr Adolesc Med. 2012;166:776–8. doi: 10.1001/archpediatrics.2012.716. [DOI] [PubMed] [Google Scholar]
- 23.Alliance for a Health Generation. www.healthiergeneration.org/uploadedFiles/For_Schools/_New_Builder_Pages/Toolkits/CF/CFGuidelinesK-12Chart.pdf.
- 24.Story M, Nanney MS, Schwartz MB. Schools and obesity prevention: creating school environments and policies to promote healthy eating and physical activity. Milbank Q. 2009;87:71–100. doi: 10.1111/j.1468-0009.2009.00548.x. [DOI] [PMC free article] [PubMed] [Google Scholar]
- 25.Taber DR, Chriqui JF, Chaloupka FJ. Association and diffusion of nutrition and physical activity policies on the state and district level. J Sch Health. 2012;82(5):201–9. doi: 10.1111/j.1746-1561.2012.00688.x. [DOI] [PubMed] [Google Scholar]
- 26.Malik VS, Schulze MB, Hu FB. Intake of sugar-sweetened beverages and weight gain: a systematic review. Am J Clin Nutr. 2006;84(2):274–88. doi: 10.1093/ajcn/84.1.274. [DOI] [PMC free article] [PubMed] [Google Scholar]
- 27.Vartanian LR, Schwartz MB, Brownell KD. Effects of soft drink consumption on nutrition and health: a systematic review and meta-analysis. Am J Public Health. 2007;97(4):667–75. doi: 10.2105/AJPH.2005.083782. [DOI] [PMC free article] [PubMed] [Google Scholar]
- 28.Hu FB, Malik VS. Sugar-sweetened beverages and risk of obesity and type 2 diabetes: epidemiologic evidence. Physiol Behav. 2010;100(1):47–54. doi: 10.1016/j.physbeh.2010.01.036. [DOI] [PMC free article] [PubMed] [Google Scholar]
- 29.State School Foods Report Card 2007. A state-by-state evaluation of policies for foods and beverages sold through vending machines, school stores, a la carte, and other venues outside of school meals. Center for Science in the Public Interest. 2007 Nov; www.cspinet.org/2007schoolreport.pdf.
- 30.S. 3307 (111th) Healthy, Hunger-Free Kids Act of 2010. www.govtrack.us/congress/bills/111/s3307/text.