

Abstract
Heterogeneities in the perfusion of solid tumors prevent optimal delivery of nanotherapeutics. Clinical imaging protocols to obtain patient-specific data have proven difficult to implement. It is challenging to determine which perfusion features hold greater prognostic value and to relate measurements to vessel structure and function. With the advent of systemically administered nanotherapeutics, whose delivery is dependent on overcoming diffusive and convective barriers to transport, such knowledge is increasingly important. We describe a framework for the automated evaluation of vascular perfusion curves measured at the single vessel level. Primary tumor fragments, collected from triple-negative breast cancer patients and grown as xenografts in mice, were injected with fluorescence contrast and monitored using intravital microscopy. The time to arterial peak and venous delay, two features whose probability distributions were measured directly from time-series curves, were analyzed using a Fuzzy C-mean (FCM) supervised classifier in order to rank individual tumors according to their perfusion characteristics. The resulting rankings correlated inversely with experimental nanoparticle accumulation measurements, enabling modeling of nanotherapeutics delivery without requiring any underlying assumptions about tissue structure or function, or heterogeneities contained within. With additional calibration, these methodologies may enable the study of nanotherapeutics delivery strategies in a variety of tumor models.
Keywords: nanoparticles, intravital microscopy, cancer, data classifier, vasculature
1. Introduction
Tumor vasculature is characterized by structural abnormalities that produce spatial and temporal heterogeneities in blood flow. The vasculature lacks a regular hierarchical network of large proximal vessels feeding into successively smaller vessels; instead, vessel interconnections are irregular in size and spacing [1,2]. Endothelial cells lining these vessels have altered morphology, pericytes (cells that support endothelial cells) are poorly attached or absent, and the basement membrane is often abnormal. The resultant vessels are dilated, tortuous, saccular, and vulnerable to collapse [1,2]. The presence of fenestrations [3-5], combined with incomplete vascular walls [5], can yield localized regions of blood plasma leakage that alter macromolecule transport [6,7] and increase interstitial pressure [8]. Collectively, these vascular abnormalities lead to regions of tumor tissue that are perfused poorly, intermittently, or not at all [9,10].
Non-uniformities in vascular perfusion hinder the transport of chemotherapeutics. The delivery of conventional chemotherapeutics relies on passive diffusion from the bloodstream into the tumor interstitium, and is therefore largely constrained by the drug circulation half-life, distance of travel, and the pressure differential between the vasculature and tissue [11]. Nanotherapeutics, in which drugs are concentrated inside longer-circulating nanoscale delivery vehicles, have been developed to enhance drug accumulation within tumors. Early clinical successes, such as Doxil (liposome-encapsulated doxorubicin) and Abraxane (albumin-stabilized paclitaxel), rely on the Enhanced Permeation and Retention (EPR) effect to passively accumulate in tumor fenestrations [12]. The overall efficacy of Doxil and other nanotherapeutics, however, remains variable due to patient-specific heterogeneities in tumor vascularization, interstitial pressure, and drug retention [8]. Advances in multi-stage silicon nanovectors [13] promise to overcome many of these transport barriers, since the physical properties of these particles (size, shape, surface chemistry, etc) can be modulated to improve tumor-specific accumulation in an EPR-independent manner [14,15]. The greatest challenge to the delivery of such nanotherapeutics lies in optimizing particles to leverage transport conditions that are not conducive to conventional chemotherapeutics delivery [16].
Tumor perfusion is still poorly understood, particularly with respect to what conditions lead to effective or poor treatment. Attempts to characterize tumor perfusion using static data, such as the measurement of microvessel density from patient biopsies, have shown mixed prognostic capacity [17,18]. Clinical imaging modalities capable of monitoring perfusion dynamically, such as MRI [19], CT [20], PET [21] and Doppler sonography [22], have been used to produce time-series images that enable pixel-by-pixel analysis of contrast kinetics within tumors. Parameters measured from the resultant “time-signal” curves are placed into pharmacokinetic (PK) models in order to extrapolate information regarding vascular anatomy and physiology. Principal features derived using PK models include the blood flow velocity, blood volume, and mean transit time. Numerous methods have been proposed to extract these features in human tissues [23-31]. While the prognostic capacity of such an approach remains to be determined, MRI [32], CT [33], and PET [34] have demonstrated that tumor transport plays a role in treatment response, and that persistence of unfavorable perfusion characteristics (high blood volume fraction, rapid transit time, focal hyperpermeability, and/or high FDG metabolism) following chemotherapy correlates with a poor treatment response.
Due to the difficulties of relating clinical perfusion imaging with underlying tumor structure and function, intravital microscopy (IVM) studies in live animals are becoming increasingly popular [35,36]. Using video-rate laser-scanning microscopy, blood flow velocity, flux, and hematocrit can be measured by tracking trajectories of fluorescent red blood cells (RBCs) [37]. Concomitant injection of a fluorescent tracer allows measurement of shear rate [37], blood volume fraction [38], and tissue permeability [38-42]. These physiological parameters can be related to local variations in gene expression, enzyme activity, pH, metabolites, and other parameters of interest (reviewed in [36]) by simultaneously imaging multiple fluorescent reporters. A major advantage of IVM is that tumor perfusion can be characterized on a vessel-by-vessel basis, potentially leading to insights into how local variations in perfusion can affect nanotherapeutics delivery and treatment response [43].
Here, we describe a theoretical framework for automated evaluation of IVM perfusion curves in order to model the delivery of nanotherapeutics. Our hypothesis is that tumor-specific perfusion features may be used to model nanotherapeutics accumulation; thus, this framework aims to transcend the challenges posed by the typically abnormal tumor vasculature. Primary tumor fragments, collected from triple-negative breast cancer patients and grown as xenografts in mice, were injected with a bolus of 40kDa FITC-dextran tracer and monitored at 30 fps using IVM. The fluorescence intensity of each vessel was measured over time to yield a heterogeneous set of arterial and venous perfusion curves on a tumor-by-tumor basis. Two features were considered: the time to arterial peak and the venous delay, which acted as inputs for a Fuzzy C-mean (FCM) supervised classifier. The data was classified into three defined groups (poorly vascularized, well vascularized, and “in between” vascularized), which were correlated to experimental nanoparticle accumulation measurements. We find that this approach enables an automated ranking of tumor vascular perfusion in order to model the delivery of nanotherapeutics. Using an independent validation set, we demonstrate that new samples can be mapped into the feature space to determine their perfusion ranking and hence estimate their nanoparticle retention. A major strength of this approach is that it enables the ranking of tumors and evaluation of their behavior in an automated manner without requiring PK models.
2. Materials and methods
2.1 Silicon particle fabrication
Plateloid nanoporous silicon particles of 1000×400nm dimension were fabricated in the Microelectronics Research Center at The University of Texas at Austin [14]. Particles were fluorescently labeled for intravital microscopy as described in [14]. Particles were stored in IPA at 4°C and then washed 5 times with phosphate-buffered saline immediately before use in vivo.
2.2 Animal models
BCM-2665, BCM-2147, BCM-4195, and BCM-3887 human cancer-in-mice xenografts were generated in SCID/beige mice (Harlan Laboratories, Wilmington, MA) by subcutaneous hetero-implantation of human tumor fragments in the mammary pad after gross removal of the epithelium [44]. These slow-growing tumor lines were selected for model calibration due to their highly reproducible vascularization from mouse-to-mouse. MDA-MB-231 triple-negative human breast cancer cells (ATCC) were grown orthotopically in nude mice as a validation set. Three days prior to imaging, mice received a one-time intravenous injection of DiD-labeled autologous red blood cells (RBCs, ~3% hematocrit) [14] for visualization of blood flow dynamics. When tumors reached 3-5 mm in diameter, mice were anesthetized with isoflurane and prepared for IVM using an aseptic skin-flap procedure [14]. Tumors were cover-slipped using a custom coverslip mount for the duration of the experiment. 1-4 hours after particle injection, mice were sacrificed by gravity perfusion with saline followed by 10% neutral buffered formalin. All animal protocols were reviewed and approved by the IACUC at The Methodist Hospital Research Institute (TMHRI).
2.3 IVM image acquisition
Live animals were imaged on an upright Nikon A1R laser scanning confocal microscope customized for IVM [43]. First-pass perfusion was imaged using a 4× magnification objective (3.2 × 3.2 mm) for 5 minutes at 30 frames-per-second (fps) immediately following an intravenous bolus of a 40kDa FITC-dextran tracer (1μM in 50 μl PBS; Invitrogen). High-resolution time-lapse images of particle accumulation were acquired across multiple field-of-views (FOVs) for up to 4 hours at 45-60 second intervals (7 fps) following a one-time intravenous injection of 5×10⁸ particles. A minimum of 20 randomly selected, non-overlapping 1000 × 500 μm FOVs were acquired in parallel for each animal. All image acquisition was performed by simultaneous excitation of tissue with 488, 541, and 640 nm lasers. Emissions were collected by photomultiplier tubes with band-pass filters of ~30-35 nm width centered at 525 nm (FITC-dextran tracer), 579 nm (silicon particles), and 670 nm (RBCs).
2.4 Quantification of particle accumulation
To determine particle accumulation as a function of time, the number of particles per FOV was quantified across each time-lapse video using image-processing techniques adapted from [14,43]. The 12-bit images were split by color, single pixel noise was removed using a minimum noise filter, and individual particles identified using a binary mask. Real-time particle accumulation curves (# of particles/mm3) were produced by automated counting of the appropriate particles in each FOV, summing particle counts across all FOVs at each time-point, and then dividing by the sampled volume [14]. All IVM quantification was performed using Nikon NIS Elements v4.0 software.
2.5 Quantification of tracer perfusion
IVM first-pass perfusion videos acquired at 30 fps were processed as follows: Stills were extracted at 10-frame intervals and aligned relative to each other, yielding 3 fps motion-stabilized videos. Circular regions-of-interest (ROI) were randomly placed inside vessel segments between branching points, ensuring that there was at least 1 pixel of space between ROI and vessel margins. Multiple arterioles, venules, and capillaries (~10 to 200 μm diameter) representing the full spectrum of flow dynamics were selected for analysis, yielding approximately 30-60 ROIs per video. The mean fluorescence intensity of each ROI was measured and plotted as a function of time. Background fluorescence for intensity normalization was measured on a frame-by-frame basis using a non-perfused ROI. Measurement stability with regards to ROI placement was assessed by sampling sets of 5 identical ROIs within at least 10 individual vessels per video. All IVM quantification was performed using Nikon NIS Elements v4.0 software.
2.6 Perfusion classification
Tracer perfusion curves obtained for each tumor replicate were classified based on two features: the time to reach peak arterial perfusion and the delay between arterial and venous perfusion. Arterial and venous signals were distinguished on a video-by-video basis by plotting peak vessel intensity versus vessel diameter, which was found to yield two distinct vessel groupings. Randomly selected ROIs were monitored visually to confirm that the vessels were correctly grouped. The time to peak arterial perfusion was determined by normalizing each arterial curve to obtain a distribution density function. The highest peak was assigned the highest probability of the signal and the time to reach it was termed the “time to arterial peak.” Since the signals had different durations, the time to arterial peak was normalized by dividing with the signal duration. The perfusion signals were thus represented as random variables with a number of values, each with a different probability. The set of possible values associated with each random variable was mathematically treated as a distribution. The “venous delay”, defined as the lag time between tracer appearance in the arterial system and the venous system, was similarly assessed by obtaining distribution density functions and normalizing by the signal duration. Due to the complexity of the vascular network, no attempts were made to visually pair specific arteries with veins; instead, the vascular system was treated as a closed-loop system with a single input and output.
The time to arterial peak and venous delay were measured for each tumor replicate, with the final value representing the expectation (E) of all the probabilities for each set of veins and arteries:
where Pvein(Yi) is the probability of the venous delay and Partery(Xi) is the probability of the arterial peak.
2.7 Automated tumor ranking by Fuzzy C-mean classification
Tumors were ranked according to degree of vascularization using a Fuzzy C-mean classifier (FCM). Originally introduced by Bezdek [45], this technique ranks the data based on a membership grade assigned to each cluster. Two functions were utilized: a membership function (which establishes the degree of membership for points within a data cluster) and an objective function (which determines the position of the cluster center). Briefly, clustered data points were assigned an initial cluster center value. A membership function was then applied to determine the degree to which each given sample belongs to the cluster. The center of the clusters was changed iteratively to maximize the degree of belonging for all clustered data points. The unsupervised algorithm was stopped when the membership function became sufficiently small.
Tumors were ranked according to the time to arterial peak and venous delay by utilizing the objective function:
where m is the degree of fuzzification, is the distance (or norm) that specifies the similarity between the data and the center of the clusters, cj is a vector specifying the coordinates of the center of the clusters, xi is the vector of the input data, and is the membership degree of the ith input. Optimization of the objective function involved changing the exponential membership function in which:
The condition was implemented as the algorithm stop function. All FCM classification was performed in an automated manner using Matlab 7.10.0 (R2010a).
2.8 Model validation
Model validation was performed in a blinded manner. Individual MDA-MB-231 tumors were classified based on arterial peak and venous delay measurements and then ranked by membership to the closest cluster center. Estimates of particle accumulation were generated by plotting tumor ranks on a curve calibrated with the training set (BCM-2665, BCM-2147, BCM-4195, and BCM-3887 tumors).
3. Results
3.1 Nanotherapeutics delivery is heterogeneous from tumor to tumor
Real-time IVM of silicon particle accumulation in tumors revealed tumor-specific differences in particle accumulation. Particle accumulation was quantified across triple-negative breast tumor biopsies, which were collected from 4 different patients (BCM-2147, BCM-2665, BCM-3887, and BCM-4195) and grown as xenografts in immunocompromised SCID/Beige mice. Figure 1 shows sample images and kinetic data for the accumulation of 1000×400 nm particles in the vasculature of 2147 and 4195 tumors. Mice treated with identical numbers of particles (5×10⁸) showed distinct differences in the number of particles accumulated. Particle accumulation varied between tumors derived from different patients, as well as within tumor replicates. The 2147 mouse shown in figure 1, for example, accumulated particles at a density of ~27,900 particles/mm3, whereas 2147 replicates as whole (n=3) accumulated particles at a density of 27,500 ± 1450 particles/mm3. Similarly, the 4195 mouse shown in figure 1 accumulated particles at a density of ~2920 particles/mm3, whereas 4195 replicates (n=4) accumulated particles at a density of 3450 ± 400 particles/mm3. The largest difference in particle accumulation was observed between tumors derived from different patients, leading us to speculate that tumor-specific differences in perfusion play an important role in nanoparticle delivery.
Figure 1.

Accumulation of 1000×400 nm silicon particles in the vasculature of human breast cancer xenografts. (a) Representative IVM images of silicon particle (red) adhesion to the walls of perfused blood vessels, collected 1 hour after particle injection. Vessel walls were delineated via a 40kDa FITC-dextran tracer (green) and vessel perfusion was identified by the presence of moving red blood cells (blue). Inset, magnified view demonstrating that individual particles can be readily distinguished for quantification purposes. Scale bar = 50 μm. (b) Representative particle accumulation kinetics as measured by IVM, shown for individual 2147 and 4195 mice. Differential particle accumulation is observed, with 2147 tumors showing more rapid particle accumulation and a higher quantity of adherent particles when compared to 4195 tumors.
3.2 Quantification of tracer first-pass perfusion
The first-pass perfusion of an intravenous bolus of 40kDa FITC-dextran tracer was recorded in real-time (30 fps) using IVM. Representative IVM videos of 2147 (Video 1) and 4195 (Video 2) perfusion may be found in the supplementary information. Frame-by-frame analysis of tracer intensity in selected regions-of-interest (ROIs) yielded perfusion time-curves for individual vessels. A representative video of the frame-by-frame analysis (Video 3) may be found in the Supplementary Information. Figure 2 highlights sample arterial and venous curves generated by 2147 and 4195 tumors implanted into mice. Several key features can be observed: The arterial curves (red) are generally characterized by a rapid increase in fluorescence intensity which plateaus within the first minute, drops off, and levels out. The venous curves (blue) demonstrate a more gradual increase in fluorescence intensity, resulting in a delayed plateau. A large number of such curves (~30-60) was generated for each implant, allowing characterization of intratumoral heterogeneity. Differences were observed in peak intensity, time to arterial peak, and venous delay within each tumor, suggesting that vascularization can be heterogeneous within a given tumor. Independent stability analysis was performed for each video to confirm that ROI placement had no significant impact on the rate of tracer influx and that variations in signal intensity at any given time-point fell within the overall signal noise. Data was considered robust and included for classification when these conditions were met.
Figure 2.

Quantification of tumor first-pass perfusion following injection of a 40kDa FITC dextran tracer. (a) Representative regions-of-interest (ROIs) selected for time measurements of fluorescence intensity. Circular ROIs were randomly defined inside arterioles, venules, and capillaries, between branching points, yielding approximately 30-60 ROIs per video. (b) Representative arterial (red) and venous (blue) perfusion-time curves of individual vessels, measured for single 2147 and 4195 tumors. Variations in time to arterial peak and venous delay are observed within each tumor. The videos from which data was derived may be found in the Supplementary Information.
3.3 Identification of tissue classifiers
Heterogeneities in intratumoral perfusion make it difficult to apply standard curve-fitting models for perfusion classification. The first-pass perfusion signal in tumor arteries, for example, does not necessarily rise very quickly to a maximum as would be expected in normal tissue. This was particularly evident for the 4195 and 3887 biopsy implants, in which a slow rise in arterial fluorescence was followed by little or no drop, indicative that the tracer was already fully mixed in the blood by the time of arrival. In contrast, 2147 and 2665 tumors behaved more like normal arteries in that their fluorescence intensity rapidly peaked and then declined immediately after the peak. These observations suggest that the time it takes for arterial flow to reach its peak is a critical feature of tumor perfusion. Accordingly, we generated a distribution density function in which the highest peak has the highest probability of signal, and the time to reach the peak following tracer entry was defined as the “time to arterial peak.”
The perfusion of the tumor venous system showed distinct abnormalities as well. In normal tissue, the difference from the time blood enters an artery until it reaches the corresponding vein is a few seconds. In the tumors in this study, however, this process varied from a few seconds to over a minute. The 2147 tumor in figure 2, for example, showed a delay of ~30-90 seconds between when the tracer appeared in the arteries and appeared in the veins, whereas the 4195 showed a venous delay of ~10-30 seconds. Thus, we postulated that venous delay is also an important feature of tumor perfusion. Accordingly, we applied statistical rules to measure the probability of this delay.
3.4 Classification of tumor vascularity
The time to arterial peak and venous delay was calculated for each biopsy implant and mapped to a single point within a two-dimensional feature space. The final value of a given feature is the expectation of all the probabilities of the vessels imaged over a 10 mm2 field-of-view. Table 1 shows the results of the two features calculated for each implant. When plotted in a two-dimensional feature space, the complexity of the data becomes apparent (figure 3). The scattering of these points reflects both intra- and inter-tumoral heterogeneities. If no intra-tumoral heterogeneities were present, for example, we would expect to see 4 tight clusters of data, one for each set of tumor replicates. Since the data does not fall in a single line, it cannot be linearly classified.
Table 1.
The calculated expectation of individual tumor features
| Tumor type |
Feature 1: Venous delay |
Feature 2: Arterial peak |
|
|---|---|---|---|
| 1 | 2147 | 0.0415 | 0.0342 |
| 2 | 2147 | 0. 1608 | 0.1307 |
| 3 | 2147 | 0.1468 | 0.1381 |
| 4 | 2665 | 0.0300 | 0.0270 |
| 5 | 3887 | 0.0187 | 0.0952 |
| 6 | 3887 | 0.0961 | 0.2361 |
| 7 | 3887 | 0.2766 | 0.2896 |
| 8 | 3887 | 0.0540 | 0.0912 |
| 9 | 4195 | 0.0830 | 0.0609 |
| 10 | 4195 | 0.1822 | 0.1047 |
| 11 | 4195 | 0.1334 | 0.0751 |
| 12 | 4195 | 0.3526 | 0.2309 |
Figure 3.

Application of the FCM classifier partitions the data set into 3 distinct categories. The numbers denote the individual tumor replicates as listed in Table 1. Three classes are marked and the samples are shown with the same color as the center of the class. The red crosses represent poorly vascularized cases, the blue triangles belong to the well-vascularized class, and the green circles denote the “in between” cases.
The data was separated into three different classes based on the pattern of scatter: the first includes cases that are poorly vascularized (i.e. short time to peak and short venous delay), the second includes cases that are well-vascularized (i.e. long time to peak and long venous delay), and the third class is neither poorly nor well-vascularized (“in between” vascularized). These “in between” cases can represent tumors of homogeneous vasculature with intermediate perfusion properties or tumors of heterogeneous vasculature with regions with differing perfusion properties. No restrictions were placed on the classification of very well or very poorly vascularized cases. Figure 3 shows the data set in the two-dimensional feature space after applying the FCM classifier.
The data was ranked by taking into account both the distance of each data point to the center of its cluster and a weighted term for each of the measured features:
where p is the tumor replicate in each class and w1 and w2 are the weighted terms for the venous delay and arterial peak, respectively. We note that there exist numerous optimization algorithms to determine such weighted terms [46,47]. Here, the values for w1 and w2 were chosen by separately calculating the first moment of each feature in each class. Since each feature is described as a separate distribution function, w1 and w2 were selected so that w1+w2 =1. The other constraint, which is based on the observation that normal vasculature is usually associated with a higher probability of venous delay than rapidly perfused tumors, assigns a higher weight to w1. The ratio r of the mean of the two features in each class thus defines the second constraint as (w1/w2 = r) Using our experimental data, we calculate w1 = 0.6 and w2 = 0.4. Note that we do not choose the Euclidean distance from the samples to the center of the classes as the ranking criteria since the accuracy of such an approach is proportional to the sample number. Figure 4 shows the automated tumor ranking from poorly vascularized tumors (left) to well-vascularized tumors (right). Despite the small sample size, it can be observed that there is a large dynamic range (~9.5 fold) in the measured values. Interestingly, replicates from the same patient (#1-3 (2147), #5-8 (3887), and #9-12 (4195)) do not group together, which reflects intra-tumoral heterogeneities in growth and vascularization.
Figure 4.
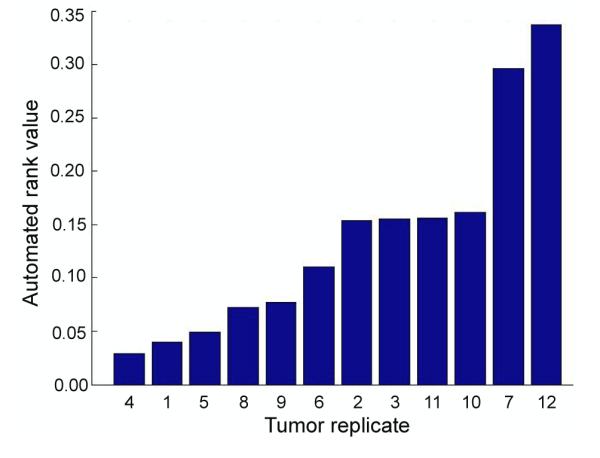
Automated ranking of the implants based on weighted feature probabilities.
Particle accumulation was measured for all tumor replicates evaluated here. Table 2 shows a comparison between tumor classification, automated ranking, and particle accumulation on a tumor-by-tumor basis. Since the classification and ranking schemes do not show a consistent ranking, we cannot compare them directly with the experimental results. We therefore calculated the average value of these features for each patient. Comparison of the averaged patient ranking with the averaged experimental measurement suggests that tumors classified as “poorly vascularized” would uptake the highest number of circulating particles, whereas tumors classified as “well vascularized” would uptake the lowest number of particles. This trend is shown in figure 5, where the automated ranking appears inversely proportional to particle accumulation. Data was fit to a 2nd order polynomial based on the observation that 1000×400nm plateloid particle accumulation is constrained by tumor-specific physiological transport phenomena (manuscript submitted). The 2665 tumor, though a single replicate, had relatively little impact on the classification scheme and was therefore considered robust and included in the fit. Thus relationship between tumor rank and particle accumulation appears to be non-linear, with small changes in the upper ranks yielding large changes in particle accumulation.
Table 2.
Comparison between classification, automated ranking, and experimentally derived nanoparticle accumulation measurements.
| Patient | Vascularity classification |
Automated rank value |
Particle accumulation (#/mm3) |
|||
|---|---|---|---|---|---|---|
| 1 | 2147 | − | 0.1160 ± 0.0661 | (0.0397) | 27,500 ± 1450 | (28,690) |
| 2 | 2147 | +/− | (0.1534) | (25,880) | ||
| 3 | 2147 | +/− | (0.1550) | (27,930) | ||
| 4 | 2665 | − | 0.0293 | (0.0293) | 30,620 | (30,620) |
| 5 | 3887 | − | 0.1434 ± 0.1116 | (0.0493) | 10,810 ± 5400 | (8,080) |
| 6 | 3887 | +/− | (0.1560) | (18,800) | ||
| 7 | 3887 | + | (0.2959) | (9,410) | ||
| 8 | 3887 | − | (0.0722) | (6,960) | ||
| 9 | 4195 | − | 0.1714 ± 0.1157 | (0.0768) | 3,450 ± 400 | (3,410) |
| 10 | 4195 | +/− | (0.1617) | (3,620) | ||
| 11 | 4195 | − | (0.1103) | (2,920) | ||
| 12 | 4195 | + | (0.3369) | (3,850) | ||
Average values for each tumor type are followed by the individual measurements. Averages are presented as ± 1 standard deviation. Tumor vascularity is indicated by − (poorly vascularized), +/− (in-between), or + (well-vascularized).
Figure 5.

Comparison of tumor rank to experimentally observed particle accumulation. (a) Average tumor rank, grouped by patient number. Note that sample 2665 is a single replicate. (b) Average particle accumulation, grouped by patient. Particle accumulation is observed to be inversely proportional to tumor rank. (c) Plot of nonlinear relationship between the average particle accumulation and the average tumor rank.
Triple-negative MDA-MB-231 xenografts were generated for model validation. Grown simultaneously in littermates for 30 days under identical conditions, these tumors nevertheless demonstrated significant differences in tumor vascularization, particle accumulation, and ranking. Figure 6a highlights the morphological differences observed under brightfield illumination and following FITC-dextran injection. Cumulative particle accumulation, as measured by IVM, was found to vary by as much as ~30-fold across the 5 tumors studied (Fig 6b). These tumors were individually classified and ranked in a blinded manner (Table 3).
Figure 6.

Vascularization, particle accumulation, and ranking of MDA-MB-231 xenografts. (a) Brightfield and fluorescence microscopy images of 5 individual tumors grown under identical conditions (Top-bottom: No. 1-5). Significant differences in vascular morphology were observed, as well as local differences in vessel permeability resulting in tracer extravasation. Scale bar = 200μm. (b) Cumulative particle accumulation, as measured by IVM, ranged widely from ~1,000 – 34,000 particles/mm3. (c) Predicted (---) and measured (⑤) particle accumulation values, plotted by tumor rank. The degree of particle accumulation was categorized by position along the predicted accumulation curve (from Figure 5(c)). High accumulation: >20,000 particles/mm3; Moderate accumulation: 5,000-20,000; Low accumulation: <5,000 particles/mm3.
Table 3.
Automated classification and ranking of MDA-MB-231 tumors.
| Vascularity classification |
Automated rank value |
Particle accumulation (#/mm3) | ||
|---|---|---|---|---|
| Predicted | Measured | |||
|
| ||||
| 1 | + | 0.3779 | 0 | 1,070 |
| 2 | − | 0.0977 | 28,940 | 28,310 |
| 3 | − | 0.0920 | 29,960 | 34,300 |
| 4 | − | 0.0352 | 31,610 | 26,070 |
| 5 | +/− | 0.2245 | 0 | 1,900 |
Tumor vascularity is indicated by − (poorly vascularized), +/− (in-between), or + (well-vascularized).
The calculated tumor ranks were found to range from 0.035 (tumor 4, poorly vascularized) to 0.378 (tumor 1, well vascularized). Figure 6c shows the predicted and measured particle accumulation values, plotted by tumor rank. The three tumors predicted to show high particle accumulation (>20,000 particles/mm3) correlated in a statistically significant manner (two-tailed test with α=0.05) with the model prediction (R=0.99 as measured by Pearson Product Moment Correlation), while those with relatively high ranks (>0.18) showed low particle accumulation as expected.
4. Discussion
The collection and interpretation of perfusion data presents significant challenges at both the clinical and preclinical level. In a clinical setting, it is difficult to acquire morphological and perfusion information simultaneously following a single dose of contrast agent, thus most researchers have to choose between studying dynamic or architectural features [19]. While early evidence suggests that a careful combination of both data sets may ultimately improve the accuracy of breast cancer imaging [48,49], researchers have yet to identify perfusion features that may have diagnostic or prognostic value. For this reason, we utilized IVM, a preclinical imaging modality with high spatial (≤ 2 μm) and high temporal (≤ 30 fps) resolution that is uniquely suited for studying tumor pathophysiology in animal models [36]. Collection of data at these scales allows us to detect heterogeneities in tumor vascular structure and function, but at the same time introduces new complexities into the data analysis.
Here we utilized IVM to simultaneously collect both perfusion and particle accumulation kinetics in patient-derived xenografts. Vessel perfusion was measured on a vessel-by-vessel basis, in order to yield a large set of arterial and venous perfusion curves whose variability reflects local differences in vessel structure and function. Features of interest were directly extracted from the measured datasets by using a FCM supervised classifier. Since our goal was to model nanoparticle accumulation based on tumor perfusion characteristics that vary with location and time, we chose not to extrapolate global tumor parameters such as the mean transit time or blood volume (see Appendix). While such measurements might serve as acceptable classifiers, interpolation of each dataset into a single intensity curve would effectively discard all measurements of intratumoral heterogeneity.
To analyze our complex sets of perfusion measurements, we developed a framework to automatically perform tumor classification and ranking without relying on pharmacokinetic (PK) models. Traditional dynamic imaging techniques require PK models to analyze the time-dependence of contrast signals in order to extrapolate features such as the tumor blood volume, blood flow, permeability, and the size of the extravascular space. The accuracy of such models is ultimately limited by the underlying complexity of the tumor pathophysiology and our ability to model these complexities [50]. For this reason, we chose to rank tumors based on direct measurements of the raw data, without using PK models as an intermediary. Although our datasets failed to yield a simple relation between the shape of the perfusion curves and tumors from specific patients, we were able to extract the time to arterial peak and venous delay as discriminating features for tumor classification and ranking. By measuring these two features from experimental IVM datasets, we showed that individual tumors could be automatically ranked according to tumor perfusion. Calibration of the model with IVM measurements of particle accumulation allowed estimation of tumor behavior without requiring any underlying assumptions about tissue structure or function, or heterogeneities contained therein.
The calculated ranks are a direct reflection of tumor heterogeneity, since the classified features incorporate the probabilities collected over a large number of vessels. If no intratumoral heterogeneities were present, for example, we would expect replicates derived from the same patient to yield identical results. Instead, differences in both tumor perfusion and particle accumulation are observed from patient-to-patient, as well as within tumor replicates. When tumor ranks are averaged by patient, it appears that particle accumulation is preferentially associated with poorly vascularized tumors (e.g. short venous delay and short time to arterial peak). This relationship, plotted in figure 5(c), is dependent on tumor heterogeneity. As tumor perfusion becomes more heterogeneous (with respect to the venous delay or time to peak), the tumor rank will shift along the accumulation curve. Thus we expect changes in tumor perfusion to yield differences in nanotherapeutics delivery.
The xenograft tumor sets studied here highlight the importance of selecting appropriate animal models for study of biophysical transport phenomena. Xenografts grown from human cell lines are generally fast growing and show large variations in vascularization from mouse-to-mouse. As a result, the statistical of power animal studies is largely dependent on the scope, quality, and amount of samples analyzed. Our findings suggest that tumors implanted as tissue fragments, while generally slower growing (~2-4 months), show a higher degree of reproducibility when evaluated in terms of tissue perfusion and particle accumulation. This allowed us to calibrate the model with a small set of tumors. In contrast, tumors derived from MDA-MB-231 cells varied much more widely than the tumor lines, translating into a ~10-fold range in ranking. Predictions of particle accumulation in individual tumors matched well with experimentally measured values, supporting our hypothesis that tumor-specific perfusion features may be used to model nanotherapeutics accumulation.
This observation has interesting implications for patient therapy. Successful nanotherapy relies largely on the number of nanoparticles that are retained by tumor tissue [43]. Patients treated with anti-angiogenic agents, for example, may accumulate different numbers of nanotherapeutics and thus respond very differently after vascular remodeling. Vascular normalization via VEGF targeting has been reported to elevate blood perfusion [51] and modulate nanotherapeutics size selectivity [52]. It is not yet known, however, how decreases in vessel leakiness may compromise advantages gained from increased convection. Based on our model, we would expect vascular normalization to improve particle delivery by simultaneously increasing perfusion and decreasing intratumoral heterogeneity. Such a hypothesis could be readily tested in animals using the methodologies outlined here.
From a clinical perspective, there is great interest to identify tumor-specific perfusion parameters that govern nanotherapeutics delivery. Patient eligibility for nanotherapeutics is generally indicated after failure of prior chemotherapy. The IVM data presented here suggests that select groups of patients may highly benefit from nanotherapy while others may not. Based on our initial findings, we propose 3 ranges of particle accumulation: high (>20,000 particles/mm3), moderate (5,000-20,000), and low (<5,000 particles/mm3). We previously calculated that therapeutic silicon particles retained at a density of >15,000 particles/mm3 are likely to deliver sufficient drug for achieving therapeutic benefit at subclinical doses [43]. Thus, tumors whose rankings yield moderate to high accumulation are expected to benefit most from the use of nanotherapeutics over conventional chemotherapy. The approach described here, which combines the high spatial and temporal resolution of IVM with mathematical modeling, is a powerful tool for studying this issue in pre-clinical models. Both perfusion and particle accumulation, for example, can be studied in the same animal on a vessel-by-vessel basis in order to identify mechanisms driving particle delivery and accumulation [14,53]. Since we expect nanoparticle delivery to vary based on physical properties such as particle size, shape, and surface chemistry [14], a large variety of different nanoparticles may be imaged via IVM [54] and utilized to create a library of perfusion model calibrations. While IVM itself is not amenable for use in patients, the ultimate goal of such studies would be to identify specific parameters that can be measured using existing clinical instruments for personalized selection of appropriate nanotherapeutics.
Although these analyses were performed with only a small set of tumors, they serve to highlight the importance of tumor ranking. The methodology we describe here allows an unbiased, automated comparison between different tumors. New samples can be mapped directly into the feature space in order to determine their perfusion ranking. The number of classes and their center positions are readily adapted using this learning methodology so that the model becomes further refined as it receives more inputs. Each input results in a discrete rank value that can be used to quantitatively compare the pathophysiology of one tumor against other measured tumors. Such rankings can be correlated with a variety of quantifiable physiological parameters in order to evaluate the behavior of a given tumor. This same methodology could be applied to a variety of different cancer types to generate tumor-specific information. We expect this to be particularly useful for glioblastoma, where perfusion parameters are thought to correlate with tumor grade, aggressiveness, and prognosis [55-58]. Furthermore, estimates of particle accumulation based on perfusion characteristics could be coupled with advances in multiscale models of tumor vasculature and blood flow [59] in order to predict response to treatment. In recent work, we have simulated the effect of tumor vascularization and blood flow on particle transport and accumulation within solid tumors [43,60]. Theoretical calculations of arterial peak and venous delay, generated via such models, could be automatically evaluated using the framework proposed herein, allowing improved estimation of particle accumulation in combination with patient-specific measurable characteristics such as vascular density and tumor size [60].
We note that additional features can be extracted from the perfusion curves beyond the two described here, such as single-vessel flow rate and tracer/particle throughput, in order to improve model sensitivity and specificity. In this pilot study, we describe the simplest automated method to estimate particle delivery based on readily identifiable tumor perfusion characteristics. Clustering of our data sets shows that the relationship between tumor rank and particle accumulation is non-linear and that tumor rank is not always reproducible across tumor replicates. A single, general deterministic definition for particle accumulation is unlikely to found, and as such, makes it difficult to assign a sensitivity and specificity as is common with clustering techniques. Nevertheless, our initial implementation enabled us to determine that there is an inverse relation between particle accumulation number and vascularization rank, and that this holds true for the test data set. While it is still unclear at this time how many features are needed for model improvement, increasing the sample size and feature number is expected to greatly improve the statistical significance of such studies.
In summary, here we present an automated technique for the theoretical modeling of nanotherapeutics delivery based on heterogeneous sets of whole arterial and venous perfusion curves collected at the single vessel level. Unlike conventional perfusion studies, in which tumor tissue and its vasculature are treated as individual homogenous compartments for the extrapolation of pharmacokinetic parameters, tumors were classified and ranked without requiring any underlying assumptions about tissue structure or function, or heterogeneities contained within. The time to arterial peak and venous delay, measured directly from the experimental data, proved sufficient for discriminating between individual tumors. The resulting tumor rankings correlated inversely with experimental nanoparticle accumulation measurements, allowing estimation of nanotherapeutics delivery. With proper calibration, these methodologies may enable the study of a variety of nanoparticles in different tumor models.
Supplementary Material
Video 1. First-pass perfusion of a BCM-2147 tumor following i.v. administration of a 40kDa FITC-dextran bolus. The video was acquired at 30 fps over a 3.2 × 3.2 mm field-of-view using intravital microscopy.
Video 2. First-pass perfusion of a BCM-4195 tumor following i.v. administration of a 40kDa FITC-dextran bolus. The video was acquired at 30 fps over a 3.2 × 3.2 mm field-of-view using intravital microscopy.
Video 3. Frame-by-frame analysis of tracer intensity in selected regions-of-interest (ROIs). ROIs were randomly placed inside 30-60 vessels between branching points. The mean fluorescence intensity for each ROI was measured as a function of time to yield perfusion time-curves for individual vessels. The arterial signal appears first, generally characterized by a rapid increase in fluorescence intensity that plateaus within the first minute, drops off, and levels out. The venous curves demonstrate a delayed and more gradual increase in fluorescence intensity, resulting in a delayed plateau. Heterogeneities in intra-tumoral perfusion are readily observed, manifesting as differences in the shape and timing of the perfusion time-curves.
Acknowledgements
This work was supported by a NIH/NCI Physical Sciences – Oncology Center (PS-OC) Young Investigator Trans-Network Award to AV and HF as a part of the Methodist (U54CA143837) and USC (U54CA143907) PS-OC Centers. LP, ML, and JC acknowledge funding by the NIH (R01CA138197 and U54CA149196-01) and the Breast Cancer Research Foundation. MF acknowledges funding by NIH/NCI PS-OC grant U54CA143837 and additional research support from DoD/BCRP (W81XWH-09-1-0212), NIH/NCI (U54CA151668) and Ernest Cockrell Jr. Distinguished Endowed Chair.
Appendix
Blood flow is commonly modeled by treating arteries as conduits that supply oxygenated blood and veins as conduits that carry away deoxygenated blood. Oxygen and other nutrients are exchanged with tissues at the level of the capillary beds, which are situated between the arteries and veins. Contrast agents injected into the bloodstream circulate through this closed-loop system and can be visualized using a variety of imaging modalities. Contrast agents are generally assumed to remain confined within the vasculature. This is not necessarily true, however, for fenestrated tumors, hemorrhages, strokes, and other pathological conditions, which can introduce significant challenges to the measurement of perfusion curve features [23-27].
The main idea underlying the analysis of perfusion curves is to quantitatively measure the amount of blood flowing through a tissue. The minimum information needed is the concentrated intensity signal of arteries, the concentrated intensity signal of veins, and the spatial volume under consideration. If we consider an inlet of one artery and an outlet of one vein, we can calculate the blood volume based on conservation of mass:
Methods to analyze perfusion curves can be classified into two general categories: deconvolution-based and direct measurement (non-deconvolution) based [23,61]. The first category involves deconvolving the unknown tissue impulse from measurements collected during the first pass of a contrast agent through the tumor and a reference artery. Non-deconvolution techniques extract parameters directly from the whole tissue perfusion curve, which is collected following multiple passes of a contrast agent [23,25,47]. There is currently no technical agreement for when deconvolution-based methods are preferable over direct measurements [61].
To determine blood flow using deconvolution-based methods, the contrast agent signal intensity in the vein is theoretically defined as the convolution of the contrast agent signal intensity of the artery with h(t), which is the probability density function of the transit time t of the blood volume through the capillary bed. The contrast signal intensity of the vein is then computed as follows:
The mean transit time is the first moment of the probability density function h(t):
The function h(t) typically follows a gamma distribution. We note that there exists current research activity with the aim to fit the gamma variate function model and extract its parameters in order to calculate the features of blood perfusion curves [62,63].
The concentration signal intensity in the artery cartery, is the input to the tissue. The tissue response ctissue can then be determined through the convolution of the artery signal and r(t), which is the residue function
Applying deconvolution, this technique enables determining r(t) with the known tissue concentration signal intensity and artery concentration signal intensity. The method provides an accurate solution to find h(t), which enables finding the volume of blood in the tissue, and hence the flow according to:
Using non-deconvolution based methods, the blood volume can be calculated directly from the experimentally obtained perfusion curves as follows:
References
- [1].Jain RK. Determinants of tumor blood flow: a review. Cancer Res. 1988;48:2641–2658. [PubMed] [Google Scholar]
- [2].Vakoc BJ, Lanning RM, Tyrrell JA, Padera TP, Bartlett LA, Stylianopoulos T, Munn LL, Tearney GJ, Fukumura D, Jain RK, Bouma BE. Three-dimensional microscopy of the tumor microenvironment in vivo using optical frequency domain imaging. Nat Med. 2009;15:1219–1223. doi: 10.1038/nm.1971. [DOI] [PMC free article] [PubMed] [Google Scholar]
- [3].Jain RK. Transport of molecules across tumor vasculature. Cancer Metastasis Rev. 1987;6:559–593. doi: 10.1007/BF00047468. [DOI] [PubMed] [Google Scholar]
- [4].Roberts WG, Palade GE. Neovasculature induced by vascular endothelial growth factor is fenestrated. Cancer Res. 1997;57:765–772. [PubMed] [Google Scholar]
- [5].Hashizume H, Baluk P, Morikawa S, McLean JW, Thurston G, Roberge S, Jain RK, McDonald DM. Openings between defective endothelial cells explain tumor vessel leakiness. Am J Pathol. 2000;156:1363–1380. doi: 10.1016/S0002-9440(10)65006-7. [DOI] [PMC free article] [PubMed] [Google Scholar]
- [6].Matsumura Y, Maeda H. A new concept for macromolecular therapeutics in cancer chemotherapy: mechanism of tumoritropic accumulation of proteins and the antitumor agent smancs. Cancer Res. 1986;46:6387–6392. [PubMed] [Google Scholar]
- [7].Maeda H, Wu J, Sawa T, Matsumura Y, Hori K. Tumor vascular permeability and the EPR effect in macromolecular therapeutics: a review. J Control Release. 2000;65:271–284. doi: 10.1016/s0168-3659(99)00248-5. [DOI] [PubMed] [Google Scholar]
- [8].Fang J, Nakamura H, Maeda H. The EPR effect: Unique features of tumor blood vessels for drug delivery, factors involved, and limitations and augmentation of the effect. Advanced Drug Delivery Reviews. 2011;63:136–151. doi: 10.1016/j.addr.2010.04.009. [DOI] [PubMed] [Google Scholar]
- [9].Jain RK, Stylianopoulos T. Delivering nanomedicine to solid tumors. Nat Rev Clin Oncol. 2010;7:653–664. doi: 10.1038/nrclinonc.2010.139. [DOI] [PMC free article] [PubMed] [Google Scholar]
- [10].Pozrikidis C, Farrow DA. A model of fluid flow in solid tumors. Ann Biomed Eng. 2003;31:181–194. doi: 10.1114/1.1540103. [DOI] [PubMed] [Google Scholar]
- [11].Hobbs SK, Monsky WL, Yuan F, Roberts WG, Griffith L, Torchilin VP, Jain RK. Regulation of transport pathways in tumor vessels: role of tumor type and microenvironment. Proc Natl Acad Sci U S A. 1998;95:4607–4612. doi: 10.1073/pnas.95.8.4607. [DOI] [PMC free article] [PubMed] [Google Scholar]
- [12].Duggan ST, Keating GM. Pegylated Liposomal Doxorubicin: A Review of its use in Metastatic Breast Cancer, Ovarian Cancer, Multiple Myeloma and AIDS-Related Kaposi’s Sarcoma. Drugs. 2011;71:2531–2558. doi: 10.2165/11207510-000000000-00000. [DOI] [PubMed] [Google Scholar]
- [13].Godin B, Tasciotti E, Liu X, Serda RE, Ferrari M. Multistage Nanovectors: From Concept to Novel Imaging Contrast Agents and Therapeutics. Accounts of Chemical Research. 2011;44:979–989. doi: 10.1021/ar200077p. [DOI] [PMC free article] [PubMed] [Google Scholar]
- [14].van de Ven A, Kim P, Haley O, Fakhoury J, Adriani G, Schmulen J, Moloney P, Hussain F, Ferrari M, Liu X, Yun S, Decuzzi P. Rapid tumoritropic accumulation of systemically injected plateloid particles and their biodistribution. Journal of Controlled Release. 2012;158:148–155. doi: 10.1016/j.jconrel.2011.10.021. [DOI] [PMC free article] [PubMed] [Google Scholar]
- [15].Parodi A, Quattrocchi N, van de Ven AL, Chiappini C, Martinez JO, Brown BS, Evangelopoulos M, Khaled SZ, Yazdi IK, Enzo MV, Isenhart L, Ferrari M, Tasciotti E. Biomimetic camouflage imparts cell-like activity to synthetic particles. Nature Nanotechnology. 2013;8:61–68. doi: 10.1038/nnano.2012.212. [DOI] [PMC free article] [PubMed] [Google Scholar]
- [16].Michor F, Liphardt J, Ferrari M, Widom J. What does physics have to do with cancer? Nature reviews. 2011;11:657–670. doi: 10.1038/nrc3092. [DOI] [PMC free article] [PubMed] [Google Scholar]
- [17].Uzzan B, Nicolas P, Cucherat M, Perret G r-Y. Microvessel Density as a Prognostic Factor in Women with Breast Cancer. Cancer Research. 2004;64:2941–2955. doi: 10.1158/0008-5472.can-03-1957. [DOI] [PubMed] [Google Scholar]
- [18].Hlatky L, Hahnfeldt P, Folkman J. Clinical Application of Antiangiogenic Therapy: Microvessel Density, What It Does and Doesn’t Tell Us. Journal of the National Cancer Institute. 2002;94:883–893. doi: 10.1093/jnci/94.12.883. [DOI] [PubMed] [Google Scholar]
- [19].Sinha S, Sinha U. Recent advances in breast MRI and MRS. NMR Biomed. 2009;22:3–16. doi: 10.1002/nbm.1270. [DOI] [PubMed] [Google Scholar]
- [20].Jain R. Perfusion CT Imaging of Brain Tumors: An Overview. American Journal of Neuroradiology. 2011;32:1570–1577. doi: 10.3174/ajnr.A2263. [DOI] [PMC free article] [PubMed] [Google Scholar]
- [21].Laking G, Price P. Radionuclide imaging of perfusion and hypoxia. Eur J Nucl Med Mol Imaging. 2010;37(Suppl 1):S20–29. doi: 10.1007/s00259-010-1453-x. [DOI] [PubMed] [Google Scholar]
- [22].Cosgrove D, Lassau N. Imaging of perfusion using ultrasound. Eur J Nucl Med Mol Imaging. 2010;37(Suppl 1):S65–85. doi: 10.1007/s00259-010-1537-7. [DOI] [PubMed] [Google Scholar]
- [23].Fieselmann A, Kowarschik M, Ganguly A, Hornegger J, Fahrig R. Deconvolution-Based CT and MR Brain Perfusion Measurement: Theoretical Model Revisited and Practical Implementation Details. Int J Biomed Imaging. 2011;2011:467–563. doi: 10.1155/2011/467563. [DOI] [PMC free article] [PubMed] [Google Scholar]
- [24].Klotz E, Konig M. Perfusion measurements of the brain: using dynamic CT for the quantitative assessment of cerebral ischemia in acute stroke. Eur J Radiol. 1999;30:170–184. doi: 10.1016/s0720-048x(99)00009-1. [DOI] [PubMed] [Google Scholar]
- [25].Tuominen T. Perfusion Deconvolution via EM Algorithm. Helsiniki University of Technology, Department of Engineering Physics and Mathematics; 2004. [Google Scholar]
- [26].Brix G, Griebel J, Kiessling F, Wenz F. Tracer kinetic modelling of tumour angiogenesis based on dynamic contrast-enhanced CT and MRI measurements. Eur J Nucl Med Mol Imaging. 2010;37(Suppl 1):S30–51. doi: 10.1007/s00259-010-1448-7. [DOI] [PubMed] [Google Scholar]
- [27].Miles KA, Griffiths MR. Perfusion CT: a worthwhile enhancement? Br J Radiol. 2003;76:220–231. doi: 10.1259/bjr/13564625. [DOI] [PubMed] [Google Scholar]
- [28].Konstas AA, Goldmakher GV, Lee TY, Lev MH. Theoretic basis and technical implementations of CT perfusion in acute ischemic stroke, part 2: technical implementations. AJNR Am J Neuroradiol. 2009;30:885–892. doi: 10.3174/ajnr.A1492. [DOI] [PMC free article] [PubMed] [Google Scholar]
- [29].Kudo K, Sasaki M, Yamada K, Momoshima S, Utsunomiya H, Shirato H, Ogasawara K. Differences in CT perfusion maps generated by different commercial software: quantitative analysis by using identical source data of acute stroke patients. Radiology. 2010;254:200–209. doi: 10.1148/radiol.254082000. [DOI] [PubMed] [Google Scholar]
- [30].Hermoye L, Annet L, Lemmerling P, Peeters F, Jamar F, Gianello P, Van Huffel S, Van Beers BE. Calculation of the renal perfusion and glomerular filtration rate from the renal impulse response obtained with MRI. Magn Reson Med. 2004;51:1017–1025. doi: 10.1002/mrm.20026. [DOI] [PubMed] [Google Scholar]
- [31].Kind T, Houtzager I, Faes TJ, Hofman MB. Evaluation of model-independent deconvolution techniques to estimate blood perfusion. Conf Proc IEEE Eng Med Biol Soc. 2010;2010:2602–2607. doi: 10.1109/IEMBS.2010.5626615. [DOI] [PubMed] [Google Scholar]
- [32].Reddick WE, Taylor JS, Fletcher BD. Dynamic MR imaging (DEMRI) of microcirculation in bone sarcoma. J Magn Reson Imaging. 1999;10:277–285. doi: 10.1002/(sici)1522-2586(199909)10:3<277::aid-jmri8>3.0.co;2-s. [DOI] [PubMed] [Google Scholar]
- [33].Sahani DV, Kalva SP, Hamberg LM, Hahn PF, Willett CG, Saini S, Mueller PR, Lee T-Y. Assessing Tumor Perfusion and Treatment Response in Rectal Cancer with Multisection CT: Initial Observations1. Radiology. 2005;234:785–792. doi: 10.1148/radiol.2343040286. [DOI] [PubMed] [Google Scholar]
- [34].Dunnwald LK, Gralow JR, Ellis GK, Livingston RB, Linden HM, Specht JM, Doot RK, Lawton TJ, Barlow WE, Kurland BF, Schubert EK, Mankoff DA. Tumor metabolism and blood flow changes by positron emission tomography: relation to survival in patients treated with neoadjuvant chemotherapy for locally advanced breast cancer. J Clin Oncol. 2008;26:4449–4457. doi: 10.1200/JCO.2007.15.4385. [DOI] [PMC free article] [PubMed] [Google Scholar]
- [35].Tozer GM, Ameer-Beg SM, Baker J, Barber PR, Hill SA, Hodgkiss RJ, Locke R, Prise VE, Wilson I, Vojnovic B. Intravital imaging of tumour vascular networks using multi-photon fluorescence microscopy. Adv Drug Deliv Rev. 2005;57:135–152. doi: 10.1016/j.addr.2004.07.015. [DOI] [PubMed] [Google Scholar]
- [36].Jain RK, Munn LL, Fukumura D. Dissecting tumour pathophysiology using intravital microscopy. Nature reviews. 2002;2:266–276. doi: 10.1038/nrc778. [DOI] [PubMed] [Google Scholar]
- [37].Kamoun WS, Chae SS, Lacorre DA, Tyrrell JA, Mitre M, Gillissen MA, Fukumura D, Jain RK, Munn LL. Simultaneous measurement of RBC velocity, flux, hematocrit and shear rate in vascular networks. Nat Methods. 2010;7:655–660. doi: 10.1038/nmeth.1475. [DOI] [PMC free article] [PubMed] [Google Scholar]
- [38].Brown EB, Campbell RB, Tsuzuki Y, Xu L, Carmeliet P, Fukumura D, Jain RK. In vivo measurement of gene expression, angiogenesis and physiological function in tumors using multiphoton laser scanning microscopy. Nat Med. 2001;7:864–868. doi: 10.1038/89997. [DOI] [PubMed] [Google Scholar]
- [39].Yuan F, Dellian M, Fukumura D, Leunig M, Berk DA, Torchilin VP, Jain RK. Vascular permeability in a human tumor xenograft: molecular size dependence and cutoff size. Cancer Res. 1995;55:3752–3756. [PubMed] [Google Scholar]
- [40].Lichtenbeld HC, Yuan F, Michel CC, Jain RK. Perfusion of single tumor microvessels: application to vascular permeability measurement. Microcirculation. 1996;3:349–357. doi: 10.3109/10739689609148307. [DOI] [PubMed] [Google Scholar]
- [41].Gerlowski LE, Jain RK. Microvascular permeability of normal and neoplastic tissues. Microvasc Res. 1986;31:288–305. doi: 10.1016/0026-2862(86)90018-x. [DOI] [PubMed] [Google Scholar]
- [42].Yuan F, Leunig M, Berk DA, Jain RK. Microvascular permeability of albumin, vascular surface area, and vascular volume measured in human adenocarcinoma LS174T using dorsal chamber in SCID mice. Microvasc Res. 1993;45:269–289. doi: 10.1006/mvre.1993.1024. [DOI] [PubMed] [Google Scholar]
- [43].van de Ven AL, Wu M, Lowengrub J, McDougall S, Chaplain MA, Cristini V, Ferrari M, Frieboes H. Integrated intravital microscopy and mathematical modeling to optimize nanotherapeutics delivery to tumors. AIP Advances. 2012;2 doi: 10.1063/1.3699060. 011208. [DOI] [PMC free article] [PubMed] [Google Scholar]
- [44].Zhang X, Dobrolecki LE, Lai Q, Landis M, Wong H, Tsimelzon A, Claerhout S, Contreras A, Gutierrez C, J H, Wu MF, Pavlick AC, AM F, SG H, GB M, L W, Petrovic I, MF R, R S, JC C, MT L. A Renewable Tissue Resource of Phenotypically Stable Human Breast Cancer Xenografts for Preclinical Studies. Cancer Research. 2011;71 doi: 10.1158/0008-5472.CAN-12-4081. P5-21-01. [DOI] [PMC free article] [PubMed] [Google Scholar]
- [45].Bezdek JC, Ehrlich R, Full W. FCM: The fuzzy c-means clustering algorithm. Computers & Geosciences. 1984;10:191–203. [Google Scholar]
- [46].Goldberg DE. Genetic Algorithms in Search, Optimization and Machine Learning. Addison-Wesley Longman Publishing Co., Inc.; 1989. [Google Scholar]
- [47].Sra S, Nowozin S, Wright SJ. Optimization for machine learning. MIT Press; Cambridge, Mass.: 2012. [Google Scholar]
- [48].Schnall MD, Blume J, Bluemke DA, DeAngelis GA, DeBruhl N, Harms S, Heywang-K√ôbrunner SH, Hylton N, Kuhl CK, Pisano ED, Causer P, Schnitt SJ, Thickman D, Stelling CB, Weatherall PT, Lehman C, Gatsonis CA. Diagnostic Architectural and Dynamic Features at Breast MR Imaging: Multicenter Study1. Radiology. 2006;238:42–53. doi: 10.1148/radiol.2381042117. [DOI] [PubMed] [Google Scholar]
- [49].Huang W, Fisher PR, Dulaimy K, Tudorica LA, O, ÄôHea B, Button TM. Detection of Breast Malignancy: Diagnostic MR Protocol for Improved Specificity1. Radiology. 2004;232:585–591. doi: 10.1148/radiol.2322030547. [DOI] [PubMed] [Google Scholar]
- [50].Tofts PS, Brix G, Buckley DL, Evelhoch JL, Henderson E, Knopp MV, Larsson HB, Lee TY, Mayr NA, Parker GJ, Port RE, Taylor J, Weisskoff RM. Estimating kinetic parameters from dynamic contrast-enhanced T(1)-weighted MRI of a diffusable tracer: standardized quantities and symbols. J Magn Reson Imaging. 1999;10:223–232. doi: 10.1002/(sici)1522-2586(199909)10:3<223::aid-jmri2>3.0.co;2-s. [DOI] [PubMed] [Google Scholar]
- [51].Sorensen AG, Emblem KE, Polaskova P, Jennings D, Kim H, Ancukiewicz M, Wang M, Wen PY, Ivy P, Batchelor TT, Jain RK. Increased survival of glioblastoma patients who respond to antiangiogenic therapy with elevated blood perfusion. Cancer Res. 2012;72:402–407. doi: 10.1158/0008-5472.CAN-11-2464. [DOI] [PMC free article] [PubMed] [Google Scholar]
- [52].Chauhan VP, Stylianopoulos T, Martin JD, Popovic Z, Chen O, Kamoun WS, Bawendi MG, Fukumura D, Jain RK. Normalization of tumour blood vessels improves the delivery of nanomedicines in a size-dependent manner. Nat Nanotechnol. 2012;7:383–388. doi: 10.1038/nnano.2012.45. [DOI] [PMC free article] [PubMed] [Google Scholar]
- [53].van de Ven AL, Landis M, Paskett L, Chang J, Ferrari M. Submitted Flow-dependent tumoritropic delivery of multi-stage vectors in triple-negative breast cancer biopsies. JCR [Google Scholar]
- [54].van de Ven A, Kim P, Ferrari M, Yun SH. Submitted Real-time intravital microscopy of individual nanoparticle dynamics in the liver and tumors of live mice. Nature Protocols [Google Scholar]
- [55].Law M, Young RJ, Babb JS, Peccerelli N, Chheang S, Gruber ML, Miller DC, Golfinos JG, Zagzag D, Johnson G. Gliomas: Predicting Time to Progression or Survival with Cerebral Blood Volume Measurements at Dynamic Susceptibility-weighted Contrast-enhanced Perfusion MR Imaging1. Radiology. 2008;247:490–498. doi: 10.1148/radiol.2472070898. [DOI] [PMC free article] [PubMed] [Google Scholar]
- [56].Law M, Yang S, Babb JS, Knopp EA, Golfinos JG, Zagzag D, Johnson G. Comparison of Cerebral Blood Volume and Vascular Permeability from Dynamic Susceptibility Contrast-Enhanced Perfusion MR Imaging with Glioma Grade. American Journal of Neuroradiology. 2004;25:746–755. [PMC free article] [PubMed] [Google Scholar]
- [57].Jain R, Ellika SK, Scarpace L, Schultz LR, Rock JP, Gutierrez J, Patel SC, Ewing J, Mikkelsen T. Quantitative Estimation of Permeability Surface-Area Product in Astroglial Brain Tumors Using Perfusion CT and Correlation with Histopathologic Grade. American Journal of Neuroradiology. 2008;29:694–700. doi: 10.3174/ajnr.A0899. [DOI] [PMC free article] [PubMed] [Google Scholar]
- [58].Law M, Oh S, Johnson G, Babb JS, Zagzag D, Golfinos J, Kelly PJ. Perfusion magnetic resonance imaging predicts patient outcome as an adjunct to histopathology: a second reference standard in the surgical and nonsurgical treatment of low-grade gliomas. Neurosurgery. 2006;58:1099–1107. doi: 10.1227/01.NEU.0000215944.81730.18. discussion 1099-1107. [DOI] [PubMed] [Google Scholar]
- [59].Wu M, Frieboes HB, McDougall S, Chaplain MA, Cristini V, Lowengrub J. The effect of interstitial pressure on tumor growth: coupling with the blood and lymphatic vascular systems. J Theor Biol. 2012 doi: 10.1016/j.jtbi.2012.11.031. In Press. [DOI] [PMC free article] [PubMed] [Google Scholar]
- [60].Frieboes HB, Wu M, Lowengrub J, Decuzzi P, Cristini V. A computational model for predicting nanoparticle accumulation in tumor vasculature. PLoS ONE. 2013 doi: 10.1371/journal.pone.0056876. In Press. [DOI] [PMC free article] [PubMed] [Google Scholar]
- [61].Abels B, Klotz E, Tomandl BF, Kloska SP, Lell MM. Perfusion CT in acute ischemic stroke: a qualitative and quantitative comparison of deconvolution and maximum slope approach. AJNR Am J Neuroradiol. 2010;31:1690–1698. doi: 10.3174/ajnr.A2151. [DOI] [PMC free article] [PubMed] [Google Scholar]
- [62].Chan AA, Nelson SJ. Simplified gamma-variate fitting of perfusion curves. Biomedical Imaging: Nano to Macro, 2004. IEEE International Symposium on.2004. pp. 1067–1070. [Google Scholar]
- [63].Madsen MT. A simplified formulation of the gamma variate function. Physics in Medicine and Biology. 1992;37:1597. [Google Scholar]
Associated Data
This section collects any data citations, data availability statements, or supplementary materials included in this article.
Supplementary Materials
Video 1. First-pass perfusion of a BCM-2147 tumor following i.v. administration of a 40kDa FITC-dextran bolus. The video was acquired at 30 fps over a 3.2 × 3.2 mm field-of-view using intravital microscopy.
Video 2. First-pass perfusion of a BCM-4195 tumor following i.v. administration of a 40kDa FITC-dextran bolus. The video was acquired at 30 fps over a 3.2 × 3.2 mm field-of-view using intravital microscopy.
Video 3. Frame-by-frame analysis of tracer intensity in selected regions-of-interest (ROIs). ROIs were randomly placed inside 30-60 vessels between branching points. The mean fluorescence intensity for each ROI was measured as a function of time to yield perfusion time-curves for individual vessels. The arterial signal appears first, generally characterized by a rapid increase in fluorescence intensity that plateaus within the first minute, drops off, and levels out. The venous curves demonstrate a delayed and more gradual increase in fluorescence intensity, resulting in a delayed plateau. Heterogeneities in intra-tumoral perfusion are readily observed, manifesting as differences in the shape and timing of the perfusion time-curves.