

Abstract
Endometrial cancer is the most common malignancy of the female genital tract in developed countries. To identify genetic variants associated with endometrial cancer risk, we undertook a genome-wide association study involving 1,265 endometrial cancer cases from Australia and the UK and 5,190 controls from the Wellcome Trust Case Control Consortium. Genotype frequencies in cases and controls were compared for 519,655 SNPs. Forty-seven SNPs that showed evidence of association with endometrial cancer in stage 1 were genotyped in 3,957 additional cases and 6,886 controls. We identified an endometrial cancer susceptibility locus close to HNF1B on chromosome 17q (SNP rs4430796: P=7.1×10⁻¹⁰), that is also associated with risk of prostate cancer and is inversely associated with type 2 diabetes.
Cancer of the uterine corpus, endometrial cancer, is the most common invasive gynecological cancer in developed countries, with more than 280,000 cases annually worldwide1. The prognosis is considered favourable for the most common histological subtype, endometrioid endometrial cancer, representing 80–90% of all endometrial cancers. Nevertheless, the disease associated with significant morbidity due to surgery and radiotherapy2, and treatment is often complicated because most patients present at older ages and with significant co-morbidities.
Genome-wide association studies (GWAS) have successfully identified common genetic variants associated with modestly increased risks for numerous complex diseases, with more than 150 published hits at P<10−7 for common cancers3. These findings provide evidence that common variants are responsible, at least in part, for the increased familial risk of cancer4,5. Family history of endometrial cancer is associated with increased risk of the disease6–8. Although germline mutations in mismatch repair genes confer a substantial risk of endometrial cancer in the context of the Lynch syndrome, these are rare9. Candidate gene association studies have implicated CYP19A1 as a common endometrial cancer susceptibility locus with modest effect10,11, but no GWAS of endometrial cancer have been undertaken to date.
We have conducted a GWAS using endometrial cancer cases from Australia and the UK. To reduce the potential effects of disease heterogeneity, we selected cases with endometrioid histology for genotyping using the Human 610K array on the Illumina Infinium platform. Control data, for SNPs included on the 610K platform, were extracted from existing Illumina 1.2M genome-wide scan data for Caucasian controls from two UK population-based studies genotyped by the Wellcome Trust Case Control Consortium12. After applying standard quality control measures (see Methods), data on 519,655 SNPs for 1,265 cases and 5,190 controls were used in the analysis. Genotype frequencies were compared between cases and controls using a 1-degree-of-freedom Cochran-Armitage trend test. The test statistic inflation factor λ was 1.04 after adjustment for population stratification using the principal components approach13 (Supplementary Fig. 1). Following review of clustering plots to eliminate likely artefactual associations, 130 SNPs were significant at P<10−4 versus ~52 SNPs expected by chance. Redundant SNPs were eliminated (see Methods). In total, 49 SNPs were selected for follow-up in stage 2, of which 47 passed genotype quality control (Supplementary Table 1). Data were collated from up to 3,957 endometrial cancer cases and 6,886 controls of Caucasian ancestry from 10 centers, with genotypes generated specifically for this study, or data derived from existing genome-wide association scans (Supplementary Table 2).
After combining results from stage 1 and stage 2 (Supplementary Table 1), three SNPs were significant at the P<10−7 level. All three lie in a region of linkage disequilibrium (pairwise r2 range 0.68 – 0.90 in Europeans) encompassing the first four exons of HNF1B on chromosome 17q12 (Table 1, http://www.hapmap.org.uk). The most significant association was for rs4430796 (OR per G-allele =0.84, CI=0.79–0.89, P=7.1×10⁻¹⁰). There was no significant heterogeneity in the per-allele OR between stages 1 and 2 (stage 1 OR=0.79, CI=0.73–0.87; stage 2 OR=0.87, CI=0.81–0.94; heterogeneity P=0.11), or among the five stage 2 studies in which it was genotyped (heterogeneity P=0.75) (Fig. 1). There was no significant deviation from the multiplicative, per-allele model (P=0.74). Restricting stage 2 of the analysis to cancers with an endometrioid histology (1,786 of 2,332 cases genotyped for this SNP) slightly strengthened the effect (Stage 2 OR=0.84, CI=0.77–0.91, overall P=4.3×10⁻¹¹; Table 1). The three HNF1B SNPs were not significantly associated with non-endometrioid disease (Table 1), although the numbers of cases were small. In addition, 832 cases and 2,049 controls of Chinese ancestry from Shanghai (Supplementary Table 2) were genotyped for rs11651755, a surrogate for rs4430796 (Hapmap r2=1.0 in the CHB population). The estimated effect for rs11651755 in this Asian study was OR=0.96 (CI=0.84–1.09, P=0.55).
Table 1.
Association between genotype and endometrial cancer for three SNPs in the HNF1B gene
| Marker | Chromosome Position | Stage | Case N | Control N | Case MAF | Control MAF | Stage per-allele OR (95% CI) | Stage P-value | Combined per-allele OR (95% CI) | Combined P-value |
|---|---|---|---|---|---|---|---|---|---|---|
| rs4430796 A/G | 17 33,172,153 | Stage 1 | 1262 | 5179 | 0.43 | 0.48 | 0.79 (0.73–0.87) | 3.06E-07 | ||
| Stage 2 all cases | 2332 | 4349 | 0.44 | 0.48 | 0.87 (0.81–0.94) | 2.00E-04 | 0.84 (0.79–0.89) | 7.11E-10 | ||
| Stage 2 endometrioid cases | 1786 | 4349 | 0.43 | 0.48 | 0.84 (0.77–0.91) | 2.56E-05 | 0.82 (0.77–0.87) | 4.28E-11 | ||
| Stage 2 non-endometrioid cases | 484 | 4349 | 0.46 | 0.48 | 0.94 (0.82–1.08) | 3.74E-01 | ||||
|
| ||||||||||
| rs4239217 A/G | 17 33,173,100 | Stage 1 | 1265 | 5190 | 0.35 | 0.41 | 0.79 (0.72–0.86) | 2.48E-07 | ||
| Stage 2 all cases | 2342 | 4307 | 0.37 | 0.40 | 0.89 (0.82–0.96) | 2.00E-03 | 0.84 (0.80–0.90) | 1.19E-08 | ||
| Stage 2 endometrioid cases | 1753 | 4307 | 0.36 | 0.40 | 0.86 (0.79–0.94) | 5.90E-04 | 0.83 (0.78–0.88) | 1.27E-09 | ||
| Stage 2 non-endometrioid cases | 588 | 4307 | 0.39 | 0.40 | 0.97 (0.85–1.10) | 6.18E-01 | ||||
|
| ||||||||||
| rs7501939 G/A | 17 33,175,269 | Stage 1 | 1263 | 5187 | 0.36 | 0.40 | 0.80 (0.73–0.88) | 2.17E-06 | ||
| Stage 2 all cases | 3337 | 5234 | 0.37 | 0.40 | 0.90 (0.84–0.96) | 1.00E-03 | 0.86 (0.82–0.91) | 5.35E-08 | ||
| Stage 2 endometrioid cases | 2562 | 5234 | 0.36 | 0.40 | 0.88 (0.82–0.94) | 3.30E-04 | 0.85 (0.80–0.90) | 7.57E-09 | ||
| Stage 2 non-endometrioid cases | 690 | 5234 | 0.38 | 0.40 | 0.95 (0.85–1.07) | 4.29E-01 | ||||
Minor Allele Frequency
Figure 1.
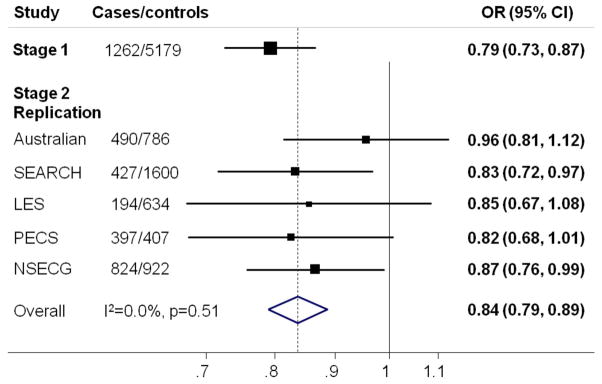
Forest plot showing the association between SNP rs4430796 and endometrial cancer for each component of the study. OR=odds ratio. Study abbreviations are as given in Supplementary Table 2. SEARCH and Australian Stage2 replication sets exclude samples included in Stage 1. The solid line denotes the null, and the dashed line indicates the overall OR estimate. I2 measures the heterogeneity in effect size between studies36
The only SNP outside the HNF1B region to reach P<10−5 was rs673604 on 1p34, located 29kB centromeric of SFPQ (combined OR=1.21, CI=1.12–1.32, P=5.9×10⁻⁶). Although highly significant in stage 1 (P=6.1×10⁻⁷), it showed only weak evidence for association in stage 2 (P=0.041). This stage 2 result was similar when restricted to cases with endometrioid histology (P=0.049, combined OR=1.23, CI=1.12–1.34; P=4.6×10⁻⁶) or non-endometrioid histology (stage 2 OR=1.07, CI=0.88–1.30, P=0.50) (Supplementary Tables 3 and 4. Further large studies will be required to determine whether this association is genuine. Results for the remaining SNPs investigated in stage 2 were also little different when analyses were restricted to cases of endometrioid or non-endometrioid subtype; three SNPs showed significant differences in frequencies between cases with and without endometrioid histology (P<0.05), in line with what would be expected by chance (Supplementary Table 3 and 4).
Multiple studies have independently reported the G allele of SNP rs4430796, associated with decreased risk of endometrial cancer in this study, to be associated with a decreased risk of prostate cancer14–16. A recent meta-analysis estimated an OR per G-allele of 0.79 (0.76–0.83) for prostate cancer17, but found no association of the same allele with breast, lung, colorectal or pancreatic cancers or melanoma17. The same SNP allele has also been identified by GWAS to be associated with an increased risk of type 2 diabetes (per G-allele OR=1.10 (1.06–1.15)15, and OR 1.14 (1.08–1.20)18). There is evidence of an inverse correlation between type 2 diabetes and prostate cancer risk19, but the association between HNF1B SNPs and prostate cancer does not appear to be mediated by history of diabetes20. Increased body mass index (BMI) is a major risk factor for both type 2 diabetes and endometrial cancer, and there is a positive correlation between type 2 diabetes and endometrial cancer risk21–24. However, the opposite direction of the effects indicates that the association between rs4430796 and endometrial cancer risk is not mediated through BMI or type 2 diabetes. In addition, in the subset of endometrial case-control studies where BMI is recorded, adjusting for BMI did not materially alter the risk estimate (OR=0.87 (0.78–0.97) versus OR=0.88 (0.79–0.99); n=3055).
To provide a more comprehensive analysis of SNPs in the HNF1B region, we identified variants in the region using resequencing data in individuals with European ancestry from the 1000 genomes project, and performed association analyses for all SNPs using genotypes imputed from the stage 1 data. We identified 20 SNPs associated with endometrial cancer at P<10−5, the most significant being rs11651755 (Supplementary Table 5). All these SNPs are strongly correlated with rs4430796 (r2>0.45). It is plausible therefore that one or more of these variants is functionally associated with endometrial cancer risk.
The common haplotypes formed by the 33 SNPs from the 1000 Genomes project are well tagged by the six SNPs genotyped in Stage 1 of our study (rs757210, rs4430796, rs4239217, rs7501939, rs3760511, and rs1762642). For example, the rare allele of rs11651755 appears to always occur on the same haplotype as the rare allele of rs4430796. We found no evidence of specific haplotype effects at this locus; the haplotypes carrying the common A allele at rs4430796 were all more frequent in cases than controls, and the reverse was true for three of four haplotypes carrying the protective G allele (Supplementary Table 6).
HNF1B (also known as TCF2, LFB3 MODY5, and VHNF1) encodes a member of the homeodomain-containing superfamily of transcription factors. The gene encodes three isoforms with A and B considered to act as transcription activators, and isoform C as a transcriptional repressor25. Abrogating mutations in HNF1B result in diabetes phenotypes, including maturity-onset diabetes of the young subtype 5 (MODY5), as well as renal cysts. Of relevance to endometrial cancer, microdeletions encompassing HNF1B have been reported in Mayer-Rokitansky-Kuster-Hauser syndrome characterized by congenital aplasia of the uterus and upper vagina due to anomalous development of the Mullerian ducts26, and HNF1B mutations/deletions are associated with uterine abnormalities due to incomplete Mullerian duct fusion and Mullerian duct aplasia27. Human embryonic gene expression studies have shown that HNF1B expression occurs during early development of the human urogenital tract, with expression maintained in Wolffian duct derivatives but not in Mullerian duct deriviatives28. In contrast, HNF1B over-expression has been reported to be a biomarker of clear cell carcinoma of the pancreas29, and of clear cell carcinoma of the ovary and its probable precursor ovarian endometriosis30–33. There is also evidence to suggest that HNF1B isoform usage may be altered in prostate cancer tissue, with upregulated HNF1B isoform B expression in prostate cancer tissue compared to benign tissue34. Analysis of several lymphocyte-derived gene expression datasets (See Supplementary Fig. 2) reveals significant associations between rs4430796 genotype and HNF1B expression in individuals of European ancestry, but not for individuals of African ancestry. These observations suggest that HNF1B may underlie the observed association with endometrial cancer risk, but that rs4430796 is unlikely to be the causal SNP driving the association.
GWAS have so far identified 29 prostate cancer loci in addition to HNF1B35 but none of the others revealed any evidence of association with endometrial cancer in this study (Supplementary Table 7). Further common low penetrant endometrial cancer loci are likely to be identifiable through larger collaborative GWAS and follow-up studies. The independent discovery of a common risk allele for both prostate cancer and endometrial cancer indicates some shared etiology between these two diseases that had not previously been recognized, and highlights the value of the agnostic GWAS approach for identifying previously unexplored biological pathways and novel molecular targets for prevention.
ONLINE METHODS
Samples
Stage 1 and 2 sample sets are described in Supplementary Table 2, and in the Supplementary Note.
The final stage 1 case sample set included 1265 endometrioid endometrial cancer cases with self-reported European ancestry from the Australian National Endometrial Cancer Study (ANECS, n=599), or the Studies of Epidemiology and Risk factors in Cancer Heredity (SEARCH, n=666) in the United Kingdom. Control samples were genotyped as part of the Wellcome Trust Case Control Consortium (WTCCC212). The final stage 1 control set included 5190 controls with valid genotype data available at the time of analysis.
Stage 2 encompassed a total of 3,957 cases and 6,886 controls from nine countries, including additional Caucasian cases from ANECS and SEARCH cases and female controls from these studies (Supplementary Table 2, Supplementary text).
Genotyping and Quality Control
Genotypes for stage 1 cases were generated using an Illumina Infinium 610k array, and called using the Illumina GenCall algorithm. Controls were genotyped using an Illumina Infinium 1.2M array as part of WTCCC2, and called using the Illuminus algorithm, using genotypes that were successfully called with posterior probability >0.9537. Analyses were restricted to 519,655 SNPs meeting the following criteria; call rate ≥95% if MAF ≥5%, (or ≥99% if MAF<5%), HWE P>10−12 (cases), or HWE P>10−7 with no difference in frequency between the two WTCCC2 control groups at P<10−6 (controls). Duplicate concordance was 99.998%.
Genotypes were available for 1344 endometrial cancer cases. A subset of individuals were identified for exclusion as follows: two individuals with probable Turner’s Syndrome and two males, based on genotypes for markers on the X and Y chromosomes; samples with call rate<97% (n=14); samples with heterozygosity <0.65 or >0.68 (n=11); the sample with the lower call rate from 2 probable sibling pairs and 26 duplicate pairs, identified as close relatives by identity-by-state probabilities >0.85; 8 individuals with >15% non-European ancestry as indicated from computing IBS scores between participants and individuals in HapMap and multidimensional scaling. Twenty-one cases were also excluded from the final analysis of stage 1 because of unresolved discrepancies between their stage 1 and stage 2 genotypes (see Statistical Methods), leaving 1265 cases. The WTCCC2 control data (5,190 individuals) had been cleaned for a previous study38 to remove probable close relatives, and individuals with >15% estimated non-European ancestry, low or high heterozygosity (<0.65 or >0.68) or call rate<97%.
Genotyping for stage 2 was performed as indicated in supplementary Table 2. All studies complied with quality control standards by including ≥ 2 no DNA template controls per 384-well assay plate, ≥ 2% of samples in duplicate, genotyping call rate > 95%, and ≥ 98% concordance between duplicated samples for each SNP assay. Raw data was reviewed for sample sets with evidence for departure from Hardy-Weinberg equilibrium (HWE) using the Chi-squared test (1 df), as a marker of poor genotyping quality. Plates or studies with HWE P< 0.0001 were automatically excluded from combined analysis.
Statistical methods
Stage 1 genotype frequencies were compared between cases and controls using the 1 degree of freedom Cochran-Armitage trend (per-allele) test. Population stratification was adjusted for using the first three principal components of the genomic kinship matrix, as estimated using 28,494 uncorrelated SNPs (r2<0.1). The inflation factor was computed from the lower 90% of the χ2 statistics.
The 49 SNPs genotyped in stage 2 were chosen from the top 200 stage 1 SNPs, after assessing genotyping quality using the cluster plots. In the case of correlated SNPs within a region, multiple logistic regression was used to select the best candidate(s) for stage 2. For the most strongly associated SNP (rs4239217), we included a second correlated SNP (rs4430796).
1275 case samples (585 ANECS and 680 SEARCH) were genotyped in stages 1 and 2, allowing us to check between-stage genotyping concordance. For two SNPs (rs4862110 and rs3019885), both of which had appeared to be highly significant in stage 1, the concordance was very poor (86.2% and 86.7% respectively, similar in the ANECS and SEARCH sets). These discrepancies appeared to be due to poor genotyping of these SNPs on the Illumina 610K platform. Therefore we removed both SNPs from the analyses. After exclusion of these two SNPs, 21 samples showed poor overall concordance and were excluded from the final analysis of stage 1, with no important differences from the original analysis. For the remaining samples there was a maximum of 1 discordancy per sample. The 1275 samples genotyped in both stages were included only in the stage 1 analysis.
Stage 2 genotype frequencies were compared between cases and controls using the 1 degree of freedom trend test and the 2 degree of freedom genotype test, with odds ratios and 95% confidence intervals estimated using unconditional logistic regression, stratified by study. Heterogeneity between studies was expressed using the I2 statistic. Results from stages 1 and 2 were combined using a fixed-effects analysis. Stage 2 data were also analysed separately for the subgroups of cases with or without endometrioid histology, and the genotype frequencies in these two groups were compared in a case-only analysis.
The pattern of LD in the 50kb around rs4430796 was examined using genotypes obtained from the 1000 Genomes Project (August 2010 release)39 No SNPs outside a 15.3kb block had an r2>0.2 with rs4430796. This region contained 42 SNPs, 6 of which had been genotyped in stage 1 of our study. Non-genotyped SNPs were imputed for all stage 1 samples using the 1000 Genomes Project data as a reference panel. Imputed genotype dosages were compared between cases and controls, adjusting for the first 3 principal components of the genomic kinship matrix. Haplotype frequencies based on the genotyped SNPs were compared between cases and controls.
Analyses were performed in R (including GenABEL40 and SNPMatrix41), ProbABEL42, MACH43, Haploview 44 and Stata (R, http://www.r-project.org/; Stata, http://www.stata.com/). All statistical tests were 2-sided.
Supplementary Material
Acknowledgments
This work was supported by the National Health and Medical Research Council (ID#552402), The Wellcome Trust and by Cancer Research UK grants C1287/A10118, C490/A1021, C8197/A10865 & C8197/A10123. A.B.S. and P.W are NHMRC Senior Research Fellows, and G.M is an NHMRC Senior Principle Research Fellow. T.O’M. is supported by an Australian Postgraduate Award, an Institute of Health and Biomedical Innovation PhD Top-Up and a Smart State PhD Award. L.C.W. is a John Gavin Postdoctoral Fellow (Genesis Oncology Trust, New Zealand). D.F.E. is a Principal Research Fellow of Cancer Research UK. A.M.D is supported by the Joseph Mitchell Trust. I.T. is supported by Cancer Research UK and the Oxford Comprehensive Biomedical Research Centre. P.A.F. was partly funded by the Dr Mildred Scheel Stiftung of the Deutsche Krebshilfe (German Cancer Aid).
This study makes use of data generated by the Wellcome Trust Case Control Consortium (WTCCC) 2. A full list of the investigators who contributed to the generation of the data is available from the WTCCC website. We acknowledge use of DNA from the British 1958 Birth Cohort collection, funded by the Medical Research Council grant G0000934 and the Wellcome Trust grant 068545/Z/02. Funding for this project was provided by the Wellcome Trust under award 085475.
We thank study participants and collaborators, and the research teams involved in design and implementation of the individual studies included (See supplementary text for full list of collaborators, and specific acknowledgements). ANECS recruitment was supported by project grants from the National Health and Medical Research Council of Australia (ID#339435), The Cancer Council Queensland (ID#4196615) and Cancer Council Tasmania (ID#403031 and ID#457636). The Bavarian Endometrial Cancer Study (BECS) was partly funded by the ELAN fund of the University of Erlangen. The Leuven Endometrium Study (LES) was supported by the Verelst Foundation for endometrial cancer. MoMaTEC received financial support from a Helse Vest Grant, the University of Bergen, Melzer Foundation, The Norwegian Cancer Society (Harald Andersens legat), The Research Council of Norway and Haukeland University Hospital. The Newcastle Endometrial Cancer Study (NECS) acknowledges contributions from the University of Newcastle, The NBN Children’s Cancer Research Group, Ms Jennie Thomas and the Hunter Medical Research Institute. The National Study of Endometrial Cancer Genetics Group was supported principally by Cancer Research UK and by funds from the Oxford Comprehensive Biomedical Research Centre, with core infrastructure support to the Wellcome Trust Centre for Human Genetics, Oxford provided by grant 075491/Z/04. The Polish Endometrial Cancer Study (PECS) was funded by the intramural research program at the US National Cancer Institute, Division of Cancer Epidemiology and Genetics in the Hormonal and Reproductive Epidemiology Branch. The Singapore and Swedish Breast/Endometrial Cancer Study (SASBAC) was supported by funding from the Agency for Science, Technology and Research of Singapore (A*STAR), the US National Institute of Health (NIH) and the Susan G. Komen Breast Cancer Foundation. The Shanghai Endometrial Cancer Genetic Study (SECGS) was supported by grants from the National Cancer Institute of United States Public Health Service (RO1 CA 092585 and R01 CA90899, R01 CA64277). SEARCH is funded by a programme grant from Cancer Research UK [C490/A10124].
Footnotes
Author Contributions
A.B.S., D.F.E., G.M and P.M.W. obtained funding for the study.
A.B.S. and D.F.E designed the study and A.B.S. and D.J.T. drafted the manuscript.
P.F. and K.M conducted preliminary analysis, and D.F.E. and D.J.T. conducted the final statistical analyses.
A.B.S. and P.M.W coordinated the Australian National Endometrial Cancer Study (ANECS). P.D.P.P. and D.F.E. coordinated Studies of Epidemiology and Risk Factors in Cancer Heredity (SEARCH).
A.B.S., K.F. and T.O’M. co-ordinated the ANECS stage 1 genotyping.
A.M.D., S.A., and C.S.H. co-ordinated the SEARCH stage 1 genotyping.
L.C.W., S.B.M. and E.T.D conducted analyses to assess correlations between genotype and gene expression.
J.M. provided data management and bioinformatics support.
T.O’M. and K.F. co-ordinated the ANECS and other Brisbane-based stage 2 genotyping, and assisted with data management.
S.A., C.S.H. and A.M.D. coordinated the stage 2 genotyping of the SEARCH samples.
D.L., P.H., K.C., J.Liu, J.Li, I.T., K.H., M.G-C., N.W., H.Y., S.C., X-O.S. and J.Long. co-ordinated the stage 2 genotyping, or extraction of existing genotype data, for the LES, SASBAC, NSECG, PECS and SECGS samples.
The following authors co-ordinated the baseline studies, and/or extraction of questionnaire and clinical information for studies included in stage 2 analysis: BECS- P.A.F., M.W.B., A.H. and A.B.E; LES - D.L., L.C., I.V. and F.A.; MoMaTEC - H.B.S., J.T., H.H., T.S.N.; NECS - R.J.S., K.A., T.P., and G.O.; NSECG - I.T., K.H., M.G., S.H.; PECS – M.G-C. H.Y., N.W.; SASBAC - P.H., K.C., J.Li; SECGS – X-O.S and W.Z (principal investigators), J.Long. (principal study geneticist), and Y-B.X (site principal investigator at the Shanghai Cancer Institute).
All authors provided critical review of the manuscript.
Competing financial interests
The authors declare no competing financial interests.
URLs
Australian National Endometrial Cancer Study (ANECS); http://www.anecs.org.au/index.html
Gene Expression Variation (Genevar), http://www.sanger.ac.uk/resources/software/genevar
HapMap; http://hapmap.ncbi.nlm.nih.gov/
The Studies of Epidemiology and Risk factors in Cancer Heredity (SEARCH); http://www.srl.cam.ac.uk/search/Homepage.htm
Welcome Trust Case Control Consortium (WTCCC); http://www.wtccc.org.uk/
References
- 1.Ferlay J, et al. IARC, editor. CancerBase No. 10 [Internet] Vol. 2010. International Agency for Research on Cancer Lyon; France: 2010. GLOBOCAN 2008, Cancer Incidence and Mortality Worldwide. [Google Scholar]
- 2.Varol N, et al. Ten-year review of hysterectomy morbidity and mortality: can we change direction? Aust N Z J Obstet Gynaecol. 2001;41:295–302. doi: 10.1111/j.1479-828x.2001.tb01231.x. [DOI] [PubMed] [Google Scholar]
- 3.Hindorff LA, Junkins HA, Hall PN, Mehta JP, Manolio TA. A Catalog of Published Genome-Wide Association Studies. National Human Genome Research Institute; 2010. [Google Scholar]
- 4.Goldgar DE, Easton DF, Cannon-Albright LA, Skolnick MH. Systematic population-based assessment of cancer risk in first-degree relatives of cancer probands. J Natl Cancer Inst. 1994;86:1600–8. doi: 10.1093/jnci/86.21.1600. [DOI] [PubMed] [Google Scholar]
- 5.Hemminki K, Vaittinen P, Kyyronen P. Age-specific familial risks in common cancers of the offspring. Int J Cancer. 1998;78:172–5. doi: 10.1002/(sici)1097-0215(19981005)78:2<172::aid-ijc9>3.0.co;2-w. [DOI] [PubMed] [Google Scholar]
- 6.Gruber SB, Thompson WD. A population-based study of endometrial cancer and familial risk in younger women. Cancer and Steroid Hormone Study Group. Cancer Epidemiol Biomarkers Prev. 1996;5:411–7. [PubMed] [Google Scholar]
- 7.Lucenteforte E, et al. Family history of cancer and the risk of endometrial cancer. Eur J Cancer Prev. 2009;18:95–9. doi: 10.1097/CEJ.0b013e328305a0c9. [DOI] [PubMed] [Google Scholar]
- 8.Haidopoulos D, et al. Risk factors in women 40 years of age and younger with endometrial carcinoma. Acta Obstet Gynecol Scand. 2010;89:1326–30. doi: 10.3109/00016349.2010.515666. [DOI] [PubMed] [Google Scholar]
- 9.Hampel H, et al. Screening for Lynch syndrome (hereditary nonpolyposis colorectal cancer) among endometrial cancer patients. Cancer Res. 2006;66:7810–7. doi: 10.1158/0008-5472.CAN-06-1114. [DOI] [PubMed] [Google Scholar]
- 10.Setiawan VW, et al. Two estrogen-related variants in CYP19A1 and endometrial cancer risk: a pooled analysis in the Epidemiology of Endometrial Cancer Consortium. Cancer Epidemiol Biomarkers Prev. 2009;18:242–7. doi: 10.1158/1055-9965.EPI-08-0689. [DOI] [PMC free article] [PubMed] [Google Scholar]
- 11.Low YL, et al. Multi-variant pathway association analysis reveals the importance of genetic determinants of estrogen metabolism in breast and endometrial cancer susceptibility. PLoS Genet. 2010;6:e1001012. doi: 10.1371/journal.pgen.1001012. [DOI] [PMC free article] [PubMed] [Google Scholar]
- 12.Genome-wide association study of 14, 000 cases of seven common diseases and 3, 000 shared controls. Nature. 2007;447:661–78. doi: 10.1038/nature05911. [DOI] [PMC free article] [PubMed] [Google Scholar]
- 13.Price AL, et al. Principal components analysis corrects for stratification in genome-wide association studies. Nat Genet. 2006;38:904–9. doi: 10.1038/ng1847. [DOI] [PubMed] [Google Scholar]
- 14.Gudmundsson J, et al. Genome-wide association and replication studies identify four variants associated with prostate cancer susceptibility. Nat Genet. 2009;41:1122–6. doi: 10.1038/ng.448. [DOI] [PMC free article] [PubMed] [Google Scholar]
- 15.Gudmundsson J, et al. Two variants on chromosome 17 confer prostate cancer risk, and the one in TCF2 protects against type 2 diabetes. Nat Genet. 2007;39:977–83. doi: 10.1038/ng2062. [DOI] [PubMed] [Google Scholar]
- 16.Thomas G, et al. Multiple loci identified in a genome-wide association study of prostate cancer. Nat Genet. 2008;40:310–5. doi: 10.1038/ng.91. [DOI] [PubMed] [Google Scholar]
- 17.Elliott KS, et al. Evaluation of association of HNF1B variants with diverse cancers: collaborative analysis of data from 19 genome-wide association studies. PLoS One. 2010;5:e10858. doi: 10.1371/journal.pone.0010858. [DOI] [PMC free article] [PubMed] [Google Scholar]
- 18.Voight BF, et al. Twelve type 2 diabetes susceptibility loci identified through large-scale association analysis. Nat Genet. 2010;42:579–89. doi: 10.1038/ng.609. [DOI] [PMC free article] [PubMed] [Google Scholar]
- 19.Kasper JS, Liu Y, Giovannucci E. Diabetes mellitus and risk of prostate cancer in the health professionals follow-up study. Int J Cancer. 2009;124:1398–403. doi: 10.1002/ijc.24044. [DOI] [PMC free article] [PubMed] [Google Scholar]
- 20.Stevens VL, et al. HNF1B and JAZF1 genes, diabetes, and prostate cancer risk. Prostate. 2010;70:601–7. doi: 10.1002/pros.21094. [DOI] [PMC free article] [PubMed] [Google Scholar]
- 21.Hemminki K, Li X, Sundquist J, Sundquist K. Risk of cancer following hospitalization for type 2 diabetes. Oncologist. 2010;15:548–55. doi: 10.1634/theoncologist.2009-0300. [DOI] [PMC free article] [PubMed] [Google Scholar]
- 22.Hjartaker A, Langseth H, Weiderpass E. Obesity and diabetes epidemics: cancer repercussions. Adv Exp Med Biol. 2008;630:72–93. doi: 10.1007/978-0-387-78818-0_6. [DOI] [PubMed] [Google Scholar]
- 23.Noto H, Osame K, Sasazuki T, Noda M. Substantially increased risk of cancer in patients with diabetes mellitus: a systematic review and meta-analysis of epidemiologic evidence in Japan. J Diabetes Complications. 2010;24:345–53. doi: 10.1016/j.jdiacomp.2010.06.004. [DOI] [PubMed] [Google Scholar]
- 24.Rosato V, et al. Metabolic syndrome and endometrial cancer risk. Ann Oncol. 2010 doi: 10.1093/annonc/mdq464. [DOI] [PubMed] [Google Scholar]
- 25.Bach I, Yaniv M. More potent transcriptional activators or a transdominant inhibitor of the HNF1 homeoprotein family are generated by alternative RNA processing. EMBO J. 1993;12:4229–42. doi: 10.1002/j.1460-2075.1993.tb06107.x. [DOI] [PMC free article] [PubMed] [Google Scholar]
- 26.Bernardini L, et al. Recurrent microdeletion at 17q12 as a cause of Mayer-Rokitansky-Kuster-Hauser (MRKH) syndrome: two case reports. Orphanet J Rare Dis. 2009;4:25. doi: 10.1186/1750-1172-4-25. [DOI] [PMC free article] [PubMed] [Google Scholar]
- 27.Oram RA, et al. Mutations in the hepatocyte nuclear factor-1beta (HNF1B) gene are common with combined uterine and renal malformations but are not found with isolated uterine malformations. Am J Obstet Gynecol. 2010;203:364 e1–5. doi: 10.1016/j.ajog.2010.05.022. [DOI] [PubMed] [Google Scholar]
- 28.Kato N, Motoyama T. Expression of hepatocyte nuclear factor-1beta in human urogenital tract during the embryonic stage. Anal Quant Cytol Histol. 2009;31:34–40. [PubMed] [Google Scholar]
- 29.Kim L, et al. Clear cell carcinoma of the pancreas: histopathologic features and a unique biomarker: hepatocyte nuclear factor-1beta. Mod Pathol. 2008;21:1075–83. doi: 10.1038/modpathol.2008.95. [DOI] [PubMed] [Google Scholar]
- 30.Kato N, Sasou S, Motoyama T. Expression of hepatocyte nuclear factor-1beta (HNF-1beta) in clear cell tumors and endometriosis of the ovary. Mod Pathol. 2006;19:83–9. doi: 10.1038/modpathol.3800492. [DOI] [PubMed] [Google Scholar]
- 31.Kato N, Motoyama T. Hepatocyte nuclear factor-1beta(HNF-1beta) in human urogenital organs: its expression and role in embryogenesis and tumorigenesis. Histol Histopathol. 2009;24:1479–86. doi: 10.14670/HH-24.1479. [DOI] [PubMed] [Google Scholar]
- 32.Tsuchiya A, et al. Expression profiling in ovarian clear cell carcinoma: identification of hepatocyte nuclear factor-1 beta as a molecular marker and a possible molecular target for therapy of ovarian clear cell carcinoma. Am J Pathol. 2003;163:2503–12. doi: 10.1016/s0002-9440(10)63605-x. [DOI] [PMC free article] [PubMed] [Google Scholar]
- 33.Mahata P. Biomarkers for epithelial ovarian cancers. Genome Inform. 2006;17:184–93. [PubMed] [Google Scholar]
- 34.Harries LW, Perry JR, McCullagh P, Crundwell M. Alterations in LMTK2, MSMB and HNF1B gene expression are associated with the development of prostate cancer. BMC Cancer. 2010;10:315. doi: 10.1186/1471-2407-10-315. [DOI] [PMC free article] [PubMed] [Google Scholar]
- 35.Liu H, Wang B, Han C. Meta-analysis of genome-wide and replication association studies on prostate cancer. Prostate. 2010 doi: 10.1002/pros.21235. [DOI] [PubMed] [Google Scholar]
- 36.Higgins JP, Thompson SG, Deeks JJ, Altman DG. Measuring inconsistency in meta-analyses. BMJ. 2003;327:557–60. doi: 10.1136/bmj.327.7414.557. [DOI] [PMC free article] [PubMed] [Google Scholar]
- 37.Teo YY, et al. A genotype calling algorithm for the Illumina BeadArray platform. Bioinformatics. 2007;23:2741–6. doi: 10.1093/bioinformatics/btm443. [DOI] [PMC free article] [PubMed] [Google Scholar]
- 38.Turnbull C, et al. Genome-wide association study identifies five new breast cancer susceptibility loci. Nat Genet. 2010;42:504–7. doi: 10.1038/ng.586. [DOI] [PMC free article] [PubMed] [Google Scholar]
- 39.Durbin RM, et al. A map of human genome variation from population-scale sequencing. Nature. 2010;467:1061–73. doi: 10.1038/nature09534. [DOI] [PMC free article] [PubMed] [Google Scholar]
- 40.Aulchenko YS, Ripke S, Isaacs A, van Duijn CM. GenABEL: an R library for genome-wide association analysis. Bioinformatics. 2007;23:1294–6. doi: 10.1093/bioinformatics/btm108. [DOI] [PubMed] [Google Scholar]
- 41.Clayton D, Leung HT. An R package for analysis of whole-genome association studies. Hum Hered. 2007;64:45–51. doi: 10.1159/000101422. [DOI] [PubMed] [Google Scholar]
- 42.Aulchenko YS, Struchalin MV, van Duijn CM. ProbABEL package for genome-wide association analysis of imputed data. BMC Bioinformatics. 2010;11:134. doi: 10.1186/1471-2105-11-134. [DOI] [PMC free article] [PubMed] [Google Scholar]
- 43.Li Y, Willer C, Sanna S, Abecasis G. Genotype imputation. Annu Rev Genomics Hum Genet. 2009;10:387–406. doi: 10.1146/annurev.genom.9.081307.164242. [DOI] [PMC free article] [PubMed] [Google Scholar]
- 44.Barrett JC, Fry B, Maller J, Daly MJ. Haploview: analysis and visualization of LD and haplotype maps. Bioinformatics. 2005;21:263–5. doi: 10.1093/bioinformatics/bth457. [DOI] [PubMed] [Google Scholar]
Associated Data
This section collects any data citations, data availability statements, or supplementary materials included in this article.