

Abstract
Many statistical analyses of genetic data rely on the assumption of independence among samples. Consequently, relatedness is either modeled in the analysis or samples are removed to “clean” the data of any pairwise relatedness above a tolerated threshold. Current methods do not maximize the number of unrelated individuals retained for further analysis, and this is a needless loss of resources. We report a novel application of graph theory that identifies the maximum set of unrelated samples in any dataset given a user-defined threshold of relatedness as well as all networks of related samples. We have implemented this method into an open source program called Pedigree Reconstruction and Identification of a Maximum Unrelated Set, PRIMUS. We show that PRIMUS outperforms the three existing methods, allowing researchers to retain up to 50% more unrelated samples. A unique strength of PRIMUS is its ability to weight the maximum clique selection using additional criteria (e.g. affected status and data missingness). PRIMUS is a permanent solution to identifying the maximum number of unrelated samples for a genetic analysis.
Keywords: genome-wide association study, Bron–Kerbosch, cryptic relatedness, bioinformatics, sample selection
INTRODUCTION
Interrelatedness can be a confounding factor in many statistical analyses, including burden tests in sequence data, association studies [Devlin and Roeder, 1999; Voight and Pritchard, 2005], genome-wide estimates of identity by descent (IBD) [Sun and Dimitromanolakis, 2012], and principle component analyses [Patterson et al., 2006]. Unless modeled into the statistical analysis [Kang et al., 2010; Thornton and McPeek, 2010], interrelatedness must be removed from the data before proceeding with genetic analyses. Given the expense of DNA ascertainment, clinical phenotyping, sequencing and/or genotyping, and data analysis, maximizing the number of unrelated samples utilized in such analyses should be a priority.
Estimates of pairwise IBD, a quantitative measure of relatedness, can reliably detect relatives as distant as first cousins [Huff et al., 2011]. Over the years, multiple strategies to detect IBD have been developed [Browning and Browning, 2011; Browning and Browning, 2010; Han and Abney, 2011; Huff et al., 2011; Kong et al., 2008; Manichaikul et al., 2010; Purcell et al., 2007], and new methods are emerging that use IBD estimates to confidently detect more distant relatives (up to third cousins) [Browning and Browning, 2010; Huff et al., 2011]. With good IBD estimates, relatedness structures that violate the assumption of sample independence can be identified and removed from the dataset through sample pruning.
METHODS
CURRENT APPROACHES
We have identified three publicly available methods to produce a set of unrelated individuals given a threshold of tolerated pairwise IBD. The documentation for PLINK [Purcell et al., 2007] (see Web Resources) suggests a method to remove pairwise relatedness by iteratively removing one member of each pair until no pairs remain (Figure 1A). Pemberton et al. [2010] suggest generating networks of relatedness in which samples are nodes and pairwise relationships are edges. Relatedness networks are then broken by iteratively removing the most highly connected node, until no edges remain in the dataset (Figure 1B). Finally, the authors of KING [Manichaikul, et al., 2010] describe how they generate a set of unrelated individuals in a recent paper [Manichaikul et al., 2012]. They first add the person who is related to the fewest other people in the dataset and then proceed to add the individual who is related to the next fewest people in the dataset, as long as the individual to be added is not related to anyone already in the set of unrelated individuals (Figure 1C). However, none of these approaches maximize the number of retained unrelated samples or selectively retain the most informative samples.
Fig. 1.

Stepwise selection process of an unrelated set for the three alternative methods and PRIMUS. In each network, each node represents an individual and an edge represents a familial relationship between two individuals. The red nodes represent the selected set of unrelated individuals. (A and B) The numbers represent one possible ordering that the Pemberton and PLINK methods might use to eliminate individuals from the unrelated set. (C) The numbers indicate one possible ordering for how the KING method selects individuals for inclusion in the unrelated set. (D) PRIMUS will always select a maximum set (n = 3) of the graph and will generate the maximum unrelated set of individuals.
In order to test software package called Pedigree Reconstruction and Identification of a Maximum Unrelated Set (PRIMUS) and compare it to other methods, we programed each of the three methods as described (Figure 1). This was required because neither method described in PLINK Pemberton is available in a software package, and the KING program does not allow for the input of user-defined IBD estimates. Rather, KING calculates its own IBD estimates from input genotype data.
NEW METHOD
We present a method adapted from graph theory that always identifies the maximum set of unrelated individuals in any dataset, and allows weighting parameters to be utilized in unrelated sample selection (Figure 1D). We implemented this method in a new software package PRIMUS, and it is available online (see Web Resources).
PRIMUS reads in user-generated IBD estimates and outputs the maximum possible set of unrelated individuals, given a user-defined threshold of relatedness. PRIMUS converts the IBD relationship file to an undirected graph in which nodes represent individuals and edges represent pairwise relationships; each connected component represents a “family network” or pedigree. PRIMUS writes out each family network to a .dot file to be viewed in graph visualization software such as GraphViz (see Web Resources) to generate images of the family networks (Figure 2).
Fig. 2.
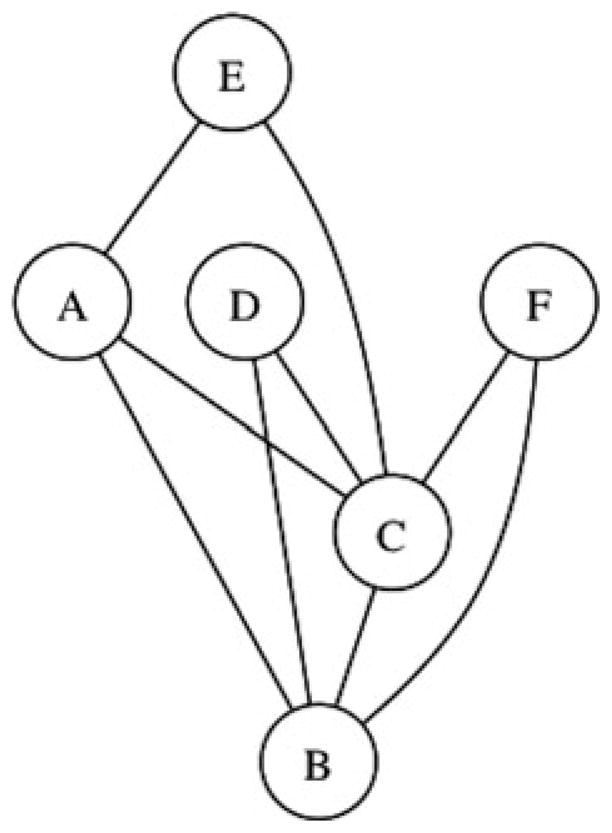
Example family network graph; each node represents an individual in the family network and each edge shows a relationship between two individuals. A graph like this will be generated for each family network with more than two people.
All individuals within each family network of the data are unrelated to any individual in a different family network (at the user-specified threshold). Thus, the problem of identifying the maximally sized unrelated set is reduced to finding the maximum unrelated set within each family network and then combining the unrelated sets of each family network to get the maximum unrelated set of the entire graph/dataset.
In graph theory, the maximum unrelated set is referred to as the maximum independent set; the maximum independent set of a graph is the same as the maximum clique of the complement graph. In the complement of a graph, all missing edges are added and all existing edges of the graph are removed. Here, this is equivalent to forming edges when relationships fall below the user-defined relatedness threshold rather than above it. We then search this complement graph for a maximum clique. A clique is defined as a portion of the graph (subgraph) where each node is connected to every other node in the subgraph. A maximal clique is a clique that is not a subgraph of a larger clique. Finally, a maximum clique is the largest maximal clique.
PRIMUS uses the Bron–Kerbosch algorithm [Bron and Kerbosch, 1973] with improved pivot selection [Cazals and Karande, 2008] to enumerate all maximal cliques of each complement family network. For each family network, PRIMUS picks the maximum clique or the weighted maximum clique to add to the maximum unrelated set of individuals. Finally, it generates a file containing the maximum set of unrelated individuals.
WEIGHTED MAXIMUM SET SELECTION
A unique strength of our program is its ability to weight the maximum clique selection using additional criteria. The maximum clique is the clique containing the most samples; however, there are often two or more maximum cliques. Any one of these will produce a maximum unrelated set, and PRIMUS allows for preferential selection of the maximum clique based on additional weighting criteria. In case/control studies this function is particularly useful, because it allows for the retention of the maximum clique with the most affected individuals. Alternatively, the user may wish to select the maximum clique with the lowest missingness rate within the data, or perhaps to first select for affected status and then for lowest missingness. PRIMUS allows specification of as many of these weighting criteria as desired as well as ordering how they are applied in the selection. No other available method for selecting unrelated samples offers weighting functionality.
PRIMUS can also retain the maximum number of unrelated individuals with a desired binary characteristic (e.g. affected status), even if this unrelated set is smaller than the maximum set of unrelated individuals. For example, a study may contain a trio with an affected child and two unaffected parents. The maximum unrelated set would require removing the child and retaining both parents, because the parents are unrelated to each other. It is likely that one would wish to retain the single affected child for further analysis instead of both unaffected parents. As a result, the overall unrelated set size will be smaller, but the set will contain more of the affected samples.
Because none of the PLINK, Pemberton, and KING methods has a weighting algorithm, we implemented one for each. These implementations are available upon request. For PLINK method, we implemented weighting by selecting the individual with the desired trait. For example, to preferentially select affected individuals, the algorithm will keep the affected individual in a case/control related pair. For Pemberton method, we implemented a weighting scheme by choosing to remove the node with the less optimal criteria whenever two nodes are equally connected. For the KING method, we implemented weighting by retaining the more desirable individual whenever two individuals are related to the same number of other individuals.
THE APPROXIMATION FUNCTION
The Bron–Kerbosch algorithm is impractical to run on large, sparse family networks due to the algorithm’s exponentially increasing computational cost (Figure 3). To remedy this, we implemented an approximation function for networks above a set cut-off size (Table I). PRIMUS’ approximation function takes a similar approach to the Pemberton method [Pemberton et al., 2010] by repeatedly removing the highest degree node from the family network until the network is smaller than the approximation function size cutoff or until it breaks into subnetworks smaller than the cutoff. Once the size of the network or subnetworks is below the approximation function size cutoff, PRIMUS uses the Bron–Kerbosch algorithm to obtain an independent set that is approximately the largest.
Fig. 3.
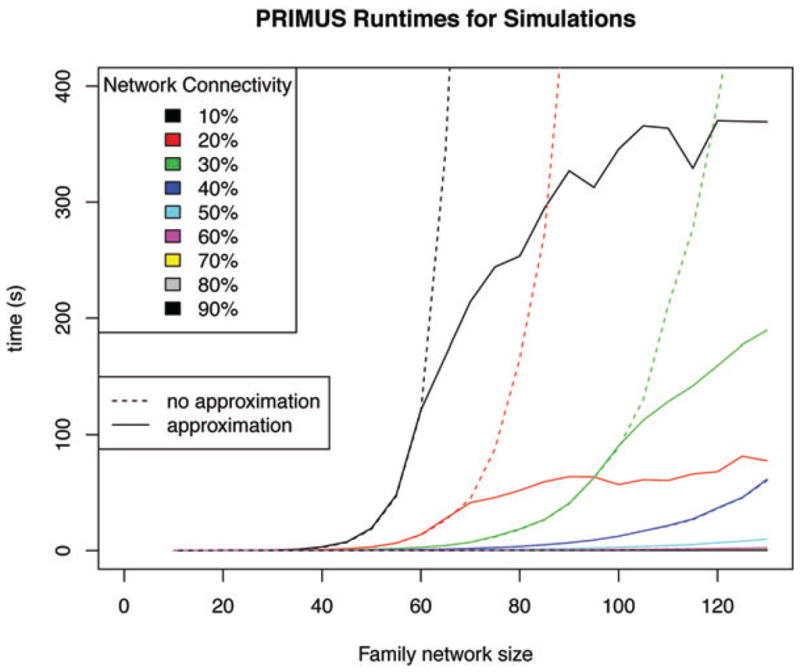
PRIMUS run-times on the simulations. The dashed lines show the exponential run-time and computational infeasibility of the Bron–Kerbosch algorithm for large network sizes. The solid colored lines show the run-times of PRIMUS. The dashed-solid lines separate when PRIMUS’ approximation function is used to avoid the exponential run-times.
TABLE I.
Minimum network size for which PRIMUS’ approximation function is used
| Connectivity (≥, %) | 15 | 20 | 25 | 35 | 45 | 55 | 65 | 75 | 100 |
|
| |||||||||
| Approximation size cutoff (number of nodes) | 60 | 70 | 90 | 100 | 130 | 170 | 230 | 330 | 500 |
Table showing the approximation network size for all ranges of network connectivity that PRIMUS will compute without using the approximation function. For example, a network with 10% connectivity will require the approximation function if the network size is greater than 60.
FAMILY NETWORK SIMULATIONS
To compare the performance of PRIMUS to these methods on all types of family networks, we randomly generated 7,500 simulated family networks of varying sizes and network connectivity, which is a measure of how interconnected the network is. Connectivity can vary widely in family data (Figure 4); some family networks are highly connected (e.g. a father, mother, and 10 offspring), whereas other family networks may be sparsely connected (e.g. a “string” of cousins in which each is related through a unique parent). For each network size (five to 130 by increments of five), we randomly generated 30 simulated networks with the network connectivity proportion ranging from 0.1 (10% of all possible pairwise relationships exist in the network) to 1 (every individual is related to every other individual), and our simulation data are available upon request. For each simulation, we obtained an unrelated set from PRIMUS and the three other methods.
Fig. 4.

The diversity of sizes and connectivity levels for family networks in real data. The size and connectivity of family networks varies within datasets. We are using connectivity as a measure of how related individuals are within a family network. Connectivity is the number of pairwise relationships that exist in a dataset divided by the total possible number of pairwise relationships. Each circle on the plot represents one family network or pedigree from either the Prostate Cancer Pedigree dataset [Stanford et al., 2009] or the HapMap3 dataset [Altshuler et al., 2010].
RESULTS
SIMULATION RESULTS
In all 6,540 simulations that did not require the use of the approximation function, PRIMUS produced an unrelated set of size equal to or greater than all other approaches. In our simulations, PRIMUS increased the unrelated set size by more than 50% relative to the PLINK method (Figure 5) and by similar amounts relative to the other selection methods (Supporting Information Figures S1A–C). Although PRIMUS provides the greatest improvement as the network size and connectivity increase, even for sparse; small networks PRIMUS typically provides 5–20% improvement compared to the other method (Supporting Information Figures S1A–C).
Fig. 5.
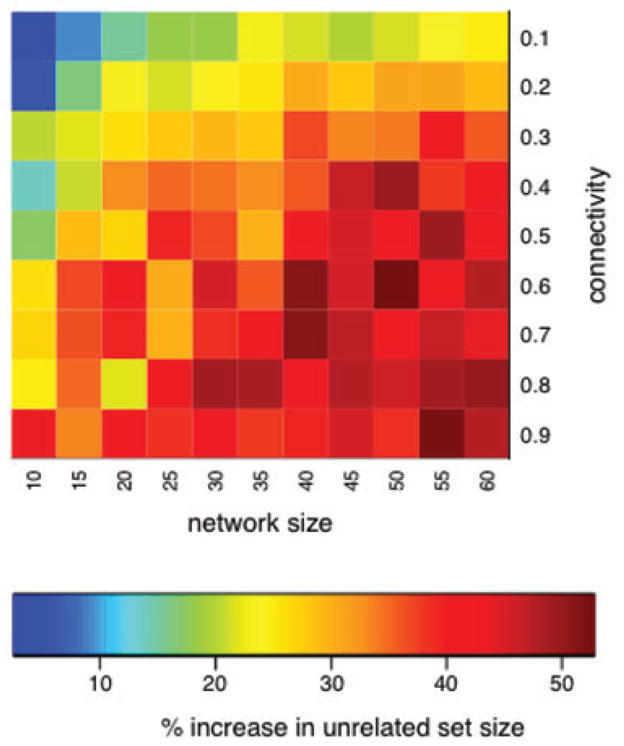
A heatmap showing the percent increase in unrelated sample size by PRIMUS compared to the PLINK method. The vertical axis is the number of edges in the network divided by the total number of possible edges. The horizontal axis is the size of the simulated network. The color in each square corresponds to the percent increase in the size of the unrelated sample set generated by PRIMUS relative to the set generated by PLINK averaged across 30 randomly generated networks.
Only when PRIMUS’ approximation function was used (960 simulations), the other methods have the potential to outperform PRIMUS. The Pemberton method never outperforms PRIMUS because PRIMUS’ approximation function is very similar to the Pemberton method; the size of the network is above the approximation size thresholds shown in Table I. Table II shows that PRIMUS’ approximation function outperforms the other three methods in more than 98.75% of the simulations. To address the 1.25% of cases, we have incorporated each of the other methods into PRIMUS, such that when it recognizes the need to run the approximation function, it will also run each of the other methods and return the largest unrelated set derived from any of the four methods.
TABLE II.
Number of simulations in which other methods outperformed PRIMUS’ approximation function
| Weighting criteria | PLINK | Pemberton | KING | Total percentage (%) |
|---|---|---|---|---|
| No weighting | 1/960 | 0/960 | 6/960 | 0.24 |
| Affected status | 51/960 | 0/960 | 0/960 | 1.77 |
| Low quantitative trait | 2/960 | 0/960 | 19/960 | 0.73 |
There were 960 simulations that required PRIMUS to use its approximation function. The table shows out of those 960 simulations how many simulations did the other methods outperform PRIMUS.
We also compared the performance of each method on weighting for a binary and a quantitative trait. Similar to the maximum unrelated set identification, PRIMUS always identifies the largest set of unrelated affected individuals when the approximation function is not needed. PRIMUS retained up to 75% more affected individuals in the weighted comparisons between PRIMUS and each of the other methods (Supporting Information Figures S2A–C).
HAPMAP3 RESULTS
Finally, we compared the performance of PRIMUS and the other three methods on data from phase 3 of the Haplotype Mapping Project [Altshuler et al., 2010] and the 1,000 Genomes Project [Consortium, 2010]. For each dataset, PRIMUS obtained the largest set of unrelated individuals (see Supporting Information Table S1). Given our IBD estimates for these reference datasets, the maximum sample set in which no pair of individuals have a coefficient of relatedness (π̂) > 0.1 are listed in Supporting Information Table S1 and a link to a list of the sample identification numbers can be found at the PRIMUS website (see Web Resources).
DISCUSSION
Although PRIMUS will identify the largest unrelated set of samples, as shown in Figure 5, the performance advantage of PRIMUS depends strongly on the amount of connectivity within the families, the size of the families, and clearly, the presence of family data among the samples (all methods do equally well when the samples are unrelated). PRIMUS provides the greatest benefit on large family networks with moderate to high interrelatedness; however, PRIMUS is useful on all varieties of genetic datasets.
We recommend using PRIMUS to obtain unrelated reference sample sets. For example, many researchers use HapMap3 and 1,000 Genomes datasets to impute genotypes, estimate population allele/haplotype frequencies, and run principle component analyses. However, both datasets contain related samples [Pemberton et al., 2010], and if the interrelatedness is not removed, then these imputations and estimates will be inaccurate.
Methods exist to account for pedigree structure or interrelatedness when doing association studies [Kang et al., 2010; Thornton and McPeek, 2010]. However, in the context of large cohort studies, the power gain would be modest because most samples are not related within the last few generations, and the minor power gain may not be worth the computational burden of accounting for the interrelatedness. In such a case, PRIMUS is the best option for removing relatedness.
We also recommend using PRIMUS’ weighted maximum set selection to optimize your unrelated set for a desired characteristic. Specific scenarios include selecting for affected status in a case/control study, selecting for the lowest missingness, or selecting samples in the tails of a distribution in a quantitative trait study.
PRIMUS allows users to specify the level of relatedness in their dataset. Because PRIMUS can take any quantitative measure of relatedness, the selected cutoff should be based on the sensitivity of the tool used to estimate the pairwise relatedness. For example, PLINK is relatively accurate at estimating relationships up to first cousins but less accurate for more distant relationships [Huff et al., 2011]. Therefore, a coefficient of relatedness (π̂) cutoff of 0.1 is appropriate. We have found that KING has similar sensitivity as PLINK when estimating pairwise relationships; however, KING uses the kinship coefficient, π̂/2, therefore recommended cutoff for KING IBD estimates is 0.05. Other programs [Browning and Browning, 2010; Huff et al., 2011] are more powerful at accurately detecting more distant relationships, and the user specified cutoff should be adjusted accordingly.
When statistics assumes independence among samples, stripping datasets of relatedness observed in the genetic data are a necessary step in quality control and data cleaning. We have developed an efficient and optimal approach that uses user-generated IBD estimates to quickly provide a maximum set of unrelated samples to retain in further analyses. Despite the importance of retaining the largest sample size possible in genetic analyses, we have only found a single published analysis that utilizes this concept [Heath et al., 2008] to obtain a maximum unrelated set of samples. In addition, our approach provides the option to retain the most informative samples in the resulting dataset (i.e. based on phenotype or data missingness). Furthermore, as a byproduct, PRIMUS reports all connected family networks in the data; knowledge of these networks can then be leveraged to improve the power in some analyses by utilizing this familial information [Ott et ., 2011], or to select the most distantly related affected individuals within each family for exome or whole genome sequencing. Finally, PRIMUS is fast; capable of processing thousands of individuals distributed across hundreds of family networks in minutes or less, making it a practical tool for even the largest and most complex datasets.
Supplementary Material
Acknowledgments
We thank Nancy Cox, Josh Smith, Bruce Weir, Timothy Thorton, Qian Yi, Brian Browning, Walter L. Ruzzo, and Peggy D. Robertson for their helpful discussions during the development of this method. We also thank Janet Stanford and Elaine Ostrander for use of the Prostate Cancer Pedigree dataset. J. S. is supported by NHGRI (T32 HG00035), and support for D. N. and J. E. B. through the NHLBI (HL102926) and NHGRI (HG006493).
Footnotes
The authors have no conflict of interest.
WEB RESOURCES
PLINK 1.07, http://pngu.mgh.harvard.edu/purcell/plink/
PRIMUS, http://sourceforge.net/projects/primus-beta/
Maximum unrelated set of individuals for the publically available datasets, http://sourceforge.net/projects/primus-beta/datasets/
GraphViz, http://www.graphviz.org
Supporting Information is available in the online issue at wileyonlinelibrary.com.
References
- Bron C, Kerbosch J. Algorithm 457: finding all cliques of an undirected graph. Commun ACM. 1973;16(9):575–577. [Google Scholar]
- Browning BL, Browning SR. A fast, powerful method for detecting identity by descent. Am J Hum Genet. 2011;88(2):173–182. doi: 10.1016/j.ajhg.2011.01.010. [DOI] [PMC free article] [PubMed] [Google Scholar]
- Browning SR, Browning BL. High-resolution detection of identity by descent in unrelated individuals. Am J Hum Genet. 2010;86(4):526–539. doi: 10.1016/j.ajhg.2010.02.021. [DOI] [PMC free article] [PubMed] [Google Scholar]
- Cazals F, Karande C. A note on the problem of reporting maximal cliques. Theor Comput Sci. 2008;407(1–3):564–568. [Google Scholar]
- Consortium TGP. A map of human genome variation from population-scale sequencing. Nature. 2010;467(7319):1061–1073. doi: 10.1038/nature09534. [DOI] [PMC free article] [PubMed] [Google Scholar]
- Devlin B, Roeder K. Genomic control for association studies. Biometrics. 1999;55(4):997–1004. doi: 10.1111/j.0006-341x.1999.00997.x. [DOI] [PubMed] [Google Scholar]
- Han L, Abney M. Identity by descent estimation with dense genome-wide genotype data. Genet Epidemiol. 2011;35(6):557–567. doi: 10.1002/gepi.20606. [DOI] [PMC free article] [PubMed] [Google Scholar]
- Heath SC, Gut IG, Brennan P, McKay JD, Bencko V, Fabianova E, Foretova L, Georges M, Janout V, Kabesch M. Investigation of the fine structure of European populations with applications to disease association studies. Eur J Hum Genet. 2008;16(12):1413–1429. doi: 10.1038/ejhg.2008.210. [DOI] [PubMed] [Google Scholar]
- Huff CD, Witherspoon DJ, Simonson TS, Xing J, Watkins WS, Zhang Y, Tuohy TM, Neklason DW, Burt RW, Guthery SL. Maximum-likelihood estimation of recent shared ancestry (ERSA) Genome Res. 2011;21(5):768–774. doi: 10.1101/gr.115972.110. [DOI] [PMC free article] [PubMed] [Google Scholar]
- The International HapMap 3 Consortium. Integrating common and rare genetic variation in diverse human populations. Nature. 2010;467(7311):52–58. doi: 10.1038/nature09298. [DOI] [PMC free article] [PubMed] [Google Scholar]
- Kang HM, Sul JH, Service SK, Zaitlen NA, Kong SY, Freimer NB, Sabatti C, Eskin E. Variance component model to account for sample structure in genome-wide association studies. Nat Genet. 2010;42(4):348–354. doi: 10.1038/ng.548. [DOI] [PMC free article] [PubMed] [Google Scholar]
- Kong A, Masson G, Frigge ML, Gylfason A, Zusmanovich P, Thorleifsson G, Olason PI, Ingason A, Steinberg S, Rafnar T. Detection of descent, long-range phasing and haplotype imputation. Nat Genet. 2008;40(9):1068–1075. doi: 10.1038/ng.216. [DOI] [PMC free article] [PubMed] [Google Scholar]
- Manichaikul A, Mychaleckyj JC, Rich SS, Daly K, Sale M, Chen WM. Robust relationship inference in genome-wide association studies. Bioinformatics. 2010;26(22):2867–2873. doi: 10.1093/bioinformatics/btq559. [DOI] [PMC free article] [PubMed] [Google Scholar]
- Manichaikul A, Palmas W, Rodriguez CJ, Peralta CA, Divers J, Guo X, Chen WM, Wong Q, Williams K, Kerr KF. Population structure of hispanics in the United States: the multi-ethnic study of atherosclerosis. PLoS Genet. 2012;8(4):e1002640. doi: 10.1371/journal.pgen.1002640. [DOI] [PMC free article] [PubMed] [Google Scholar]
- Ott J, Kamatani Y, Lathrop M. Family-based designs for genome-wide association studies. Nat Rev Genet. 2011;12(7):465–474. doi: 10.1038/nrg2989. [DOI] [PubMed] [Google Scholar]
- Patterson N, Price AL, Reich D. Population structure and eigen-analysis. PLoS Genet. 2006;2(12):e190. doi: 10.1371/journal.pgen.0020190. [DOI] [PMC free article] [PubMed] [Google Scholar]
- Pemberton TJ, Wang C, Li JZ, Rosenberg NA. Inference of unexpected genetic relatedness among individuals in HapMap Phase III. Am J Hum Genet. 2010;87(4):457–464. doi: 10.1016/j.ajhg.2010.08.014. [DOI] [PMC free article] [PubMed] [Google Scholar]
- Purcell S, Neale B, Todd-Brown K, Thomas L, Ferreira MA, Bender D, Maller J, Sklar P, de Bakker PI, Daly MJ. PLINK: a tool set for whole-genome association and population-based linkage analyses. Am J Hum Genet. 2007;81(3):559–575. doi: 10.1086/519795. [DOI] [PMC free article] [PubMed] [Google Scholar]
- Stanford JL, FitzGerald LM, McDonnell SK, Carlson EE, McIntosh LM, Deutsch K, Hood L, Ostrander EA, Schaid DJ. Dense genome-wide SNP linkage scan in 301 hereditary prostate cancer families identifies multiple regions with suggestive evidence for linkage. Hum Mol Genet. 2009;18(10):1839–1848. doi: 10.1093/hmg/ddp100. [DOI] [PMC free article] [PubMed] [Google Scholar]
- Sun L, Dimitromanolakis A. Statistical human genetics: methods and protocols. New York, NY: Springer; 2012. Identifying Cryptic Relatedness; pp. 47–57. [Google Scholar]
- Thornton T, McPeek MS. ROADTRIPS: case-control association testing with partially or completely unknown population and pedigree structure. Am J Hum Genet. 2010;86(2):172–184. doi: 10.1016/j.ajhg.2010.01.001. [DOI] [PMC free article] [PubMed] [Google Scholar]
- Voight BF, Pritchard JK. Confounding from cryptic relatedness in case-control association studies. PLoS Genet. 2005;1(3):e32. doi: 10.1371/journal.pgen.0010032. [DOI] [PMC free article] [PubMed] [Google Scholar]
Associated Data
This section collects any data citations, data availability statements, or supplementary materials included in this article.