

Abstract
Purpose
Clinical studies have implicated the mechanistic target of rapamycin (serine/threonine kinase; MTOR) pathway in the regulation of neuroendocrine tumor (NET) growth. We explored whether expression of MTOR pathway components has prognostic significance in NET patients.
Patients and Methods
We evaluated immunohistochemical expression of MTOR and phospho (p) –MTOR; its downstream targets RPS6KB1, RPS6, and EIF4EBP1; and its upstream regulators, in a cohort of 195 archival neuroendocrine tumors. We correlated expression levels with clinical outcomes, after adjusting for other prognostic variables.
Results
We observed anticipated correlations between expression of upstream components of the MTOR pathway and their downstream targets. Expression of PIK3CA, MTOR, or p-EIF4EBP1 was associated with high MKI67 (Ki-67) labeling index. We failed to identify clinical correlations associated with expression of the upstream regulators TSC1, TSC2, AKT, p-AKT, PDPK1, PTEN, PIK3R1, or PIK3CA. In contrast, high expression of MTOR or its activated downstream targets p-RPS6KB1, p-RPS6, or p-EIF4EBP1 was associated with adverse clinical outcomes.
Conclusion
Our observations suggest that expression of MTOR or its downstream targets may be adverse prognostic factors in neuroendocrine tumors.
INTRODUCTION
The molecular aberrations in neuroendocrine tumors (NET) remain poorly understood. Recent observations that the mechanistic target of rapamycin (serine/threonine kinase; MTOR) inhibitor everolimus is active in patients with advanced NET have suggested that activation of the MTOR pathway may play a central role in the pathogenesis of this disease.1,2 This hypothesis is further supported by the recent results of whole exome sequencing in pancreatic NETs, which revealed mutations in MTOR pathway genes in 15% of patients.3 Whether expression of MTOR pathway components can be used to molecularly classify NETs and predict their clinical behavior is uncertain.
MTOR pathway components can be readily measured using immunohistochemical techniques.4–8 MTOR itself is a Ser/Thr protein kinase complex and is activated via phosphorylation, following activation of an upstream signaling cascade. Phosphatidylinositol 3-kinase (PI3K), which is composed of a regulatory subunit (PIK3R1 p85alpha) and a catalytic subunit (PIK3CA p110alpha), is considered a key upstream component of this pathway.9 Activation of PI3K results in phosphorylation of 3-phosphoinositide dependent protein kinase-1 (PDPK1) at two sites, Tyr373/376, and Ser24. Phospho (p) -PDPK1 phosphorylates AKT, which in turn phosphorylates MTOR.9 PTEN, TSC1, and TSC2 are tumor suppressor proteins that inhibit phosphorylation of MTOR.9–11
Downstream of MTOR, phosphorylation of MTORC1 leads to the phosphorylation of the eukaryotic translation initiation factor 4E-binding protein (EIF4EBP1) and the ribosomal protein S6 kinase (RPS6KB1).12,13 Activated RPS6KB1 (p-RPS6KB1) phosphorylates ribosomal protein S6 (RPS6). Activation of RPS6 and EIF4EBP1 leads to an increase in protein synthesis, promoting cell growth.14,15
Expression of MTOR pathway components has been associated with adverse clinical outcomes in various human malignancies.4,5,16–24 Studies correlating MTOR pathway component expression with outcomes in NETs, however, are limited.6,7,25,26 In a study of 72 patients with pancreatic NET, loss of PTEN or TSC2 expression was associated with adverse clinical outcomes.6 In a second study evaluating expression of MTOR and its downstream targets in 99 patients with gastroenteropancreatic NET, strong MTOR expression was associated with higher proliferative index; in addition, expression of the downstream target p-RPS6KB1 was associated with shorter survival in the subgroup of mid-gut carcinoid tumors.7 Associations between MTOR pathway component expression and clinical outcomes in other studies of NET, however, have been less definitive.25,26
In our study, we used immunohistochemical techniques to measure expression of MTOR and p-MTOR; its activated downstream targets p-RPS6KB1, p-RPS6, and p-EIF4EBP1; and the upstream regulators TSC1, TSC2, AKT, p-AKT, p-PDPK1, PTEN, and PI3K, in 195 patients with NETs. We then assessed whether expression of these components was associated with clinical outcomes.
PATIENTS AND METHODS
Study Population
Tissue blocks were obtained from patients with a confirmed diagnosis of NET recruited to our study approved by the institutional review board of the Dana-Farber Cancer Institute. Additional institutional review board approval was obtained for the molecular analysis of tumor blocks and correlation with clinical variables performed in our study. Demographic and clinical information was extracted patients' medical records; staging was defined by the American Joint Committee on Cancer TNM classification system.27 If survival data were not available in the medical record, they were obtained from the Social Security Death Index.
Tissue Microarray Construction
Tissue microarrays (TMA) were constructed from formalin-fixed, paraffin-embedded tissues, comprising 216 resection specimens and four liver wedge biopsies using a tissue-array instrument (Beecher Instruments, Silver Spring, MD). Three representative 0.6-mm-diameter tissue cores were taken from each specimen. Two TMA blocks were designed containing 145 and 75 samples, respectively, from a total of 195 patients. Multiple 4-μm sections were cut with a Leica microtome (Leica Microsystems Inc, Bannockburn, IL) and were transferred to adhesive-coated slides for immunohistochemical staining.
Immunohistochemistry
Anti-PIK3R1 (p85alpha), anti-p-PDPK1 (Ser241), anti-TSC1, and anti-TSC2 antibodies were obtained from Abcam (Cambridge, MA). Anti-PIK3CA (p110alpha), anti-PTEN, anti-p-PDPK1 (Tyr373/Tyr376), anti-AKT (AKT1, AKT2, and AKT3), anti-p-AKT (Ser473), anti-MTOR, anti-p-MTOR (Ser2448), anti-p-RPS6KB1 (Thr389), anti-p-RPS6 (Ser240/244), and anti-p-EIF4EBP1 (Thr37/46) were obtained from Cell Signaling Technology (Danvers, MA). Anti-MKI67 mouse monoclonal antibody (Ki-67) was obtained from DakoCytomatin (Glostrup, Denmark).
Immunohistochemistry based on the labeled streptavidin-biotin method were performed on TMA sections. After deparaffinization and antigen retrieval using an autoclave oven technique, sections were incubated at 4°C overnight with incubated anti-PIK3CA (1:200), anti-PIK3R1 (1:400), anti-PTEN (1:100), anti-p-PDPK1 (pTyr373/Tyr376; 1:200), anti-p-PDPK1 (Ser241; 1:100), anti-AKT (1:200), anti-p-AKT (1:250), anti-TSC1 (1:200), anti-TSC2 (1:50), anti-MTOR (1:50), anti-p-MTOR (1:100), anti-p-RPS6KB1 (1:100), anti-p-RPS6 (1:100), anti-p-EIF4EBP1 (1:50), and anti-MKI67 (1:100) antibodies. Antigen-antibody complexes were detected using the cobalt-3,3′-diaminobenzidine (Co-DAB) reaction. Colorectal cancers known to be positive for proteins listed in this paragraph were used as positive controls. The omission of the primary antibody served as a negative control.
Evaluation of Staining of Tissue Slides
Tumor staining characteristics were reviewed and interpreted by a pathologist (Z.R.Q.), who was blinded to clinical outcome data. MKI67 (Ki-67) labeling index (LI) was determined by counting the number of positive cells observed within areas of highest immunostaining by high-power fields (×400).28 MTOR pathway component expression was scored by applying a semiquantitative immunoreactivity scoring (IRS) system, as described previously.7 In brief, staining intensity was scored as 0 (no immunostaining), 1 (weak), 2 (moderate), and 3 (strong). The percentage of immunoreactive cells was scored as 0 (none), 1 (< 10%), 2 (10% to 50%), 3 (51% to 80%), and 4 (> 80%). Multiplication of the staining intensity score and the percent immunoreactivity score resulted in an IRS score ranging from 0 to 12 for each tissue core. The overall IRS score0–12 for each tumor was calculated by averaging the IRS scores in three tissue cores. The median IRS score for each marker, based on analysis of all tumors in the cohort, was used as the cutoff to define high versus low expression. Cutoff IRS scores were as follows: PIK3CA (≥ 9), PIK3R1 (≥ 8), p-PDPK1 (pTyr373/Tyr376; ≥ 9), p-PDPK1 (pS241; ≥ 8), AKT (≥ 8), p-AKT (≥ 8), MTOR (≥ 6), p-MTOR (≥ 6), p-RPS6KB1 (≥ 6), p-RPS6 (≥ 4), p-EIF4EBP1 (≥ 4), PTEN (≤ 4), TSC1 (≤ 8), and TSC2 (≤ 2).
To confirm the scores independently, a random selection of 70 tumors was examined for each marker by a second blinded observer (Y.I.). Concordance scores (all P < .001) were: κ = 0.69 (PIK3CA), κ = 0.82 (PIK3R1), κ = 0.80 (PTEN), κ = 0.68 (p-PDPK1; pTyr373/Tyr376), κ = 0.71 (p-PDPK1; pS241), κ = 0.69 (AKT), κ = 0.67 (p-AKT), κ = 0.80 (TSC1), κ = 0.77 (TSC2), κ = 0.77 (MTOR), κ = 0.71 (p-MTOR), κ = 0.68 (p-RPS6KB1), κ = 0.68 (p-RPS6), and κ = 0.85 (p-EIF4EBP1).
Statistical Analysis
Overall survival (OS) was calculated using the Kaplan-Meier method from the date of either patient's initial diagnosis or date of diagnosis of metastatic disease to the date of patient death, depending on the analysis performed. Disease-free survival (DFS) was calculated from the date of resection to the date of metastatic diagnosis or death. Statistical significance was defined as a two-sided P < .05; however, multiple testing adjustment was not performed as analyses were considered exploratory.29 The χ2 test was used to assess associations between the categorized expression levels, the tumor subgroups, and MKI67 (Ki-67) LI status. The Spearman rank order correlation was used for the pairwise correlation analyses of expression between proteins. Cox proportional hazards regression models were used to compute mortality hazard ratios (HR). Multivariate Cox proportional hazards regression models included tumor primary site, sex, age at diagnosis, tumor size or TNM stage, lymphovascular invasion, perineural invasion, and MKI67 (Ki-67) LI (as a surrogate for grade). A backward elimination with threshold of P = .05 was used to select variables in the final models. Patients with missing data were excluded from any analysis. SAS software (version 9.2; SAS Institute, Cary, NC) was used for analyses.
RESULTS
Clinicopathologic Characteristics
We evaluated 195 independent patients with NET (Table 1), of which 173 were primary tumors and 22 were metastases. The cohort included 124 patients with small intestinal NET (SINET), 19 with pancreatic NET (PNET), and 52 patients with other NET of various origins. As anticipated, we found that advanced age, disease stage, and high MKI67 (Ki-67) LI were associated with shorter OS (Table 1).
Table 1.
Clinicopathologic Characteristics of the Patients with NET and Associations with OS
| Characteristic | No. of Patients | % | No. of Events | Univariate HR | 95% CI | P | Multivariate HR* | 95% CI | P |
|---|---|---|---|---|---|---|---|---|---|
| NET | |||||||||
| Total | 195 | 22† | 43 | ||||||
| Small intestinal | 124 | 12 | 31 | 1 | Reference | 1 | Reference | ||
| Pancreatic | 19 | 0 | 4 | 1.35 | 0.47 to 3.88 | .57 | 1.64 | 0.52 to 5.17 | .39 |
| Others‡ | 52 | 10 | 8 | 0.76 | 0.35 to 1.65 | .48 | 0.65 | 0.19 to 2.17 | .48 |
| Age, years | 43 | 1.05 | 1.02 to 1.08 | .0009 | 1.04 | 1.01 to 1.07 | .0075 | ||
| Mean | 54.8 | ||||||||
| SD | 13 | ||||||||
| Sex | .11 | .39 | |||||||
| Female | 101 | 52 | 19 | 1 | Reference | 1 | Reference | ||
| Male | 94 | 48 | 24 | 1.62 | 0.89 to 2.97 | 1.35 | 0.68 to 2.66 | ||
| TNM stage | .0001 | .0002 | |||||||
| I | 15 | 8.0 | 0 | 1 | Reference§ | 1 | Reference§ | ||
| II | 32 | 16 | 3 | ||||||
| III | 48 | 25 | 5 | ||||||
| IV | 95 | 49 | 34 | 4.28 | 2.04 to 8.95 | 4.94 | 2.14 to 11.4 | ||
| Unknown | 5 | 3.0 | 1 | ||||||
| Lymphovascular invasion | .11 | .47 | |||||||
| Negative | 67 | 37 | 12 | 1 | Reference | 1 | Reference | ||
| Positive | 112 | 63 | 25 | 1.79 | 0.87 to 3.66 | 1.30 | 0.63 to 2.67 | ||
| Perineural invasion | .17 | .85 | |||||||
| Negative | 115 | 64 | 23 | 1 | Reference | 1 | Reference | ||
| Positive | 64 | 36 | 14 | 1.60 | 0.81 to 3.17 | 0.94 | 0.45 to 1.94 | ||
| MKI67 (Ki-67) LI | .15 | .011 | |||||||
| ≤ 2% | 100 | 51 | 18 | 1 | Reference | 1 | Reference | ||
| > 2% | 95 | 49 | 25 | 1.57 | 0.85 to 2.88 | 2.41 | 1.22 to 4.76 | ||
Abbreviations: HR, hazard ratio; LI, labeling index; NET, neuroendocrine tumor; OS, overall survival.
The multivariate Cox regression adjusted for tumor primary site (small intestinal v pancreas v others), age at diagnosis (continuous), gender (female v male), TNM stage (I, II, III, unknown, v IV), lymphovascular invasion (negative v positive), perineural invasion (negative v positive) and MKI67 (Ki-67) LI (≤ 2% v > 2%). A backward elimination with threshold of P = .05 was used to select variables in the final models. We excluded patients with missing information. We confirmed that including patients with missing information in the majority category did not substantially alter the results.
Patients only have metastatic tumor tissues.
Others: appendix, colon, lung, ovary, rectum, stomach, thyroid, and unknown.
Reference: TNM stages I, II, and III.
Expression of MTOR Pathway Components in NET
We evaluated potential differences in expression of 13 MTOR pathway components in SINET, PNET, or other NET (Figs 1A to 1D; Appendix Fig A1, online only). We observed variability in expression levels of some but not all MTOR pathway components between tumor subtypes. For example, low expression of TSC1 and TSC2 was more common in PNET than in SINET (P = .0032 and P < .001, respectively). High expression of the upstream component, p-PDPK1 (Tyr373/376) and AKT, as well as the downstream components, p-RPS6KB1 and p-RPS6, was more common in SINET than in PNET (P < .001 and P < .001; P = .0005 and P < .001, respectively). We did not detect statistically significant differences in MTOR pathway component expression between primary tumors and metastases among 24 pairs of primary tumors and matched nodal or distant metastases (18 synchronous; six metachronous), although the low number of patients may have limited our ability to detect such differences.
Fig 1.

Expression of mechanistic target of rapamycin (serine/threonine kinase; MTOR) pathway components in neuroendocrine tumors. (A) MTOR cytoplasmic expression is shown (immunoreactivity scoring [IRS] score, 9). (B) Tumor cells with strong cytoplasmic phospho- (p) RPS6KB1 immunostaining (IRS score, 9). (C) Tumor cells with strong nuclear p-RPS6 positivity (IRS score, 12). (D) Tumor cells with both nuclear and cytoplasmic p-EIF4EBP1 expression (IRS score, 12).
Correlations Between MTOR Pathway Components and With Clinicopathologic Variables
We predicted that expression of upstream-activating components of the MTOR pathway would be associated with expression of activated downstream components, as assessed by immunohistochemistry. We observed strong correlations between most pairwise comparisons of upstream molecules and their activated downstream counterparts (Fig 2). We did not, however, observe expected inverse associations between expression of PTEN and p-MTOR or between TSC1 or TSC2 and p-MTOR in the cohort overall, or in the three tumor subgroups.
Fig 2.

Association between expression of mechanistic target of rapamycin (serine/threonine kinase; MTOR) pathway components in neuroendocrine tumors. Correlations are shown between expression of key MTOR pathway components and their immediate downstream targets (the raw immunoreactivity scores were used for correlation analysis). p-, phospho.
We further found that expression of PIK3CA, MTOR, or p-EIF4EBP1 was associated with an elevated MKI67 (Ki-67) LI (> 2%; P = .0011, P < .001, and P = .019, respectively). We did not find statistically significant associations between MTOR pathway component expression and other clinicopathologic variables.
Association Between MTOR Pathway Components Expression and Clinical Outcomes
To evaluate potential associations between expression of MTOR pathway components and clinical outcomes, we first assessed whether expression of MTOR or its activated downstream targets (p-RPS6KB1, p-RPS6, or p-EIF4EBP1) would be associated with clinical outcomes in the overall cohort. Among the 173 patients with primary-tumor tissue available, 33 patients died within a median follow-up time of 5.1 years. In a multivariate analysis, expression of p-RPS6KB1 (HR, 3.13; 95% CI, 1.50 to 6.51; P = .002) or p-RPS6 (HR, 2.62; 95% CI, 1.17 to 5.86; P = .019) was associated with shorter OS (Table 2).
Table 2.
Expression of MTOR, Its Downstream Effectors, and OS in Patients With NET (n = 173)
| Variable | No. of Patients | % | No. of Events | Univariate HR | 95% CI | P | Multivariate HR* | 95% CI | P |
|---|---|---|---|---|---|---|---|---|---|
| MTOR | .021 | .053 | |||||||
| Negative/low | 114 | 68 | 15 | 1 | Reference | 1 | Reference | ||
| High | 54 | 32 | 17 | 2.28 | 1.14 to 4.57 | 1.99 | 0.99 to 4.03 | ||
| p-MTOR | .88 | .98 | |||||||
| Negative/low | 47 | 28 | 8 | 1 | Reference | 1 | Reference | ||
| High | 123 | 72 | 24 | 1.07 | 0.48 to 2.39 | 1.01 | 0.45 to 2.29 | ||
| p-RPS6KB1 | .0034 | .002 | |||||||
| Negative/low | 107 | 62 | 14 | 1 | Reference | 1 | Reference | ||
| High | 66 | 38 | 19 | 2.96 | 1.43 to 6.13 | 3.13 | 1.50 to 6.51 | ||
| p-RPS6 | .015 | .019 | |||||||
| Negative/low | 106 | 62 | 13 | 1 | Reference | 1 | Reference | ||
| High | 65 | 38 | 19 | 2.41 | 1.19 to 4.90 | 2.62 | 1.17 to 5.86 | ||
| p-EIF4EBP1 | .35 | .37 | |||||||
| Negative/low | 115 | 67 | 17 | 1 | Reference | 1 | Reference | ||
| High | 56 | 33 | 16 | 1.40 | 0.69 to 2.82 | 1.37 | 0.68 to 2.75 |
NOTE. Analysis based on all patients with NET with evaluable primary tumors.
Abbreviations: HR, hazard ratio; LI, labeling index; MTOR, mechanistic target of rapamycin (serine/threonine kinase); NET, neuroendocrine tumor; OS, overall survival; p-, phospho.
HRs adjusted for tumor primary site (small intestinal v pancreas v others), age at diagnosis (continuous), sex, tumor size (continuous), lymphovascular invasion, perineural invasion, and MKI67 (Ki-67) LI (≤ 2% v > 2%). A backward elimination with threshold of P = .05 was used to select variables in the final models. We excluded patients with missing information. We confirmed that including patients with missing information in the majority category did not substantially alter the results.
Given potential differences between tumor subgroups, as well as variation in stage and histology between patients,28,30–32 our ability to assess the prognostic significance of MTOR pathway markers based on an analysis of the overall cohort might have been limited. We therefore focused our subsequent analyses on the largest subgroup of patients in our cohort, those with SINET.
We assessed DFS in 47 patients with SINET who had undergone complete resections (R0) of their primary tumors and associated lymph nodes, with no evidence of distant metastatic disease (M0). There were 11 patients with recurrences, with a median follow-up time of 4.4 years. Expression of MTOR was associated with shorter DFS in multivariate analyses (HR, 5.15; 95% CI, 1.48 to 17.9; P = .01; Table 3). We then assessed OS in patients with metastatic disease. Among 76 patients who had metastatic disease either at diagnosis or during follow-up, 24 patients died, with a median follow-up time of 5.1 years. In a multivariate analysis, expression of MTOR (HR, 2.94; 95% CI, 1.29 to 6.73; P = .011), p-RPS6KB1 (HR, 3.28; 95% CI, 1.27 to 8.52; P = .015), p-RPS6 (HR, 2.69; 95% CI, 1.03 to 7.03; P = .043), or p-EIF4EBP1 (HR, 3.15; 95% CI, 1.32 to 7.53; P = .009) was associated with shorter overall survival (Table 3; Figs 3A to 3D).
Table 3.
Associations Among Expression of MTOR Pathway Components in SINET and DFS for Resected Patients (n = 47) or OS for Metastatic Patients (n = 73)
| Variable | DFS for Resected Patients |
OS for Metastatic Patients |
||||||||||||
|---|---|---|---|---|---|---|---|---|---|---|---|---|---|---|
| No. of Patients | % | No. of Events | Univariate HR | 95% CI | Multivariate HR* | 95% CI | No. of Patients | % | No. of Events | Univariate HR | 95% CI | Multivariate HR* | 95% CI | |
| MTOR | ||||||||||||||
| Negative/low | 34 | 72 | 5 | 1 | Reference | 1 | Reference | 54 | 72 | 10 | 1 | Reference | 1 | Reference |
| High | 13 | 28 | 6 | 5.15 | 1.48 to 17.9 | 5.15 | 1.48 to 17.9 | 21 | 28 | 14 | 3.36 | 1.47 to 7.68 | 2.94 | 1.29 to 6.73 |
| P | .01 | .01 | .004 | .011 | ||||||||||
| p-MTOR | ||||||||||||||
| Negative/low | 10 | 21 | 1 | 1 | Reference | 1 | Reference | 18 | 24 | 5 | 1 | Reference | 1 | Reference |
| High | 37 | 79 | 10 | 2.96 | 0.38 to 23.2 | 2.96 | 0.38 to 23.2 | 57 | 76 | 19 | 0.85 | 0.31 to 2.31 | 1.15 | 0.39 to 3.37 |
| P | .30 | .30 | .75 | .80 | ||||||||||
| p-RPS6KB1 | ||||||||||||||
| Negative/low | 29 | 62 | 5 | 1 | Reference | 1 | Reference | 35 | 46 | 7 | 1 | Reference | 1 | Reference |
| High | 18 | 38 | 6 | 2.12 | 0.64 to 7.02 | 2.12 | 0.64 to 7.02 | 41 | 54 | 17 | 2.68 | 1.05 to 6.81 | 3.28 | 1.27 to 8.52 |
| P | .22 | .22 | .039 | .015 | ||||||||||
| p-RPS6 | ||||||||||||||
| Negative/low | 24 | 51 | 5 | 1 | Reference | 1 | Reference | 35 | 47 | 6 | 1 | Reference | 1 | Reference |
| High | 23 | 49 | 6 | 1.11 | 0.33 to 3.65 | 1.11 | 0.33 to 3.65 | 40 | 53 | 17 | 3.37 | 1.31 to 8.67 | 2.69 | 1.03 to 7.03 |
| P | .86 | .86 | .012 | .043 | ||||||||||
| p-EIF4EBP1 | ||||||||||||||
| Negative/low | 33 | 70 | 6 | 1 | Reference | 1 | Reference | 50 | 67 | 10 | 1 | Reference | 1 | Reference |
| High | 14 | 30 | 5 | 1.80 | 0.55 to 5.92 | 1.80 | 0.55 to 5.92 | 25 | 33 | 14 | 2.64 | 1.15 to 6.06 | 3.15 | 1.32 to 7.53 |
| P | .33 | .33 | .022 | .009 | ||||||||||
Abbreviation: DFS, disease-free survival; HR, hazard ratio; LI, labeling index; MTOR, mechanistic target of rapamycin (serine/threonine kinase); OS, overall survival; p-, phospho; SINET, small intestinal neuroendocrine tumor.
HRs adjusted for age at diagnosis (continuous), sex, tumor size (continuous), lymphovascular invasion, perineural invasion, and MKI67 (Ki-67) LI (≤ 2% v > 2%). A backward elimination with threshold of P = .05 was used to select variables in the final models. We excluded patients with missing information. We confirmed that including patients with missing information in the majority category did not substantially alter the results.
Fig 3.
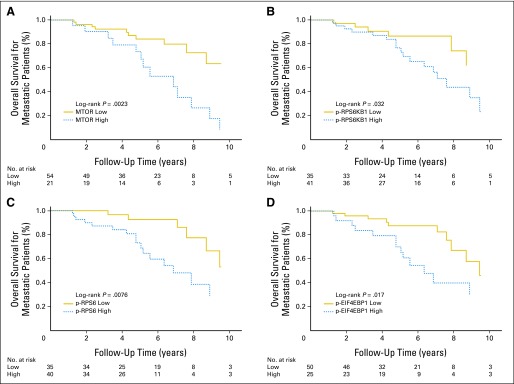
Overall survival for metastatic patients according to mechanistic target of rapamycin (serine/threonine kinase; MTOR) pathway component expression in patients with small intestinal neuroendocrine tumor. Kaplan-Meier curves for overall survival are shown according to expression of (A) MTOR, (B) phospho- (p) RPS6KB1, (C) p-RPS6, or (D) p-EIF4EBP1.
We performed parallel analyses to evaluate whether expression of the upstream regulators TSC1, TSC2, AKT, p-AKT, PDPK1, PTEN, PIK3R1, or PIK3CA would be associated with OS in the cohort overall, DFS in patients with resected SINET, or OS in patients with metastatic SINET. We did not observe statistically significant associations between expression of these upstream regulators and clinical outcomes.
DISCUSSION
Although several trials have now demonstrated the efficacy of MTOR inhibitors in NET, the mechanism and pattern of MTOR pathway activation in these tumors remains largely unknown. In our study, we used immunohistochemical techniques to assess expression levels of MTOR pathway components in a large cohort of NET and correlated expression with clinical outcomes.
Profiling and characterization of MTOR pathway components has previously been demonstrated in other tumors known to be responsive to MTOR inhibitors, including leiomyosarcoma and renal cell carcinoma.17,33 Expression of several MTOR pathway components has also been detected in studies of NET tissue specimens.6–8,25,26 As in these studies, we found that MTOR pathway components were broadly expressed in NETs. We also confirmed prior observations that low expression of PTEN, TSC1, and TSC2 is common in pancreatic NETs.6 However, we found that TSC1 and TSC2 expression are generally preserved in SINET, suggesting potential differences in the mechanism of MTOR pathway activation in these two subgroups. In the prior study, low expression of the tumor suppressor PTEN or TSC2 was found to correlate with adverse clinical outcomes in patients with pancreatic NET.6 Low patient numbers did not allow us to formally test these associations in pancreatic NET.
Activation of the MTOR pathway would be predicted to be associated with more aggressive clinical behavior. The proliferative marker MKI67 (Ki-67) has been widely used as a prognostic indicator in NETs; an MKI67 (Ki-67) LI of more than 2% is generally associated with adverse outcomes. Consistent with observations in a prior study of gastroenteropancreatic NET,7 we found that expression of MTOR or p-EIF4EBP1 is associated with a higher proliferative index. We also found that expression of the upstream regulator PIK3CA was associated with an elevated MKI67 (Ki-67) LI (> 2%). Interestingly, similar associations between MTOR pathway component expression and clinical outcomes have not been observed in poorly differentiated neuroendocrine carcinoma.26
We further found associations between high expression of MTOR or its activated downstream targets and clinical outcomes. Expression of MTOR, p-RPS6KB1, or p-RPS6 was associated with shorter survival in our cohort overall, though interpretation of these results is limited to some degree by variability in patient stage and tumor subtype. Focusing our analysis on our largest subgroup, SINET, we found associations between shorter DFS in patients with resections or shorter overall survival for patients with metastases and high expression of MTOR or its activated downstream targets p-RPS6KB1, p-RPS6, and p-EIF4EBP1. Though MTOR expression was not found to be associated with clinical outcomes in a study of 34 patients with pancreatic NET,25 our observations are consistent with the results of another recent study in which activated RPS6KB1 was found to be associated with a poor prognosis in 39 patients with advanced mid-gut NET.7
One unanticipated observation was our failure to observe associations between p-MTOR expression and clinical outcomes as might be predicted. It is possible that the immunohistochemical assessment for p-MTOR was not as reliable as for some of the other markers. Indeed, correlation between p-MTOR and its direct downstream activated target p-RPS6KB1 was relatively weak (P = .14). We also did not detect clear associations between expression of upstream components of the MTOR pathway and clinical outcomes. Taken together, our observations suggest that expression of MTOR and its downstream components may be more reliable prognostic indicators than expression of upstream markers in patients with NET. These observations need to be interpreted with some caution, however, given the exploratory nature of our analysis. Validation studies will be needed to confirm these findings.
Though our study sheds light on the patterns and potential clinical significance of MTOR pathway activation in NET, the underlying mechanisms leading to pathway activation remain unclear. In other malignancies, the MTOR pathway is activated through binding of growth factors to receptor tyrosine kinases, as well as by a mutation, deletion, or amplification of key pathway components including PIK3CA, PTEN, or AKT.9,14,34 Loss of 16p, the chromosomal region containing TSC2, as well as loss of 10q, the region containing PTEN, has been reported in pancreatic NET, as have mutations in PTEN, TSC2, and PIK3CA.3,35,36 Characteristic mutations in SINET have yet to be defined.
The MTOR inhibitor everolimus was recently approved for use in patients with advanced pancreatic NET.1 A parallel randomized study also suggested that everolimus may have activity in patients with advanced carcinoid tumors.2 The downstream markers p-RPS6KB1, p-RPS6, and p-EIF4EBP1 have been used as surrogate markers to assess exposure to MTOR inhibitors both in vitro and in vivo.4,24,37,38 It is intriguing, therefore, that expression of these same markers may more generally be associated with clinical outcomes. Although MTOR pathway components have been suggested as potentially predictive biomarkers of response to MTOR inhibitors,39 none have yet been validated in this capacity. These same markers would seem to be leading candidates to assess for their ability to predict response to treatment with MTOR inhibitors.
In conclusion, we found expression of MTOR and its downstream effectors to be associated with adverse clinical outcomes in a large cohort of patients with NET. Confirmatory studies, as well as studies evaluating the potential predictive value of these markers in patients receiving everolimus or other MTOR inhibitors, are warranted.
Acknowledgment
We thank Robert and Ann Ramsey, the Saul and Gitta Kurlat fund for neuroendocrine tumor research, and the Caring for Carcinoid Foundation.
Appendix
Fig A1.

Mechanistic target of rapamycin (MTOR) pathway component expression in neuroendocrine tumors (NET) according to tumor subtype. Results are shown for all tumors evaluated (n = 195). p-, phospho; PNET, pancreatic neuroendocrine tumors; SINET, small intestinal neuroendocrine tumors.
Footnotes
Supported by a grant from Novartis Pharmaceuticals, by the Raymond and Beverly Sackler American Association of Cancer Research Fellowship for Ileal Carcinoid Research (M.T.-M.), and in part by Grants No. R01 CA151532-01A1 and 5P50CA127003-05 (Gastrointestinal Cancer SPORE; M.H.K.) from the National Institutes of Health.
Authors' disclosures of potential conflicts of interest and author contributions are found at the end of this article.
AUTHORS' DISCLOSURES OF POTENTIAL CONFLICTS OF INTEREST
Although all authors completed the disclosure declaration, the following author(s) and/or an author's immediate family member(s) indicated a financial or other interest that is relevant to the subject matter under consideration in this article. Certain relationships marked with a “U” are those for which no compensation was received; those relationships marked with a “C” were compensated. For a detailed description of the disclosure categories, or for more information about ASCO's conflict of interest policy, please refer to the Author Disclosure Declaration and the Disclosures of Potential Conflicts of Interest section in Information for Contributors.
Employment or Leadership Position: None Consultant or Advisory Role: Charles S. Fuchs, sanofi-aventis (C), Amgen (C), Genentech (C), Bayer (C), Metamark Genetics (C), Momenta Pharma (C), Pozen (C) Stock Ownership: None Honoraria: None Research Funding: Jennifer A. Chan, Novartis Pharmaceuticals; Matthew H. Kulke, Novartis Pharmaceuticals Expert Testimony: None Patents: None Other Remuneration: None
AUTHOR CONTRIBUTIONS
Conception and design: Zhi Rong Qian, Matthew H. Kulke
Financial support: Charles S. Fuchs
Provision of study materials or patients: Jennifer A. Chan, Susanne M. Hooshmand, Lauren K. Brais, Anastassia Daskalova, Rachel Heafield, Matthew H. Kulke
Collection and assembly of data: Zhi Rong Qian, Monica Ter-Minassian, Jennifer A. Chan, Yu Imamura, Susanne M. Hooshmand, Teppei Morikawa, Lauren K. Brais, Anastassia Daskalova, Rachel Heafield, Charles S. Fuchs, Matthew H. Kulke
Data analysis and interpretation: Zhi Rong Qian, Monica Ter-Minassian, Aya Kuchiba, Xihong Lin, David C. Christiani, Shuji Ogino, Matthew H. Kulke
Manuscript writing: All authors
Final approval of manuscript: All authors
REFERENCES
- 1.Yao JC, Shah MH, Ito T, et al. Everolimus for advanced pancreatic neuroendocrine tumors. N Engl J Med. 2011;364:514–523. doi: 10.1056/NEJMoa1009290. [DOI] [PMC free article] [PubMed] [Google Scholar]
- 2.Pavel ME, Hainsworth JD, Baudin E, et al. Everolimus plus octreotide long-acting repeatable for the treatment of advanced neuroendocrine tumours associated with carcinoid syndrome (RADIANT-2): A randomised, placebo-controlled, phase 3 study. Lancet. 2011;378:2005–2012. doi: 10.1016/S0140-6736(11)61742-X. [DOI] [PubMed] [Google Scholar]
- 3.Jiao Y, Shi C, Edil BH, et al. DAXX/ATRX, MEN1, and mTOR pathway genes are frequently altered in pancreatic neuroendocrine tumors. Science. 2011;331:1199–1203. doi: 10.1126/science.1200609. [DOI] [PMC free article] [PubMed] [Google Scholar]
- 4.Noh WC, Kim YH, Kim MS, et al. Activation of the mTOR signaling pathway in breast cancer and its correlation with the clinicopathologic variables. Breast Cancer Res Treat. 2008;110:477–483. doi: 10.1007/s10549-007-9746-x. [DOI] [PubMed] [Google Scholar]
- 5.Castellvi J, Garcia A, Rojo F, et al. Phosphorylated 4E binding protein 1: A hallmark of cell signaling that correlates with survival in ovarian cancer. Cancer. 2006;107:1801–1811. doi: 10.1002/cncr.22195. [DOI] [PubMed] [Google Scholar]
- 6.Missiaglia E, Dalai I, Barbi S, et al. Pancreatic endocrine tumors: Expression profiling evidences a role for AKT-mTOR pathway. J Clin Oncol. 2010;28:245–255. doi: 10.1200/JCO.2008.21.5988. [DOI] [PMC free article] [PubMed] [Google Scholar]
- 7.Kasajima A, Pavel M, Darb-Esfahani S, et al. mTOR expression and activity patterns in gastroenteropancreatic neuroendocrine tumours. Endocr Relat Cancer. 2011;18:181–192. doi: 10.1677/ERC-10-0126. [DOI] [PubMed] [Google Scholar]
- 8.Alì G, Boldrini L, Capodanno A, et al. Expression of p-AKT and p-mTOR in a large series of bronchopulmonary neuroendocrine tumors. Exp Ther Med. 2011;2:787–792. doi: 10.3892/etm.2011.291. [DOI] [PMC free article] [PubMed] [Google Scholar]
- 9.Engelman JA. Targeting PI3K signalling in cancer: Opportunities, challenges and limitations. Nat Rev Cancer. 2009;9:550–562. doi: 10.1038/nrc2664. [DOI] [PubMed] [Google Scholar]
- 10.Gao X, Zhang Y, Arrazola P, et al. Tsc tumour suppressor proteins antagonize amino-acid-TOR signalling. Nat Cell Biol. 2002;4:699–704. doi: 10.1038/ncb847. [DOI] [PubMed] [Google Scholar]
- 11.Inoki K, Li Y, Zhu T, et al. TSC2 is phosphorylated and inhibited by Akt and suppresses mTOR signalling. Nat Cell Biol. 2002;4:648–657. doi: 10.1038/ncb839. [DOI] [PubMed] [Google Scholar]
- 12.Podsypanina K, Lee RT, Politis C, et al. An inhibitor of mTOR reduces neoplasia and normalizes p70/S6 kinase activity in Pten+/− mice. Proc Natl Acad Sci U S A. 2001;98:10320–10325. doi: 10.1073/pnas.171060098. [DOI] [PMC free article] [PubMed] [Google Scholar]
- 13.Ma XM, Blenis J. Molecular mechanisms of mTOR-mediated translational control. Nat Rev Mol Cell Biol. 2009;10:307–318. doi: 10.1038/nrm2672. [DOI] [PubMed] [Google Scholar]
- 14.Zoncu R, Efeyan A, Sabatini DM. mTOR: From growth signal integration to cancer, diabetes and ageing. Nat Rev Mol Cell Biol. 2011;12:21–35. doi: 10.1038/nrm3025. [DOI] [PMC free article] [PubMed] [Google Scholar]
- 15.Hay N, Sonenberg N. Upstream and downstream of mTOR. Genes Dev. 2004;18:1926–1945. doi: 10.1101/gad.1212704. [DOI] [PubMed] [Google Scholar]
- 16.Abou Youssif T, Fahmy MA, Koumakpayi IH, et al. The mammalian target of rapamycin pathway is widely activated without PTEN deletion in renal cell carcinoma metastases. Cancer. 2011;117:290–300. doi: 10.1002/cncr.25402. [DOI] [PubMed] [Google Scholar]
- 17.Setsu N, Yamamoto H, Kohashi K, et al. The Akt/mammalian target of rapamycin pathway is activated and associated with adverse prognosis in soft tissue leiomyosarcomas. Cancer. 2012;118:1637–1648. doi: 10.1002/cncr.26448. [DOI] [PubMed] [Google Scholar]
- 18.Cedrés S, Montero MA, Martinez P, et al. Exploratory analysis of activation of PTEN-PI3K pathway and downstream proteins in malignant pleural mesothelioma (MPM) Lung Cancer. 2012;77:192–198. doi: 10.1016/j.lungcan.2012.02.022. [DOI] [PubMed] [Google Scholar]
- 19.Korkolopoulou P, Levidou G, El-Habr EA, et al. Phosphorylated 4E-binding protein 1 (p-4E-BP1): A novel prognostic marker in human astrocytomas. Histopathology. 2012;61:293–305. doi: 10.1111/j.1365-2559.2012.04236.x. [DOI] [PubMed] [Google Scholar]
- 20.Gallardo A, Lerma E, Escuin D, et al. Increased signalling of EGFR and IGF1R, and deregulation of PTEN/PI3K/Akt pathway are related with trastuzumab resistance in HER2 breast carcinomas. Br J Cancer. 2012;106:1367–1373. doi: 10.1038/bjc.2012.85. [DOI] [PMC free article] [PubMed] [Google Scholar]
- 21.LoPiccolo J, Blumenthal GM, Bernstein WB, et al. Targeting the PI3K/Akt/mTOR pathway: Effective combinations and clinical considerations. Drug Resist Updat. 2008;11:32–50. doi: 10.1016/j.drup.2007.11.003. [DOI] [PMC free article] [PubMed] [Google Scholar]
- 22.Li R, Dai H, Wheeler TM, et al. Prognostic value of Akt-1 in human prostate cancer: A computerized quantitative assessment with quantum dot technology. Clin Cancer Res. 2009;15:3568–3573. doi: 10.1158/1078-0432.CCR-08-0826. [DOI] [PubMed] [Google Scholar]
- 23.Tomita Y, Morooka T, Hoshida Y, et al. Prognostic significance of activated AKT expression in soft-tissue sarcoma. Clin Cancer Res. 2006;12:3070–3077. doi: 10.1158/1078-0432.CCR-05-1732. [DOI] [PubMed] [Google Scholar]
- 24.Petricoin EF, III, Espina V, Araujo RP, et al. Phosphoprotein pathway mapping: Akt/mammalian target of rapamycin activation is negatively associated with childhood rhabdomyosarcoma survival. Cancer Res. 2007;67:3431–3440. doi: 10.1158/0008-5472.CAN-06-1344. [DOI] [PubMed] [Google Scholar]
- 25.Zhou CF, Ji J, Yuan F, et al. mTOR activation in well differentiated pancreatic neuroendocrine tumors: A retrospective study on 34 cases. Hepatogastroenterology. 2011;58:2140–2143. doi: 10.5754/hge11212. [DOI] [PubMed] [Google Scholar]
- 26.Catena L, Bajetta E, Milione M, et al. Mammalian target of rapamycin expression in poorly differentiated endocrine carcinoma: Clinical and therapeutic future challenges. Target Oncol. 2011;6:65–68. doi: 10.1007/s11523-011-0171-z. [DOI] [PubMed] [Google Scholar]
- 27.Edge SB, Compton CC. The American Joint Committee on Cancer: The 7th edition of the AJCC cancer staging manual and the future of TNM. Ann Surg Oncol. 2010;17:1471–1474. doi: 10.1245/s10434-010-0985-4. [DOI] [PubMed] [Google Scholar]
- 28.Kulke MH, Siu LL, Tepper JE, et al. Future directions in the treatment of neuroendocrine tumors: Consensus report of the National Cancer Institute Neuroendocrine Tumor clinical trials planning meeting. J Clin Oncol. 2011;29:934–943. doi: 10.1200/JCO.2010.33.2056. [DOI] [PMC free article] [PubMed] [Google Scholar]
- 29.Bender R, Lange S. Adjusting for multiple testing: When and how? J Clin Epidemiol. 2001;54:343–349. doi: 10.1016/s0895-4356(00)00314-0. [DOI] [PubMed] [Google Scholar]
- 30.Kidd M, Modlin IM. Small intestinal neuroendocrine cell pathobiology: “Carcinoid” tumors. Curr Opin Oncol. 2011;23:45–52. doi: 10.1097/CCO.0b013e328340d006. [DOI] [PubMed] [Google Scholar]
- 31.Yao JC, Hassan M, Phan A, et al. One hundred years after “carcinoid”: Epidemiology of and prognostic factors for neuroendocrine tumors in 35,825 cases in the United States. J Clin Oncol. 2008;26:3063–3072. doi: 10.1200/JCO.2007.15.4377. [DOI] [PubMed] [Google Scholar]
- 32.Kulke MH, Lenz HJ, Meropol NJ, et al. Activity of sunitinib in patients with advanced neuroendocrine tumors. J Clin Oncol. 2008;26:3403–3410. doi: 10.1200/JCO.2007.15.9020. [DOI] [PubMed] [Google Scholar]
- 33.Pantuck AJ, Seligson DB, Klatte T, et al. Prognostic relevance of the mTOR pathway in renal cell carcinoma: Implications for molecular patient selection for targeted therapy. Cancer. 2007;109:2257–2267. doi: 10.1002/cncr.22677. [DOI] [PubMed] [Google Scholar]
- 34.Franke TF. PI3K/Akt: Getting it right matters. Oncogene. 2008;27:6473–6488. doi: 10.1038/onc.2008.313. [DOI] [PubMed] [Google Scholar]
- 35.Chung DC, Brown SB, Graeme-Cook F, et al. Localization of putative tumor suppressor loci by genome-wide allelotyping in human pancreatic endocrine tumors. Cancer Res. 1998;58:3706–3711. [PubMed] [Google Scholar]
- 36.Perren A, Komminoth P, Saremaslani P, et al. Mutation and expression analyses reveal differential subcellular compartmentalization of PTEN in endocrine pancreatic tumors compared to normal islet cells. Am J Pathol. 2000;157:1097–1103. doi: 10.1016/S0002-9440(10)64624-X. [DOI] [PMC free article] [PubMed] [Google Scholar]
- 37.Wan X, Harkavy B, Shen N, et al. Rapamycin induces feedback activation of Akt signaling through an IGF-1R-dependent mechanism. Oncogene. 2007;26:1932–1940. doi: 10.1038/sj.onc.1209990. [DOI] [PubMed] [Google Scholar]
- 38.Boulay A, Zumstein-Mecker S, Stephan C, et al. Antitumor efficacy of intermittent treatment schedules with the rapamycin derivative RAD001 correlates with prolonged inactivation of ribosomal protein S6 kinase 1 in peripheral blood mononuclear cells. Cancer Res. 2004;64:252–261. doi: 10.1158/0008-5472.can-3554-2. [DOI] [PubMed] [Google Scholar]
- 39.Duran I, Kortmansky J, Singh D, et al. A phase II clinical and pharmacodynamic study of temsirolimus in advanced neuroendocrine carcinomas. Br J Cancer. 2006;95:1148–1154. doi: 10.1038/sj.bjc.6603419. [DOI] [PMC free article] [PubMed] [Google Scholar]