

Abstract
Interferon regulatory factor 1 (IRF-1) is a transcription factor that has been implicated in the pathogenesis of the human autoimmune demyelinating disease multiple sclerosis (MS) and in its animal model, experimental autoimmune encephalomyelitis (EAE). The goal of the present study was to directly examine the role of IRF-1 in oligodendrocyte injury and inflammatory demyelination. For the purpose of this study, we generated a transgenic mouse line (CNP/dnIRF-1) that overexpresses the dominant-negative form of IRF-1 (dnIRF1) specifically in oligodendrocytes. CNP/dnIRF-1 mice exhibited no phenotypic abnormalities but displayed suppressed IRF-1 signaling in oligodendrocytes. The major finding of our study was that the CNP/dnIRF-1 mice, compared with the wild-type mice, were protected against EAE, a phenomenon associated with significant reduction of inflammatory demyelination and with oligodendrocyte and axonal preservation. The observed protection was related to suppressed IRF-1 signaling and impaired expression of immune and proapoptotic genes in oligodendrocytes. No significant differences in the peripheral immune responses between the wild-type and the CNP/dnIRF-1 mice were identified throughout the experiments. This study indicates that IRF-1 plays a critical role in the pathogenesis of EAE by mediating oligodendrocyte response to inflammation and injury. It also suggests that oligodendrocytes are actively involved in the neuroimmune network, and that exploring oligodendrocyte-related pathogenic mechanisms, in addition to the conventional immune-based ones, may have important therapeutic implications in MS.
Introduction
Experimental autoimmune encephalomyelitis (EAE) is an animal model of the human autoimmune inflammatory demyelinating disease multiple sclerosis (MS) (Steinman and Zamvil, 2006). EAE is induced by immunization of animals with myelin-specific proteins, which initiates an autoimmune inflammatory reaction against CNS myelin and oligodendrocytes (Swanborg, 1988). It has been hypothesized that the inflammatory reaction is driven by activated self-reactive CD4(+) cells and involves complex interactions between immune cells and CNS cellular elements, expression of immunoregulatory molecules, and recruitment of secondary effector cells (Ercolini and Miller, 2006). Demyelination and oligodendrocyte and axonal injury follow as a result of immune-mediated cytotoxicity and induction of stress responses (Lassmann et al., 1988; Ruulus et al., 1995; Huseby et al., 2001; Waxman, 2001; Lin et al., 2006; Krishnamoorthy et al., 2009).
A number of experimental studies have demonstrated strong positive correlation between oligodendrocyte susceptibility to injury and the extent of CNS inflammation in EAE. In a knock-out mouse system, absence of oligodendrocyte protective factors not only increases oligodendrocyte susceptibility to injury but also augments the inflammatory reaction and the severity of symptoms (Butzkueven et al., 2002; Linker et al., 2002; Balabanov et al., 2007). In contrast, mice lacking proapoptotic genes or overexpressing antiapoptotic molecules, specifically in oligodendrocytes, display resistance to EAE and inflammatory demyelination (Hisahara et al., 2000, 2003; Hövelmeyer et al., 2005). The critical role of oligodendrocytes in CNS inflammation is further exemplified by mice with peroxisome-deficient oligodendrocytes, which develop spontaneous neuroinflammation (Kassmann et al., 2007). However, the molecular mechanisms involving oligodendrocytes in the regulation of EAE remain poorly understood.
Interferon regulatory factor 1 (IRF-1) is a transcription factor that belongs to a family of transcription regulatory proteins whose cellular expression is controlled by interferons (Taniguchi et al., 2001). Absence of IRF-1, as demonstrated in IRF-1(−/−) knock-out mice, does not produce any gross morphological abnormalities but results in abnormal interferon-gamma (IFN-γ) responses (Matsuyama et al., 1993). IRF-1 has also been implicated as a severity factor for both MS and EAE (Tada et al., 1997; Buch et al., 2003; Fortunato et al., 2008; Ren et al., 2010, 2011). The role of IRF-1 in oligodendrocyte susceptibility to injury is largely unknown. However, potential associations can be contemplated because increased expression of IRF-1 and IRF-1-regulated genes, such as major histocompatibility (MHC class I) molecule, tumor necrosis factor-α receptor (TNF-αR), and Caspase 1, has been associated with oligodendrocyte apoptosis in MS and EAE lesions (Agresti et al., 1998; Furlan et al., 1999; Ming et al., 2002; Höftberger et al., 2004; Hövelmeyer et al., 2005; Ren et al., 2011). In addition, IRF-1 appears to be involved in a signaling pathway that mediates the injurious effects of IFN-γ on oligodendrocyte progenitor cells (OPC) (Wang et al., 2010).
In the present study, we report that suppression of IRF-1 activity in oligodendrocytes resulted in significant protection against EAE, reduction of inflammatory demyelination, and oligodendrocyte and axonal preservation. Our results provide a novel perspective on the pathogenesis of EAE that is likely to have important implications in MS.
Materials and Methods
CNP/dnIRF-1 transgenic mice.
The CNP/dnIRF1 transgenic mouse line was generated using a transgene containing the 2′3′-cyclic nucleotide 3′-phosphodiesterase (CNP) expression cassette and the dominant-negative form of IRF-1 (dnIRF-1) cDNA. The CNP expression cassette (a gift from Dr. Alexander Gow, Wayne State University, Detroit, MI) has been previously described in detail and used for oligodendrocyte-specific expression of transgenes (Gravel et al., 1998; Aguirre et al., 2007). It contains four components: (1) the CNP promoter, which drives expression; (2) a TATA box; (3) a polylinker region containing a BamH1 site, and (4) a polyadenylate signal. Exons 1 and 2 have been mutated during the initial preparation of the cassette. dnIRF-1 cDNA has been previously described by us (R.C.) and used experimentally for the purpose of knocking down IRF-1 activity (Bouker et al., 2005). It was generated from the wild-type IRF-1 by a deletion of base pairs 647–1173, which lacks the transcription-activating domain and the region implicated in targeting the molecule for degradation through the ubiquitin proteasome pathway (Fig. 1A). dnIRF-1 cDNA retains both the 3′ and 5′ untranslated regions, as well as the sequences encoding the DNA binding domain, repression domain, homodimerization domain, and nuclear localization domain of IRF-1. dnIRF-1 suppresses IRF-1 activity by competitive interactions for IRF-1 DNA binding sites (IRF-E) and preventing IRF-1 transcriptional activities (Bouker et al., 2005).
Figure 1.

Characterization of CNP/dnIRF-1 mice. A, IRF-1 and dnIRF-1. Note that dnIRF-1 has a lower molecular weight (MW; 17 kDa) and is recognized only by the antibody against the C terminus (C-term) but not by the antibody against middle part (M-part), and by a 456 bp probe (line) and PCR primers (arrow) spanning the fourth to eighth exons. B, Map of the CNP/dnIRF-1 transgene. C, Generation of the CNP/dnIRF-1 transgene. Linearized pCG/CNP vector (MW 7656 bp) and dnIRF-1 fragment (MW 1507 bp) were ligated and their orientation in relation to the promoter was assessed using SmaI. Digestion of the pCG/CNP/dnIRF-1 (P1) with NotI yielded the CNP/dnIRF-1 transgene (MW 6237 bp). D, Southern blot of tail DNA; 1% agarose gel. E, Northern blot of total brain RNA. Note the positive signal with the 458 bp probe in the transgenic samples: 1.2% denaturing gel. F, RT-PCR of brain RNA. Note that the expected product of 267 bp was found only with the transgenic (Tg) and not with the wild-type (WT) brain samples; controls: CNP (C−) and CNP/dnIRF-1 (C+) plasmids. G, Western blot of total brain protein. Note that anti-IRF-1 antibody against the C terminus of IRF-1 (C-term) yielded a 17 kDa band only with the transgenic but not with the wild-type samples. No signal was detected with the antibody against the middle part (M-part) in any of the samples; 8–15% PAGE. H, EMSA of brain nuclear extracts. Note that a significant mobility shift of Caspase 1 IRE was detected with the transgenic but not with the control (C; no cell extract) samples. Wild-type samples produced a weak signal that was close to the control; 5% retardation gel. I, Organ expression of dnIRF-1 (RT-PCR). Note the positive signals in brain (B) and spinal cord (Sc) but not in kidney (K), thymus (T), or spleen (Sp). J, Organ expression of dnIRF-1 (Q-PCR). Note that the positive signal for dnIRF-1 expression was detected in brain, spinal cord, and sciatic nerve (N) of the transgenic mice. The signals detected in thymus, spleen, and kidney were insignificant (n = 3 animals).
CNP/dnIRF-1 transgene was generated by sequential digestion followed by ligation of the CNP cassette and the dnIRF-1 sequence (Fig. 1B,C). Briefly, a pCG plasmid carrying the CNP expression cassette was linearized at the BamH1 site and the overhanging ends were Klenow filled. dnIRF-1 sequence was digested out from the original pcDNA3 vector using XhoI and the overhanging ends of the fragment were also Klenow filled. The dnIRF-1 was then subcloned into the CNP expression cassette using blunt-end ligation, multiplied in high transformation efficiency bacteria and selected by ampicillin resistance. The orientation of the insert was assessed using enzymatic digestion with SmaI and the whole transgene was sequenced. CNP/dnIRF-1-containing vector was then digested with NotI and a linear 6327 bp transgene was isolated and purified for microinjections. Fertilized C57BL/J6 oocytes were microinjected with ∼2 pl of CNP/dnIRF-1 transgene (dilution to 2 ng/μl) and then surgically implanted into surrogate mothers. Six F1 founders were identified by PCR of tail DNA using transgene-specific primers and bred to C57BL/6J mice (The Jackson Laboratory). The CNP/dnIRF-1 mouse line used in the EAE experiments was selected based on the highest transgene expression in the CNS.
IFN-γ-overexpressing mice.
Transgenic mouse line MBP/IFN-γ has been previously described in detail (Corbin et al., 1996). Briefly, MBP/IFN-γ mice are transgenic animals in which IFN-γ expression is driven by the myelin basic protein (MBP) promoter. IFN-γ expression in these mice is at low constitutive levels and does not result in any clinical phenotype. MBP/IFN-γ mice have been used previously for assessing the efficacy of transgenic targeting of IFN-γ signaling pathway in vivo (Balabanov et al., 2006).
Induction of EAE.
EAE was induced actively by antigen immunization of naive animals, as we have previously described (Balabanov et al., 2007). Six- to eight-week-old wild-type and CNP/dnIRF-1 female mice from the same litter were randomly separated into immunized and control subgroups. Each immunized mouse received 200 μg of myelin oligodendroglial protein (MOG)35–55 (MEVGWYRSPFSRVVHLYRNGK; Genemed Synthesis) emulsified in complete Freund's adjuvant (CFA) containing 600 μg of Mycobacterium tuberculosis H37Ra (Difco) intradermally into three flank areas. Control mice were injected with the same amount of emulsion containing CFA only. All the mice also receive 100 ng of Pertussis toxin (List Biological Laboratories) intraperitoneally on day 1 postimmunization (PI). In some of the experiments, EAE was induced by an adoptive transfer of MOG35–55-activated lymphocytes to naive mice via the tail vein (2 × 10⁷ cells/mouse). Donor lymphocytes were collected from spleens of fully immunized mice at day 8PI and cultured in vitro for 72 h in RPMI-1640 medium containing 20 μg/ml MOG35–55, 20 ng/ml mouse interleukin 12 (R&D Systems), and 10 μg/ml anti-mouse IFN-γ antibody (BD Pharmigen) (Thakker et al., 2007). Mice were examined daily and the severity of clinical disease quantitated using a six-point scoring scale: 0 = normal, 1 = flaccid tail, 2 = ataxia, 3 = paraparesis/paraplegia, 4 = quadriparesis/quadriplegia, and 5 = death. Clinical data were presented as the mean ± SD of the daily clinical scores of the experimental groups.
Southern blot, PCR, and genotyping.
All experimental animals were genotyped using isolated tail DNA as we have previously described (Balabanov et al., 2006). Southern blot was performed using EcoRI digested tail DNA and a 458 bp Dig-labeled probe recognizing the regions flanking the deleted portion of dnIRF-1 using the Dig high prime DNA labeling and detection kit II (Roche Applied Science). An immunofluorescence detection method was used as described in the Dig high prime kit. The membrane was exposed to Kodak Biomax film for 30 min at room temperature and the film was developed using the M7B Kodak processor. A similarly prepared GAPDH (glyceralaldehyde-3 phosphate dehydrogenase) probe was used to control for sample load and signal normalization.
PCR (Qiagen) for transgene detection was performed using transgene-specific screening primers: dnIRF-1 sense primer, 5′ AGAGCAAGGCCAAGAGGAAGT 3′ and dnIRF-1 antisense primer, 5′ GGGCCAGCTTTACACCACAAG 3′ (Integrated DNA Technologies). The reaction was performed in a Bio-Rad cycler unit under the following conditions: 1 cycle at 95°C/3 min followed by 35 cycles (95°C/30 s, 58°C/30 s, 72°C/60 s), and 1 cycle at 72°C/10 min.
Northern blot, reverse transcriptase PCR, and quantitative PCR.
RNA analyses for detection of mRNA transcripts were performed as we have previously described (Balabanov et al., 2006). Total RNA was isolated from the examined animals using the TRIzol reagent (Invitrogen). Northern blot was performed by electrophoresing 20 μg of total RNA in a 1.2% denaturing agarose gel. The samples were transferred to a nylon membrane and hybridized overnight with a Dig-labeled 458 bp dnIRF-1 probe (Dig high prime kit; Roche Applied Science). As above, a Kodak film was exposed to the hybridized membrane for 30 min at room temperature and then developed. Hybridization with the GAPDH probe was used to control for sample load and signal normalization.
Reverse transcriptase PCR (RT-PCR) and quantitative PCR (Q-PCR) were performed by first reverse transcribing 1 μg of DNAaseI-treated total RNA using oligo(dT)12–18 and SuperScript II reverse transcriptase (Invitrogen). The PCR step was performed using 20 ng of cDNA in the same conditions described above. Q-PCR was performed using 20 ng of the cDNA in a reaction containing iQSupermix and the following primers and probes: dnIRF-1 sense primer, 5′ TGGAGATGTTAGCCCGGACAC 3′; dnIRF-1 antisense primer, 5′ AGCGTAACAGTCCTGGAGTTA 3′; dnIRF-1 probe, 5′ GACCTGATGACCACAGCAGTT-56FAM-1/-3′; GAPDH sense primer, 5′-CTCAACTACATGGTCTACATGTTCCA-3′; GAPDH antisense primer, 5′-CCATTCTCGGCCTTGACTGT-3′; and GAPDH probe, 5′-5TxRd-XN/5′-TGACTCCACTCACGGCAAATTCAACG-3BHQ-2–3′ (Integrated DNA Technologies). The reactions were performed in a Bio-Rad I-cycler real-time PCR unit (Bio-Rad) under the following conditions: 1 cycle at 95°C/3 min, and 40 cycles (95°C/30 s, 60°C/30 s). The mRNA levels of dnIRF-1 were normalized to the expression levels of GAPDH based on threshold cycles (dnIRF-1/GAPDH ratio).
Western blot.
Western blot analysis was performed as we have previously described (Wang et al., 2010). Protein samples, at concentration of 50 μg, were electrophoresed on 8–15% SDS-polyacrylamide gels and transferred to polyvinylidene fluoride membranes (trans-blot SD apparatus; Bio-Rad). The membranes were incubated first with anti-IRF-1 (C terminus catalog #sc-640/497, dilution 1:1000; or M-part #sc-13401, dilution 1:1000) and anti-GAPDH (dilution 1:1000; Santa Cruz Biotechnology) antibodies overnight, followed by species-matched, infrared (IR)-labeled secondary anti-mouse or anti-rabbit antibodies (dilution 1:10,000; Li-Cor Biosciences). The blot membranes were imaged using Odyssey IR Imaging system (Li-Cor Biosciences).
Electromobility shift assay.
Electromobility shift assay (EMSA) using brain nuclear extracts was performed as we have previously described (Wang et al., 2010). Nuclear extracts, at concentration of 2 μg, were incubated with 1 μl of the IR dye end-labeled oligonucleotide (50 nm) in a medium containing 2 μl of 10× buffer (Li-Cor Biosciences), 2 μl of dithiothreitol, and 1 μl of salmon DNA for 20 min at room temperature. Oligonucleotide containing the IRF-1 binding element (IRF-E) of Caspase 1 promoter, 5′-ACTTTCAGTTC-3′, was used in the reaction. The samples were resolved on a 5% retardation gel at 100 V for 1–2 h and imaged using a Li-Cor IR scanner (Li-Cor Biosciences).
Histochemistry and immunohistochemistry.
Mouse CNS tissue was prepared as frozen blocks as we have previously described (Balabanov et al., 2007). Frozen blocks for histochemistry were then sectioned at a thickness of 30 μm at −20°C (CM1800 cryostat, Leica Microsystems) and stained with hematoxylin and eosin (H&E) or Luxol fast blue and neutral red (LFB&NR) using standard protocols. Tissue for immunohistochemistry was similarly prepared. Indirect immunostaining was performed by sequential incubation with primary antibodies (for 2 h at room temperature or overnight at 4°C) followed by species-matching fluorescein (FITC)-conjugated or cyanin 3 (Cy3)-conjugated secondary antibodies (for 30 min). All of the primary and secondary antibodies used in the study were commercially available: anti-IRF-1 (C terminus and M-part antibodies, dilution 1:200; Santa Cruz Biotechnology), anti-STAT1 (signal transducer and activator of transcription 1, dilution 1:200; Santa Cruz Biotechnology), anti-adenomatous polyposis coli protein (CC1) antibody (dilution 1:20; Oncogene Science), anti-MHC class I molecule (dilution 1:200; Novus Biological), anti-apolipoprotein (APO) E (dilution 1:200; Abcam), anti-proteolipid protein (PLP, dilution 1:500; Santa Cruz Biotechnology), anti-Caspase 1 antibody (dilution 1:200; Santa Cruz Biotechnology), anti-mouse or anti-rabbit FITC-conjugated secondary antibody (dilution 1:200), and anti-mouse or anti-rabbit Cy3-congugated antibody (dilution 1:800; Jackson Immunoresearch). Terminal deoxynucleotidyl transferase-mediated dUTP-biotin nick end labeling (TUNEL) was performed using the Apoptag kit (Serological) according to manufacturer's protocol. DAPI (4′, 6-diamidino-2-phenyldole) nuclear stain (dilution 1:10,000) was obtained from Vector Laboratories.
Quanitative cell analysis was performed using the Axiovision software of the Axoplan digital microscope (Zeiss) as we have previously described (Balabanov et al., 2007). Briefly, the area of interest of a given section was digitally selected and the corresponding total area (in mm2) obtained. Degree of inflammation was assessed by digitally counting the inflammatory foci (inflammatory focus was defined as the presence of >20 mononuclear cells/vessel) within a given tissue area (Balabanov et al., 2007). The number of immunopositive cells within an area of interest was obtained in a similar fashion. Results were presented as mean ± SD inflammatory foci/millimeters squared or immunopositive cells/millimeters squared, with n = 3 animals per group.
Oligodendrocyte cultures.
Mixed primary oligodendrocyte cultures were prepared from 3-d-old newborn pups as we have previously described (Balabanov et al., 2006). Because the transgenic mouse litters contained transgenic and wild-type pups, the brain of each animal was processed separately, cultured in individual flasks, and later genotype matched. The cultures were maintained in a DMEM containing 10% fetal bovine serum (Sigma-Aldrich) for ∼10 d. OPC were enriched by shaking the culture flasks at 240 rpm for 16 h at 37°C, sieving through a 30 μm nylon filter (Tetko), and differential nonadherence to uncoated plastic plates. The free-floating cells were then cultured on poly-d-lysine-coated glass coverslips at desired cell numbers and allowed to differentiate for 5 d in a DMEM-based serum-free media containing 5 μg/ml insulin, 50 μg/ml transferrin, 30 nm selenium, 10 nm biotin, 10 nm progesterone, 15 nm tri-iodothyronin, 0.1% bovine serum albumin, and 1% ampicillin/streptomycin (Sigma-Aldrich). Oligodendrocyte cultures were treated depending on the experimental design with IFN-γ (0–100 U/ml) (Calbiochem).
Promoter reporter assay.
Promoter reporter assay was performed as we have previously described in detail (Wang et al., 2010; Ren et al., 2011). Human oligodendroglioma (HOG) cells were transfected with pGL4.71 reporter vector containing Caspase 1 promoter and/or pcDNA3 dnIRF-1 vector using TFX-50 transfection agent (Promega) at a 1:4 ratio (DNA:TFX agent). After 24 h of recovery, the cells were stimulated with IFN-γ (100 U/ml for 0–48 h) and the luciferase expression was measured using a commercially available kit (Renilla luciferase assay kit; Promega). Results were presented as mean ± SD of relative luminescence units per micrograms protein (rlu/μg protein).
Lymphocyte proliferation assay and flow cytometry.
Lymphocyte proliferation assay was performed using spleens from MOG35–55- and OVA (ovalbumin)323–339-immunized and CFA-injected wild-type and transgenic mice as we have previously described (Balabanov et al., 2007). Briefly, mouse lymphocytes were isolated at day 8PI by compressing the spleen tissue against a metallic mesh, filtering through a 30 μm filter, and plating them in a 90-well plate at density of 5 × 10⁵ cells/well in a total volume of 200 μl of HL-1 medium (BioWhittaker) and 1% ampicillin/streptomycin (Sigma-Aldrich). MOG35–55 or OVA323–339 (Genemed Synthesis) were added to the cultures at various concentrations (0–50 μg/ml) in triplicates for 72 h. Cell proliferation was measured by quantitation of 5′-bromo-2′-deaxyuridine incorporation into the genomic DNA using a commercially available calorimetric kit and according to the manufacturer's protocol (Calbiochem). The results are presented as mean ± SD of samples' optical density (O.D.) measured at 450 nm (Balabanov et al., 2007).
Flow cytometry was performed using multicolor analysis as we have previously described (Ren et al., 2011). Immunostaining was performed using anti-CD4/FITC (dilution 1:100; BD Bioscience), anti-IFN-γ/PerCPCy5.5 antibodies (Peridinin-chlorophyll protein-Cyanin 5.5, dilution 1:100; BD Bioscience), anti-interleukin 17a/APC-Cy7 (Allophycocyanin-Cyanin 7, dilution 1:100, BD Bioscience), and MOG35–55 tetramer-phycoerytrin (concentration 6 μg/ml; NIH tetramer facility at Emory University, Atlanta, GA).
Animal care and procedures.
All animal procedures were conducted in compliance with the National Institutes of Health Guide for Care and Use of Laboratory Animals and were approved by the Institutional Animal Care and Use Committee of the Rush University Medical Center.
Statistical analysis.
All data were generated from at least three independent experiments. Means and SDs were calculated using Average, Stdev, in Microsoft Excel (Microsoft). Comparison of variables was performed using one-way ANOVA in SSPS program (SPSS). A statistically significant difference was defined as p < 0.05.
Results
Characterization of CNP/dnIRF-1 mice
CNP/dnIRF-1 transgenic mice were designed to express the dnIRF-1 specifically in oligodendrocytes (Fig. 1A–C). Newly generated transgenic mice were identified by Southern blot and PCR using a dnIRF-1-specific 458 bp hybridization probe and primers, respectively, recognizing the regions flanking the deleted portion of dnIRF-1 (Fig. 1D). These mice exhibited no phenotypic abnormalities and lived a normal life span. They bred normally and produced a litter with a size (8–12 pups) comparable to the wild-type mice. The mode of transgene inheritance followed the Mendelian pattern for a single gene without gender predilection.
Expression of dnIRF-1 was characterized at RNA, protein, and cellular levels. Brains of CNP/dnIRF-1 and wild-type mice were obtained at the age of 4 weeks, and total RNA and protein were isolated. Northern blot was performed with the 485 bp hybridization probe and revealed a high intensity band with the CNP/dnIRF-1 but not wild-type RNA samples (Fig. 1E). Similarly, RT-PCR performed using transgene-specific primers generated products with the expected molecular size of 267 bp only with the CNP/dnIRF-1 and not wild-type RNA samples (Fig. 1F). Western blot was performed using protein samples from both mouse groups and anti-IRF-1 antibodies recognizing the C terminus (which is present in both the dnIRF-1 and wild-type IRF-1) and the middle portion (M-part, which is present in wild-type IRF-1 but absent in dnIRF-1) of the molecule. The blots demonstrated a band with the expected molecular size of 17 kDa (the molecular size of wild type IRF-1 is 48 kDa) only with the CNP/dnIRF-1, and only with the anti-C terminus IRF-1 antibody, but not with the M-part antibody (Fig. 1A,G). No immunopositivity was detected with the wild-type protein samples with either IRF-1 antibody. Additionally, EMSA was performed using brain nuclear extracts from either CNP/dnIRF-1 or wild-type mice and from Caspase 1 promoter IRF-E oligonucleotides. The assay demonstrated a significant mobility shift with the CNP/dnIRF-1 samples compared with control (no nuclear extract) and wild-type samples, indicating that dnIRF-1 has the capacity to bind to IRF-1 regulatory sequence. Mobility shift with wild-type samples was minimal and close to the control levels, reflecting the minimal baseline expression of IRF-1 (Fig. 1H). Finally, RT-PCR and Q-PCR analysis of RNA from various peripheral mouse organs, including thymus and spleen, revealed insignificant transgene expression outside the nervous system (Fig. 1I,J).
Oligodendrocyte-specific expression of dnIRF-1 was established by dual immunostaining of CNP/dnIRF-1 and wild-type brain tissue using the anti-IRF-1 (C terminus) and CC1 antibodies (Fig. 2A–F). Strong immunopositivity for C terminus IRF-1 was observed in the transgenic brains only, which colocalized with the CC1(+) cells and their DAPI-stained nuclei. Overall, >94% of the CC1(+) cells were also positive for C terminus IRF-1; non-colocalizing immunopositivity for C terminus IRF-1 was not detected. As expected and previously reported, wild-type brains demonstrated virtually no immunopositivity for C terminus IRF-1 (Wang et al., 2010). No significant difference in the number of CC1(+) cells was observed in the corpus callosum between the transgenic and the wild-type mice (298 ± 4.6/mm2 and 288 ± 6.0/mm2, respectively; p > 0.05).
Figure 2.

Cellular localization of dnIRF-1 expression. A–F, Localization of dnIRF-1 in vivo. Brains from CNP/dnIRF-1 (A–C) and wild-type (WT; D–F) mice were immunostained with anti-IRF-1 (C terminus)/FITC and CC1/Cy3 antibodies and with DAPI. Note that the immunopositivity for C terminus IRF-1 colocalized with CC1(+) cells and their DAPI-stained nuclei in the transgenic tissue samples. All wild-type samples were immunonegative for IRF-1 C terminus. Scale bar, 200 μm. G–L, Localization of dnIRF-1 in vitro. Oligodendrocytes from CNP/dnIRF-1 (G–I) and wild-type (J–L) mice were immunostained with anti-IRF-1 (C terminus)/FITC and anti-PLP/Cy3 antibodies and with DAPI. In the transgenic cultures, IRF-1 C terminus colocalizated with the PLP(+) cells and their DAPI-stained nuclei. No such positivity was detected in the wild-type PLP(+) cells. Scale bar, 50 μm.
Transgene expression was also examined in vitro. Dual immunostaining with anti-IRF-1 (C terminus) and anti-PLP antibodies of CNP/dnIRF-1 and wild-type oligodendrocyte cultures demonstrated colocalizing immunopositivity only in the transgenic cultures (Fig. 2G–L). At the subcellular level, the dnIRF-1 protein appeared to be localized in the cell body and cell nucleus of the transgenic oligodendrocytes. Virtually all PLP(+) cells in the transgenic cultures were also positive for C terminus IRF-1. No C terminus IRF-1 was detected in the PLP(−) transgenic cells or in any of the wild-type cultures.
CNP/dnIRF-1 mice displayed suppressed IRF-1 signaling in oligodendrocytes
The functional capacity of dnIRF-1 to suppress IRF-1 signaling was explored in both in vivo and in vitro systems (Figs. 3–5). Specifically, we assessed the capacity of dnIRF-1 to inhibit the IRF-1-dependent induction of MHC class I molecule and Caspase 1 expression. The dependency of MHC class I molecule and Caspase 1 expression on IRF-1 signaling has been previously described in detail by us and others (Matsuyama et al., 1993; Agresti et al., 1998; Wang et al., 2010, Ren et al., 2011). MBP/IFN-γ transgenic mice, which constitutively express IFN-γ and MHC class I molecule in the CNS, were chosen as the in vivo experimental system. MBP/IFN-γ mice were mated to the CNP/dnIRF-1 mice and the single- and double-transgenic progeny were examined for differences in MHC class I molecule expression in the CNS (Fig. 3). In addition, we monitored for oligodendrocyte expression of STAT1 and IRF-1, the upstream regulators of MHC class I molecule expression, in these experiments (Fig. 4). Dual immunostaining was performed using anti-MHC class I molecule and anti-PLP antibodies, as well as using anti-STAT1, anti-IRF-1 (M-part antibody), and CC1 antibodies, and their signals were overlaid to determine colocalization. Predictably, wild-type and CNP/dnIRF-1 mice expressed no detectable levels of MHC class I molecule expression (Fig. 3A–H). STAT1 expression was detected in both mouse groups but no IRF-1 was observed in any of them (Fig. 4A,B,K,L). MBP/IFN-γ single-transgenic mice, as previously described, displayed increased expression of MHC class I molecule that colocalized with the PLP(+) myelined tracts, as well as with the surrounding PLP(−) regions (Fig. 3I–L) (Balabanov et al., 2006). Correspondingly, increased expression of STAT1 and IRF-1 colocalizing with the CC1(+) cells was observed in these mice (Fig. 4C,E, G,I,M,O,Q,S) (Wang et al., 2010). However, double-transgenic (MBP/IFN-γ × CNP/dnIR-1) mice demonstrated a differential pattern of MHC class I molecule and PLP expression (Fig. 3M–P). MHC class I molecule expression colocalized with the PLP(−) regions but not with the PLP(+) myelinated tracts. The lack of MHC class I molecule expression in the myelinated tracts was observed throughout their entire length and structural margins. Furthermore, CC1(+) cells expressing STAT1 and IRF-1 were detected in the corresponding monitoring samples in patterns similar to those seen in the MBP/IFN-γ mice (Fig. 4C–J,M–T).
Figure 3.
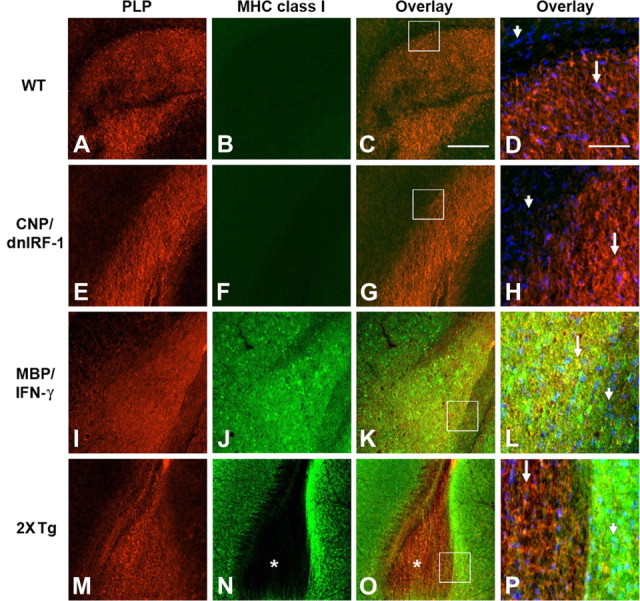
Differential suppression of MHC class I molecule expression by dnIRF-1 in vivo. A–P, Dual immunostaining of corpus callosum of wild-type (WT, A–D), CNP/dnIRF-1 (E–H), MBP/IFN-γ (I–L), and MBP/IFN-γ × CNP/dnIRF-1 double-transgenic mice (2xTg; M–P) using anti-PLP/Cy3 and anti-MHC class I/FITC antibodies and DAPI. Arrows, PLP(+) cells; arrowheads, PLP(−) cells; boxed areas, area of high magnification shown in D, H, L, and P. No MHC class I expression was detected in the wild-type (B) or CNP/dnIRF-1 (F) mice. In MBP/IFN-γ mice, MHC class I was detected in both the PLP(+) and PLP(−) cells and structures (K, L, overlays). In double-transgenic mice, the PLP(+) corpus callosum displayed little immunopositivity for MHC class I (N, O; asterisks). Higher magnification (P) further demonstrated the coexistence of PLP(+)/MHC class I(−) cells (arrow) and the PLP(−)/MHC class(+) cells (arrowhead). Scale bars: A–C, E–G, I–K, M–O (in C), 300 μm; D, H, L, P (in D), 50 μm.
Figure 4.
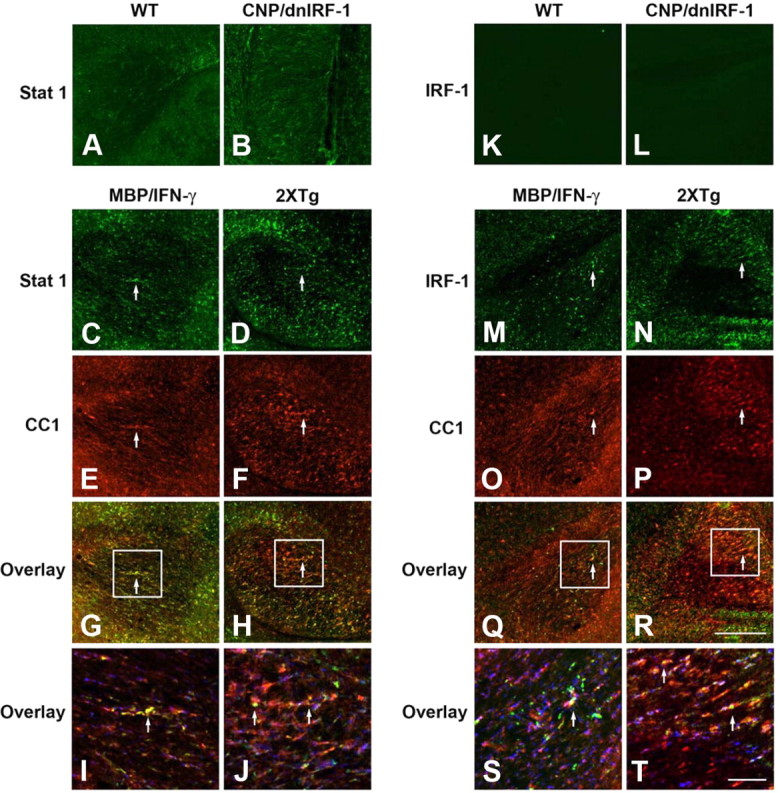
Expression of STAT1 and IRF-1 in the presence of dnIRF-1 in vivo. A, B, Immunostaining of corpus callosum of wild-type (WT, A) and CNP/dnIRF-1 (B) mice using anti-STAT1/FITC antibody. C–J, Dual immunostaining of MBP/IFN-γ (C, E, G, I) and MBP/IFN-γ × CNP/dnIRF-1 double-transgenic (2XTg; D, F, H, J) mice using anti-STAT1/FITC and CC1/Cy3 antibodies. K, L, Immunostaining of corpus callosum of wild-type (K) and CNP/dnIRF-1 (L) mice using anti-IRF-1 (M-part)/FITC antibody. M–T, Dual immunostaining of MBP/IFN-γ (M, O, Q, S) and MBP/IFN-γ × CNP/dnIRF-1 double-transgenic (N, P, R, T) mice using anti-IRF-1/FITC and CC1/Cy3. Note the upregulated expression of STAT1 and IRF-1 and their colocalization with CC1(+) cells in the MBP/IFN-γ and MBP/IFN-γ × CNP/dnIRF-1 mice at lower (G, H, Q, P) and at higher (I, J, S, T) magnification. Boxed areas, Areas of magnification; arrows, dual-positive cells. Scale bars: A–H, K–R (in R), 200 μm; I, J, S, T (in T), 50 μm.
Figure 5.
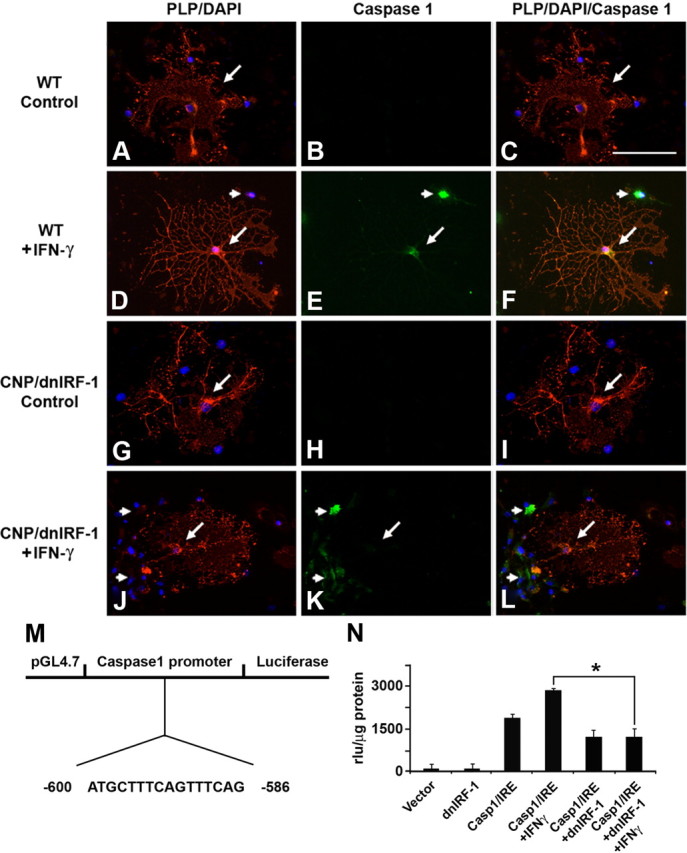
Differential suppression of Caspase 1 expression by dnIRF-1 in vitro. Mixed glial cultures generated from wild-type (WT, A–F) and CNP/dnIRF-1 (G–L) mouse brains were treated with IFN-γ (100 U/ml/24 h) and tested for Caspase 1 expression. D, E, The cells were immunostained with anti-PLP/Cy3 and anti-Caspase 1/FITC antibodies and DAPI. Note that treatment of wild-type cultures induced Caspase 1 expression in PLP(+) (arrow) and PLP(−) (arrowheads) cells. J–L, In contrast, treatment of transgenic cultures induced Caspase 1 expression only in the PLP(−) (arrowheads) but not in the PLP(+) (arrow) cells. None of the unstimulated cells (control) expressed Caspase 1. Scale bar, 30 μm. M, Map of the Caspase 1 promoter vector depicting the IRF-E sequence. N, Promoter reporter (luciferase) assay. Note the induction of luciferase expression upon stimulation with IFN-γ and its suppression in the presence of dnIRF-1. *p < 0.05.
Differential suppression of IRF-1 signaling was also observed in vitro (Fig. 5). Primary mixed oligodendrocyte cell cultures originating from CNP/dnIRF-1 and wild-type mice were treated with IFN-γ (100 U/ml/24 h) and immunostained using anti-PLP and anti-Caspase 1 antibodies along with DAPI nuclear stain. As expected, stimulation of wild-type cultures with IFN-γ resulted in upregulation of Caspase 1 expression by both PLP(+) and PLP(−) cells (Fig. 5A–F). Virtually all wild-type PLP(+) oligodendrocytes were also Caspase 1(+) (96 ± 0.6% of all cells). However, stimulation of transgenic cultures induced differential expression by only the PLP(−) cells (Fig. 5G–L). The transgenic PLP(+) oligodendrocytes did not upregulate Caspase 1 significantly. Caspase 1 was detected only occasionally in PLP(+) transgenic oligodendrocytes (6 ± 0.8% of all cells). Notably, this was in contrast to the response of the surrounding PLP(−) cells, in addition to the PLP(+) and PLP(−) cells in the wild-type cultures. In confirmation of these findings, a promoter reporter assay was also performed using HOG cells transfected with a pGL4.17 vector construct containing the human Caspase 1 promoter/luciferase gene and/or a pcDNA3 containing the dnIRF-1. Cotransfection with both vectors was also performed to examine the effect of dnIRF-1 on Caspase 1 promoter activity. Cells were treated with 100 U of IFN-γ for 48 h and luciferase expression was measured by luminometry. Predictably, treatment of HOG cells containing Caspase 1 promoter with IFN-γ resulted in significant upregulation of luciferase expression compared with untreated cells (2850 ± 152 vs 1875 ± 214 rlu/μg protein in treated and untreated cells, respectively; p < 0.05) (Ren et al., 2011). However, treatment of HOG cells containing both Caspase 1 promoter and dnIRF-1 resulted in suppressed activity of Caspase 1 promoter and reduced IFN-γ induction of luciferase expression (2850 ± 152 rlu/μg protein in Caspase1 promoter containing vs 1215 ± 318 rlu/μg protein in Caspase 1 promoter/dnIRF-1-containing cells; p < 0.05).
CNP/dnIRF-1 mice were protected against EAE
To examine the effect of transgenically expressed dnIRF-1 on inflammatory demyelination, we performed EAE experiments (Fig. 6). A total of 34 mice, wild-type and CNP/dnIRF-1, from identical litters were selected for the EAE experiments; three separate experiments were performed. The mice were divided in four experimental groups, as follows: (1) 12 wild-type mice and (2) 12 CNP/dnIRF-1 mice received full immunization (MOG35–55 emulsified in CFA) and (3) six wild-type mice and (4) six CNP/dnIRF-1 mice were injected with CFA only. Fully immunized wild-type mice developed significant clinical disease. The pattern of a severe acute phase followed by a milder chronic phase was observed during the clinical course of their disease. In contrast, the CNP/dnRF-1 mice appeared to be protected against EAE (Fig. 6A). They developed significantly milder clinical symptoms and shorter disease duration compared with the wild-type mice (maximum clinical score: 1.2 ± 0.3 in CNP/dnRF-1 mice vs 3.5 ± 0.2 in wild-type mice, p < 0.05; disease duration: 9.8 ± 1.8 d in transgenic mice vs 47 ± 1.4 d in wild-type mice, p < 0.05). None of the CFA-injected control mice, either transgenic or wild-type, developed clinical symptoms during the course of these experiments.
Figure 6.
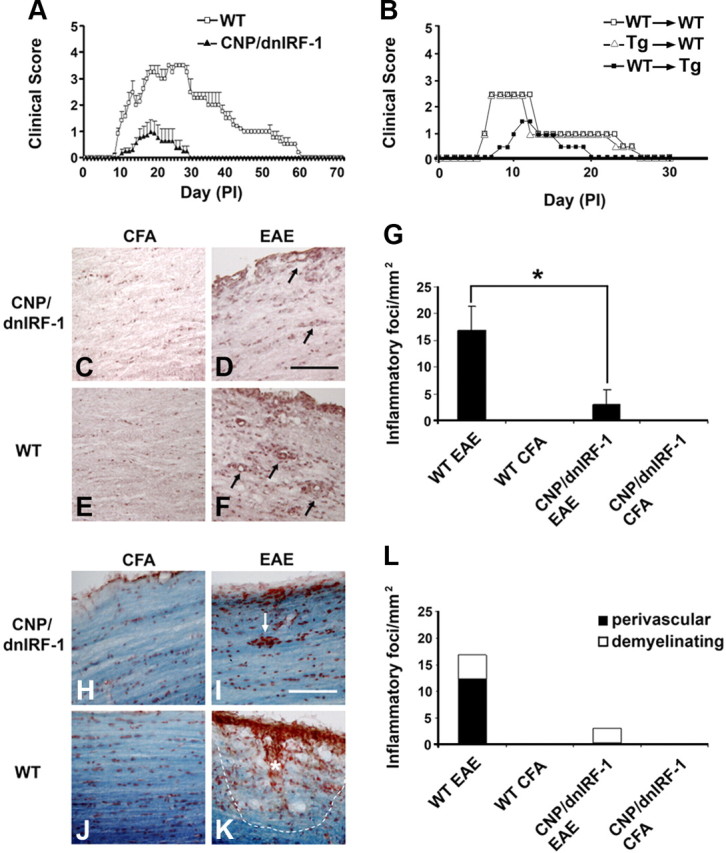
EAE in CNP/dnIRF-1 mice. A, Active immunization EAE. Clinical scores of CNP/dnIRF-1 and wild-type (WT) mice (n = 12 animals/group). CFA-injected controls were not included in the figure. B, Adoptive transfer of EAE, wild-type-to-wild-type (WT→WT), wild-type-to-CNP/dnIRF-1 transgenic (WT→Tg), and CNP/dnIRF-1 transgenic-to-wild-type (Tg→WT) mice (n = 3 animals/group). For clarity, only the mean values of the daily scores are presented. C–F, Representative images depicting inflammatory foci in CNP/dnIRF-1 and wild type mice that were either injected with CFA only or fully immunized (EAE). H&E staining of spinal cords at day 12PI; arrows, inflammatory foci. Scale bar, 200 μm. G, Quantitation of the inflammatory foci in EAE samples (n = 3 animals/group). *p < 0.05. H–K, Representative images depicting demyelinating foci in CNP/dnIRF-1 and wild-type mice that were either injected with CFA only or fully immunized (EAE). LFB&NR staining of spinal cords at day 12PI; arrow, non-demyelinating perivascular focus. Asterisk marks a parenchymal demyelinating focus and the dotted line its margin. Scale bar, 200 μm. L, Quantitation of demyelinating foci in EAE samples (n = 3 animals/group). Note that the CNP/dnIRF-1 mice were protected against EAE compared with wild-type mice.
As we mentioned above, dnIRF-1 was expressed exclusively in the nervous system of the CNP/dnIRF-1 mice. Nonetheless, we performed a number of experiments to control for any aberrant effect of the transgene on the immune system, including an adoptive transfer of EAE and a comparison of peripheral lymphocyte responses to MOG35–55 and OVA323–339 antigens. Six additional wild-type and CNP/dnIRF-1 mice were killed at day 8PI and their spleens were harvested and lymphocytes purified. The lymphocytes were proliferated in vitro in the presence of the MOG35–55 and then injected into the tail veins of naive mice to induce EAE (Fig. 6B). Adoptive transfer of wild-type or CNP/dnIRF-1 cells into wild-type mice resulted in significant disease that was comparable in severity in both transfers (maximum clinical score: 2.6 ± 0.4 in wild-type-to-wild-type transfer and 2.5 ± 0.2 in transgenic-to-wild-type transfer, n = 3 animals/group, p > 0.05). In contrast, significantly milder disease was induced in a wild-type-to-transgenic transfer compared with the wild-type-to-wild-type transfer (maximum clinical score: 1.4 ± 0.3 vs 2.6 ± 0.4; disease duration: 10 ± 1 d vs 20.5 ± 1.3 d, respectively; n = 3 animals/group, p < 0.05 for both comparisons). Correspondingly performed experiments with lymphocytes derived from CFA-injected mice failed to produce any disease.
The capacities of wild-type and CNP/dnIRF-1 lymphocytes to respond to MOG35–55 were also examined in these experiments by comparing the percentages of total CD4(+), IFN-γ(+)/CD4(+), IL17(+)/CD4(+), and MOG35–55 tetramer(+)/CD4(+) cells, as well as the rate of lymphocyte proliferation, upon antigen stimulation in vitro (Figs. 7, 8). Flow cytometry analysis revealed no significant differences among the tested cell populations of wild-type and CNP/dnIRF-1 mice (Fig. 7A–D, 8A–D). More specifically, the CD4(+) populations of the fully immunized mice that were also stimulated with MOG35–55 were statistically similar (10.3 ± 0.9% vs 9.4% ±1 for total CD4(+) cells, 4.1 ± 0.3% vs 3.7 ± 0.15% for IFN-γ(+)/CD4(+), 1.2 ± 0.25% vs 0.9 ± 0.34 for IL17(+)/CD4(+), and 1.7 ± 0.4% vs 1.8 ± 0.15% for MOG35–55 tetramer(+)/CD4(+) cells, for wild-type vs CNP/dnIRF-1 mice, respectively; n = 3 animals/group, p > 0.05 for all comparisons). Lymphocyte proliferation experiments demonstrated significant antigen-dependent lymphocyte proliferation in all cultures originating from MOG35–55-immunized mice. The proliferative responses to MOG35–55 stimulation were antigen-specific, dose-dependent, and compatible between wild-type and CNP/dnIRF-1 mouse lymphocytes (0.2 ± 0.03 O.D. for wild-type and 0.195 ± 0.04 O.D. for CNP/dnIRF-1 lymphocytes at 50 μg/ml peptide concentration; n = 3 animals/group, p > 0.05) (Fig. 7E,F). In contrast, the lymphocytes proliferative responses of CFA-injected control mice were close to the background levels even at the highest peptide concentration. Similar antigen-specific and dose-dependent lymphocyte proliferative responses were observed following immunization with OVA323–339 and subsequent restimulation in vitro (0.078 ± 0.004 O.D. for wild-type and 0.075 ± 0.006 O.D. for CNP/dnIRF-1 mice; n = 3 animals/group, p > 0.05) (Fig. 7 G, H). Most importantly, however, no significant differences were observed between the lymphocyte proliferative responses of wild-type and CNP/dnIRF-1 mice with any immunization or in vitro treatment (medium, MOG35–55, OVA323–339) or any peptide concentration.
Figure 7.

Lymphocyte responses of CNP/dnIRF-1 mice. A–D, Quantitation of various CD4(+) cell populations derived from spleens of fully immunized wild-type (WT) and CNP/dnIRF-1 mice at day 8PI, stimulated with either culture medium or MOG35–55 in vitro. The data are based on flow cytometry analysis (n = 3 animals/group). A, Quantitation of total CD4(+) cells. B, Quantitation of CD4(+)/IFN-γ(+) cells. C, Quantitation of CD4(+)/IL-17(+) cells. D, Quantitation of CD4(+)/MOG35–55 tetramer(+) cells. E, F, Lymphocyte proliferation (BrdU) assays using cells derived from spleens of MOG35–55-immunized wild-type (WT MOG) and CNP/dnIRF-1 (Tg MOG) and CFA-injected (WT CFA and Tg CFA) mice at day 8PI, and stimulated with medium, MOG35–55, or OVA323–339 in vitro (n = 3 animals/group). E, Lymphocyte proliferation assay using medium or MOG35–55 (0–50 μg/ml). F, Lymphocyte proliferation assay using medium or OVA323–339 (0–50 μg/ml). G, H, Lymphocyte proliferation (BrdU) assays using cells derived from spleens of OVA323–339-immunized wild-type (WT OVA) and CNP/dnIRF-1 (Tg OVA) and CFA-injected mice at day 8PI, and stimulated with medium, OVA323–339, or MOG35–55 in vitro (n = 3 animals/group). G, Lymphocyte proliferation assay using medium or OVA323–339 (0–50 μg/ml). H, Lymphocyte proliferation assay using medium or MOG35–55 (0–50 μg/ml). Note that no significant differences were identified between the lymphocyte responses of wild-type and CNP/dnIRF-1 mice (p > 0.05 in all comparisons).
Figure 8.
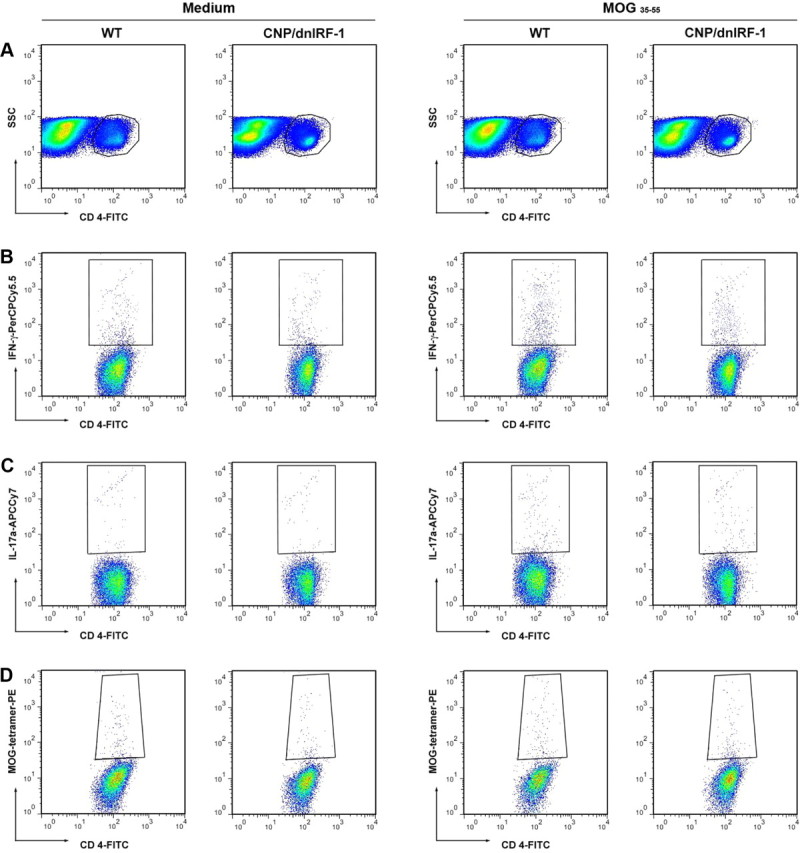
Flow cytometry analysis of CNP/dnIRF-1 mice. A–D, Representative images of multicolor flow cytometry analysis of CD4(+) cells derived from fully immunized wild-type (WT) and CNP/dnIRF-1 mice that were stimulated with either culture medium or MOG35–55 in vitro. A, Dot plots depict the gating of CD4(+) cell populations. B, Dot plots depict CD4(+)/IFN-γ(+) cells. C, Dot plots depict CD4(+)/IL-17(+) cells. D, Dot plots depict CD4(+)/MOG35–55 tetramer(+) cells. Note that the CD4(+) cell populations of interest are gated.
In an effort to determine the underlying mechanism of the observed protection in CNP/dnIRF-1 mice, we compared the CNS pathology of fully immunized and CFA-injected wild-type and transgenic mice. Three mice per study group were killed during the acute phase of the disease and their brains and spinal cords were harvested. Tissue samples were processed as sagittal frozen sections and stained with either H&E or LFB&NR to assess for the presence of inflammatory foci and demyelination. Examination of the pathological samples of fully immunized CNP/dnIRF-1 and wild-type mice revealed general similarities in lesion distribution. Perivascular mononuclear infiltrates involving the meninges and spinal cord parenchyma were observed in both groups (Fig. 6C–F). However, while the CNP/dnIRF-1 and wild-type mice have displayed comparable inflammatory involvement of the meninges, they significantly differed in the number of parenchymal inflammatory foci (1.3 ± 0.8 vs 17.7 ± 4.9 inflammatory foci/mm2 in CNP/dnIRF-1 mice and wild-type mice, respectively; p < 0.05) (Fig. 6G). They also differed in terms of the spread of the inflammatory foci and loss of myelin (loss of LFB&NR staining). The inflammatory foci in the CNP/dnIRF-1 mice appeared to be localized predominantly in the perivascular space and associated with little myelin loss. In contrast, the inflammatory foci in the wild-type mice were observed to have invaded the parenchyma and the myelinated tracts. The latter were associated with significant myelin loss, presence of myelin debris, and phagocytosis (Fig. 6H–K). Quantitatively, the parenchymal demyelinating lesions accounted for up to 85.7% of all lesions in the wild-type mice as opposed to 0.1% in the CNP/dnIRF-1 mice (Fig. 6L). No inflammatory or myelin changes were observed in the CFA-injected mice.
CNP/dnIRF-1 mice displayed oligodendrocyte and axonal preservation in EAE
Because the oligodendrocytes in CNP/dnIRF-1 and wild-type mice differ in their IRF-1 signaling, we examined the pathological samples for differential expression of Caspase 1 and presence of TUNEL positivity (a marker for DNA fragmentation and cell apoptosis) in oligodendrocytes (Fig. 9). Dual immunostaining using anti-Caspase 1 and CC1 antibodies was performed with all four groups and the number of Caspase 1(+)/CC1(+) cells was quantitated (Fig. 9A–F). A significant difference in the number of double-positive cells was observed between the fully immunized CNP/dnIRF-1 and wild-type mice (0.3 ± 0.2/mm2 in CNP/dnIRF-1 mice vs 7.2 ± 0.2/mm2 in wild-type mice; p < 0.05) (Fig. 9G). Caspase 1 expression was not detected in any of the CFA-injected control mice. TUNEL staining and immunostaining with CC1 antibody were performed in parallel, and the number of the TUNEL(+)/CC1(+) cells was quantitated as above (Fig. 9H–M). Similarly, we found a significant difference in the number of double-positive cells between the fully immunized CNP/dnIRF-1 and wild-type mice (0.2 ± 0.1/mm2 in CNP/dnIRF-1 and 10.6 ± 0.5/mm2 in wild-type mice; p < 0.05) (Fig. 9N). No TUNEL(+) cells were observed in the CFA-injected control mice.
Figure 9.
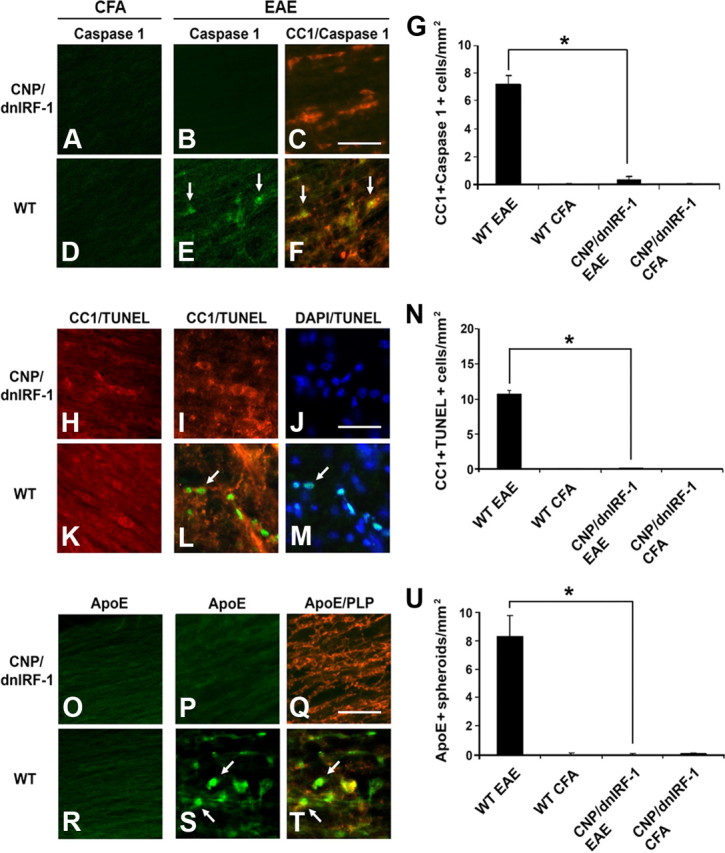
Oligodendrocyte and axonal preservation in CNP/dnIRF-1 mice. A–F, Representative images of Caspase 1 expression in CNP/dnIRF-1 and wild-type (WT) mice. Dual immunostaining of spinal cords with anti-Caspase 1/FITC, anti-CC1/Cy3 antibodies, and DAPI, performed at day 12PI. G, Quantitation of Caspase 1(+)/CC1(+) cells/mm2 in EAE samples (n = 3 animals/group). H–M, Representative images of TUNEL positivity in CNP/dnIRF-1 and wild-type mice. Dual immunostaining of spinal cords with TUNEL/FITC, CC1/Cy3 antibody, and DAPI at day 12PI. N, Quantitation of TUNEL(+)/CC1(+) cells/mm2 in EAE samples (n = 3 animals/group). O–T, Representative images of ApoE expression in CNP/dnIRF-1 and wild-type mice. Dual immunostaining performed with anti-ApoE/FITC and anti-PLP/Cy3 antibodies of spinal cords at day 12PI. U, Quantitation of the ApoE(+) spheroids/mm2 in EAE samples (n = 3 animals/group). Note that the CNP/dnIRF-1 mice were protected against EAE compared with wild-type mice. Arrows, Dual-positive cells. Scale bars, 200 μm. *p < 0.05.
Pathological samples were also examined for evidence of axonal injury in relation to inflammatory demyelination. Dual immunostaining using anti-ApoE (a marker for axonal injury) and anti-PLP antibodies was performed and the immunopositive signals were overlaid. Distinct pattern differences between the fully immunized CNP/dnIRF-1 and wild-type mice were observed. CNP/dnIRF-1 mice displayed diffuse and faint linear ApoE immunopositivity, which was observed in close proximity to, as well as distally from, the inflammatory foci, and colocalized with the PLP immunopositivity. This pattern of immunopositivity was also observed in the CFA-injected control mice. In contrast, fully immunized wild-type mice demonstrated increased and discontinuous spheroid-like immunopositivity within the areas of inflammation that poorly colocalized with the PLP immunopositivity, since the latter appeared shattered (Fig. 9O–T). Direct comparison of the number of ApoE(+) spheroids in fully immunized CNP/dnIRF-1 and wild-type mice showed significant differences (0.03 ± 0.01/mm2 in CNP/dnIRF-1 mice and 8.3 ± 1.5/mm2 in wild-type mice; p < 0.05) (Fig. 9U). No ApoE(+) spheroids were detected in the CFA-injected controls.
Discussion
The goal of this study was to examine the role of IRF-1 in oligodendrocyte injury and inflammatory demyelination. For the purpose of this study, we generated a CNP/dnIRF-1 transgenic mouse line that overexpresses dnIRF-1 specifically in oligodendrocytes. CNP/dnIRF-1 mice exhibited no phenotypic abnormalities but displayed suppressed IRF-1 signaling in oligodendrocytes, as assessed by impaired induction of MHC class I molecule and Caspase 1 expression. The major finding of our study was that the CNP/dnIRF-1 mice, when compared with wild-type mice, were protected against EAE, a phenomenon associated with significant reduction of inflammatory demyelination and oligodendrocyte and axonal preservation. We did not identify any significant transgene expression or functional alterations in the immune organs or cells of the CNP/dnIRF-1 mice throughout these experiments. Therefore, the protection against EAE observed in the CNP/dnIRF-1 mice is best attributed to suppressed IRF-1 signaling in oligodendrocytes. In summary, our study demonstrates that IRF-1 expressed by oligodendrocytes is involved in the mechanisms of inflammatory demyelination and plays a key regulatory role in the pathogenesis of EAE.
A single nucleotide polymorphism of the IRF-1 gene has been identified with patients with progressive MS (Fortunato et al., 2008). Mice lacking IRF-1 are resistant to EAE, a finding that corroborates with this clinical observation (Tada et al., 1997; Buch et al., 2003). Recently, we reported that IRF-1 is expressed by the CNS glial cells in MS and EAE and regulates inflammatory demyelination independently of the peripheral immune cells (Ren et al., 2011). Specifically, using the bone-marrow chimera model of EAE, we demonstrated that mice differentially lacking IRF-1 in the CNS appear to be protected against EAE despite the presence of IRF-1 in the peripheral immune cells; in contrast, mice expressing IRF-1 in the CNS developed severe disease even the absence of IRF-1 in the periphery (Ren et al., 2010, 2011). To further dissect the role of IRF-1 in inflammatory demyelination and oligodendrocyte injury, we generated a transgenic mouse line that overexpressed the dnIRF-1, a competitive inhibitor of IRF-1 transcriptional activities, under the transcriptional control of an oligodendrocyte-specific (CNP) promoter. CNP/dnIRF-1 mice displayed no phenotypic or histological abnormalities. Expression of dnIRF-1 was significant and restricted to CNS oligodendrocytes. Functional examination of CNP/dnIRF-1 mice further demonstrated suppression of IRF-1 signaling in oligodendrocytes, assessed by inhibition of IFN-γ-induced MHC class I molecule and Caspase 1 expression. Our findings are supported by the phenotypic characteristics of IRF-1(−/−) knock-out mice, which display no significant oligodendrocyte or phenotypic abnormalities, with the exception of suppressed responses to IFN-γ (Ren et al., 2011). Evidently, IRF-1 signaling is not essential for the normal development of oligodendrocytes but may play a differential role in immune-mediated injury.
Our EAE experiments using the CNP/dnIRF-1 mice demonstrated that oligodendrocyte-specific suppression of IRF-1 signaling had a significant impact on the natural course of the disease and the degree of CNS inflammation. This finding is seemingly at odds with the conventional notion that CNS inflammation is regulated only by the cells of the immune system and that the targets of the immune response, such as oligodendrocytes, are merely receivers of injury. However, our finding is in line with several experimental studies demonstrating that exogenous factors that interfere with the mechanisms of oligodendrocyte injury not only alter oligodendrocyte survival but also affect the degree of CNS inflammation (Butzkueven et al., 2002; Linker et al., 2002; Mi et al., 2007). Additionally, mice lacking proapoptotic genes, such as Caspase 11 or Fas, or overexpressing antiapoptotic molecules, such as p35 caspase inhibitor, specifically in oligodendrocytes display a resistance to EAE and inflammatory demyelination (Hisahara et al., 2000, 2003, Hövelmeyer et al., 2005). Furthermore, the critical involvement of oligodendrocytes in CNS inflammation is suggested by experiments with mice that have peroxisome-deficient oligodendrocytes. These mice develop not only oligodendrocyte apoptosis, but also spontaneous CNS inflammation, including T and B cell infiltration, and widespread axonal degeneration (Kassmann et al., 2007).
The oligodendrocyte-dependent mechanisms involved in the regulation of EAE are still unknown. One can contemplate induction of chemokine CXCL10 expression by the oligodendrocytes or release of myelin-derived proinflammatory lipids upon injury (Balabanov et al., 2007; Kassmann et al., 2007). In addition, increased oligodendrocyte susceptibility to injury may impact the process of antigen presentation. Because the induction of EAE depends on de novo antigen presentation in the CNS, injured oligodendrocytes may increase the availability of priming antigen, thereby accelerating the inflammatory process (Tompkins et al., 2002). Finally, pyroptosis, a process of cell death mediated by Caspase 1, characteristically triggers an inflammatory reaction, thus implying that the process of oligodendrocyte cell death by itself may impact the extent of inflammation (Fink and Cookson, 2005; Bergsbaken et al., 2009). Our study implicated IRF-1 signaling in oligodendrocytes as a disease-promoting mechanism. IRF-1 has been shown to positively regulate the expression of MHC class I molecule and TNF-αR in oligodendrocytes in vitro (Agresti et al., 1998). Additionally, we have demonstrated that IRF-1 controls the expression of Caspase 1 in oligodendrocytes, indicating its involvement in the mechanisms of cell death (Wang et al., 2010; Ren et al., 2011). Therefore, it appears that IRF-1 regulates oligodendrocyte response to inflammation and the induction of proinflammatory cell death (pyroptosis).
The present study is a continuation of our efforts to better understand the molecular mechanisms of how oligodendrocytes are involved in the neuroimmune network and respond to inflammation. Previously, we have reported that targeted expression of the suppressor of cytokine signaling 1 (SOCS1), a competitive inhibitor of IFN-γ-induced Jak-STAT1 interactions, in oligodendrocytes altered the clinicopathological characteristics of EAE in transgenic mice (Balabanov et al., 2007). SOCS1 transgenic mice developed EAE earlier compared with wild-type mice, but despite this, they recovered much faster. It was hypothesized that the observed dual effect (proinjurious and protective) of SOCS1 was due to simultaneous interference with two signaling pathways originating from the activated Jak: STAT1-dependent and STAT1 independent pathways. As described in peripheral non-CNS cells, the STAT1-dependent pathway controls the expression of MHC molecules and several proapoptotic molecules, whereas the STAT1-independent pathway promotes the growth and survival of cells (Ramana et al., 2002). The dichotomy of IFN-γ signaling prompted us to investigate IRF-1, which we previously identified as the STAT1-dependent factor mediating IFN-γ's injurious effect on OPC (Wang et al., 2010). Our present study demonstrated that IRF-1 indeed plays a proinflammatory role in oligodendrocytes in the course of EAE, likely by linking the initial Jak/STAT1 signal and the downstream genes with immune and proapoptotic functions, such as MHC class I molecule and Caspase 1. The observed dramatic protection of CNP/dnIRF-1 mice against EAE further indicates that STAT1/IRF-1 signaling pathway plays the critical role in oligodendrocyte response to inflammation.
Protection of oligodendrocytes in our experiments was associated with significant axonal preservation. In the settings of demyelinating diseases, loss of myelin is a symptom-producing pathology, as it compromises the saltatory propagation of the axon potential and results in a conduction block (Smith and McDonald, 1999). In addition, demyelinated axons become more vulnerable to inflammatory injury and express altered patterns of sodium channels that can trigger retrograde axonal degeneration (Trapp et al., 1998; Waxman, 2001). Demyelination further deprives the axons of the trophic effects of oligodendrocytes and compromises the structural integrity and functional capacity of the axons (Brady et al., 1999; Edgar and Garbern, 2004). Thus, our findings directly demonstrate that protecting oligodendrocytes and myelin in settings of inflammation can reduce axonal injury and, in essence, can provide neuroprotection.
Protecting oligodendrocytes and myelin against inflammatory injury has emerged as a potentially clinically relevant, disease-modifying strategy in MS. Detailed examinations of MS pathological specimens have demonstrated that oligodendrocyte injury and apoptosis can be accompanied by limited inflammation and may, in fact, represent the initial event of lesions formation (Lucchinetti et al., 2000; Barnett and Prineas, 2004). Therefore, exploring oligodendrocyte-related pathogenic mechanisms, in addition to the conventional immune-based ones, can be of independent therapeutic significance in MS. Perhaps targeting IRF-1 and Caspase 1 signaling by pharmaceutical agents can be of clinical utility in controlling the disease activity in MS (Lin and Hiscott, 1999; Wannamaker et al., 2007). Interferon-β, a MS therapeutic and a strong inducer of IRF-1 expression, has been reported to exert a harmful effect on oligodendrocytes (Taniguchi et al., 2001; Heine et al., 2006; Trebst et al., 2007). Hypothetically, agents that block IRF-1 signaling could suppress this harmful effect of interferon-β and enhance its impact on the disease. Such strategy can also impact cellular processes, such as axonal injury, which have been notoriously difficult to affect therapeutically. Finally, our dominant-negative approach may have implications in pretransplant manipulation of neuronal stem cells for the purpose of increasing their survival and reparative potential in MS lesions (Martino et al., 2010).
In conclusion, we demonstrated that suppression of IRF-1 signaling specifically in oligodendocytes results in significant protection against EAE, reduction of inflammatory demyelination, and oligodendrocyte and axonal preservation. Our results provide a new prospective on mechanisms of inflammatory demyelination and are likely to have important therapeutic implications in MS.
Footnotes
This work was supported by grants from the National Institutes of Health (NIH K08 NS5040901) and the National Multiple Sclerosis Society (NMSS PP 14509 and RG4466-A-3) to R.B., and the Hakwen Family Research Fund and the Rayman Foundation to D.S. We are grateful to Alexandra Balabanov for her editorial help.
References
- Agresti C, Bernardo A, Del Russo N, Marziali G, Battistini A, Aloisi F, Levi G, Coccia EM. Synergistic stimulation of MHC class I and IRF-1 gene expression by IFN-gamma and TNF-alpha in oligodendrocytes. Eur J Neurosci. 1998;10:2975–2983. doi: 10.1111/j.1460-9568.1998.00313.x. [DOI] [PubMed] [Google Scholar]
- Aguirre A, Dupree JL, Mangin JM, Gallo V. A functional role for EGFR signaling in myelination and remyelination. Nat Neurosci. 2007;10:990–1002. doi: 10.1038/nn1938. [DOI] [PubMed] [Google Scholar]
- Balabanov R, Strand K, Kemper A, Lee JY, Popko B. Suppressor of cytokine signaling 1 expression protects oligodendrocytes from the deleterious effects of interferon-gamma. J Neurosci. 2006;26:5143–5152. doi: 10.1523/JNEUROSCI.0737-06.2006. [DOI] [PMC free article] [PubMed] [Google Scholar]
- Balabanov R, Strand K, Goswami R, McMahon E, Begolka W, Miller SD, Popko B. Interferon-gamma-oligodendrocyte interactions in the regulation of experimental autoimmune encephalomyelitis. J Neurosci. 2007;27:2013–2024. doi: 10.1523/JNEUROSCI.4689-06.2007. [DOI] [PMC free article] [PubMed] [Google Scholar]
- Barnett MH, Prineas JW. Relapsing and remitting multiple sclerosis: pathology of the newly forming lesion. Ann Neurol. 2004;55:458–468. doi: 10.1002/ana.20016. [DOI] [PubMed] [Google Scholar]
- Bergsbaken T, Fink SL, Cookson BT. Pyroptosis: host cell death and inflammation. Nat Rev Microbiol. 2009;7:99–109. doi: 10.1038/nrmicro2070. [DOI] [PMC free article] [PubMed] [Google Scholar]
- Bouker K, Skaar TC, Riggins RB, Harburger DS, Fernandez DR, Zwart A, Wang A, Clarke R. Interferon regulatory factor-1 (IRF-1) exhibits tumor suppressor activities in breast cancer associated with caspase activation and induction of apoptosis. Carcinogenesis. 2005;26:1527–1535. doi: 10.1093/carcin/bgi113. [DOI] [PubMed] [Google Scholar]
- Brady ST, Witt AS, Kirkpatrick LL, de Waegh SM, Readhead C, Tu PH, Lee VM. Formation of compact myelin is required for maturation of the axonal cytoskeleton. J Neurosci. 1999;19:7278–7288. doi: 10.1523/JNEUROSCI.19-17-07278.1999. [DOI] [PMC free article] [PubMed] [Google Scholar]
- Buch T, Uthoff-Hachenberg C, Waisman A. Protection from autoimmune brain inflammation in mice lacking IFN-regulatory factor-1 is associated with Th2-type cytokines. Int Immunol. 2003;15:855–859. doi: 10.1093/intimm/dxg086. [DOI] [PubMed] [Google Scholar]
- Butzkueven H, Zhang JG, Soilu-Hanninen M, Hochrein H, Chionh F, Shipham KA, Emery B, Turnley AM, Petratos S, Ernst M, Bartlett PF, Kilpatrick TJ. LIF receptor signaling limits immune mediated demyelination by enhancing oligodendrocyte survival. Nat Med. 2002;8:613–619. doi: 10.1038/nm0602-613. [DOI] [PubMed] [Google Scholar]
- Corbin JG, Kelly D, Rath EM, Baerwald KD, Suzuki K, Popko B. Targeted CNS expression of interferon-gamma in transgenic mice leads to hypomyelination, reactive gliosis, and abnormal cerebellar development. Mol Cell Neurosci. 1996;7:354–370. doi: 10.1006/mcne.1996.0026. [DOI] [PubMed] [Google Scholar]
- Edgar JM, Garbern J. The myelinated axon is dependent on the myelinating cell for support and maintenance: molecules involved. J Neurosci Res. 2004;76:593–598. doi: 10.1002/jnr.20063. [DOI] [PubMed] [Google Scholar]
- Ercolini AM, Miller SD. Mechanisms of immunopathology in murine models of central nervous system demyelinating disease. J Immunol. 2006;176:3293–3298. doi: 10.4049/jimmunol.176.6.3293. [DOI] [PubMed] [Google Scholar]
- Fink SL, Cookson BT. Apoptosis, pyroptosis, and necrosis: mechanistic description of dead and dying eukaryotic cells. Infect Immun. 2005;73:1907–1916. doi: 10.1128/IAI.73.4.1907-1916.2005. [DOI] [PMC free article] [PubMed] [Google Scholar]
- Fortunato G, Calcagno G, Bresciamorra V, Salvatore E, Filla A, Capone S, Liguori R, Borelli S, Gentile I, Borrelli F, Borgia G, Sacchetti L. Multiple sclerosis and hepatitis C virus infection are associated with single nucleotide polymorphisms in interferon pathway genes. J Interferon Cytokine Res. 2008;28:141–152. doi: 10.1089/jir.2007.0049. [DOI] [PubMed] [Google Scholar]
- Furlan R, Martino G, Galbiati F, Poliani PL, Smiroldo S, Bergami A, Desina G, Comi G, Flavell R, Su MS, Adorini L. Caspase-1 regulates the inflammatory process leading to autoimmune demyelination. J Immunol. 1999;163:2403–2409. [PubMed] [Google Scholar]
- Gravel M, Di Polo A, Valera PB, Braun PE. Four-kilobase sequence of the mouse CNP gene directs spatial and temporal expression of lacZ in transgenic mice. J Neurosci Res. 1998;53:393–404. doi: 10.1002/(SICI)1097-4547(19980815)53:4<393::AID-JNR1>3.0.CO;2-1. [DOI] [PubMed] [Google Scholar]
- Heine S, Ebnet J, Maysami S, Stangel M. Effects of interferon-beta on oligodendroglial cells. J Neuroimmunol. 2006;177:173–180. doi: 10.1016/j.jneuroim.2006.04.016. [DOI] [PubMed] [Google Scholar]
- Hisahara S, Araki T, Sugiyama F, Yagami K, Suzuki M, Abe K, Yamamura K, Miyazaki J, Momoi T, Saruta T, Bernard CC, Okano H, Miura M. Targeted expression of baculovirus p35 caspase inhibitor in oligodendrocytes protects mice against autoimmune-mediated demyelination. EMBO J. 2000;19:341–348. doi: 10.1093/emboj/19.3.341. [DOI] [PMC free article] [PubMed] [Google Scholar]
- Hisahara S, Okano H, Miura M. Caspase-mediated oligodendrocyte cell death in the pathogenesis of autoimmune demyelination. Neurosci Res. 2003;46:387–397. doi: 10.1016/s0168-0102(03)00127-5. [DOI] [PubMed] [Google Scholar]
- Höftberger R, Aboul-Enein F, Brueck W, Lucchinetti C, Rodriguez M, Schmidbauer M, Jellinger K, Lassmann H. Expression of major histocompatibility complex class I molecules on the different cell types in multiple sclerosis lesions. Brain Pathol. 2004;14:43–50. doi: 10.1111/j.1750-3639.2004.tb00496.x. [DOI] [PMC free article] [PubMed] [Google Scholar]
- Hövelmeyer N, Hao Z, Kranidioti K, Kassiotis G, Buch T, Frommer F, von Hoch L, Kramer D, Minichiello L, Kollias G, Lassmann H, Waisman A. Apoptosis of oligodendrocytes via Fas and TNF-R1 is a key event in the induction of experimental autoimmune encephalomyelitis. J Immunol. 2005;175:5875–5884. doi: 10.4049/jimmunol.175.9.5875. [DOI] [PubMed] [Google Scholar]
- Huseby ES, Liggitt D, Brabb T, Schnabel B, Ohlén C, Goverman J. A pathogenic role for myelin-specific CD8(+) T cells in a model for multiple sclerosis. J Exp Med. 2001;194:669–676. doi: 10.1084/jem.194.5.669. [DOI] [PMC free article] [PubMed] [Google Scholar]
- Kassmann CM, Lappe-Siefke C, Baes M, Brügger B, Mildner A, Werner HB, Natt O, Michaelis T, Prinz M, Frahm J, Nave KA. Axonal loss and neuroinflammation caused by peroxisome-deficient oligodendrocytes. Nat Genet. 2007;39:969–976. doi: 10.1038/ng2070. [DOI] [PubMed] [Google Scholar]
- Krishnamoorthy G, Saxena A, Mars LT, Domingues HS, Mentele R, Ben-Nun A, Lassmann H, Dornmair K, Kurschus FC, Liblau RS, Wekerle H. Myelin-specific T cells also recognize neuronal autoantigen in a transgenic mouse model of multiple sclerosis. Nat Med. 2009;15:626–632. doi: 10.1038/nm.1975. [DOI] [PubMed] [Google Scholar]
- Lassmann H, Brunner C, Bradl M, Linington C. Experimental allergic encephalomyelitis: the balance between encephalitogenic T lymphocytes and demyelinating antibodies determines size and structure of demyelinated lesions. Acta Neuropathol. 1988;75:566–576. doi: 10.1007/BF00686201. [DOI] [PubMed] [Google Scholar]
- Lin R, Hiscott J. A role for casein kinase II phosphorylation in the regulation of IRF-1 transcriptional activity. Mol Cell Biochem. 1999;191:169–180. [PubMed] [Google Scholar]
- Lin W, Kemper A, Dupree JL, Harding HP, Ron D, Popko B. Interferon-gamma inhibits central nervous system remyelination through a process modulated by endoplasmic reticulum stress. Brain. 2006;129:1306–1318. doi: 10.1093/brain/awl044. [DOI] [PubMed] [Google Scholar]
- Linker RA, Mäuer M, Gaupp S, Martini R, Holtmann B, Giess R, Rieckmann P, Lassmann H, Toyka KV, Sendtner M, Gold R. CNTF is a major protective factor in demyelinating CNS disease: a neuroprotective cytokine as modulator in neuroinflammation. Nat Med. 2002;8:620–624. doi: 10.1038/nm0602-620. [DOI] [PubMed] [Google Scholar]
- Lucchinetti C, Brück W, Parisi J, Scheithauer B, Rodriguez M, Lassmann H. Heterogeneity of multiple sclerosis lesions: implications for the pathogenesis of demyelination. Ann Neurol. 2000;47:707–717. doi: 10.1002/1531-8249(200006)47:6<707::aid-ana3>3.0.co;2-q. [DOI] [PubMed] [Google Scholar]
- Martino G, Franklin RJ, Van Evercooren AB, Kerr DA Stem Cells in Multiple Sclerosis (STEMS) Consensus Group. Stem cell transplantation in multiple sclerosis: current status and future prospects. Nat Rev Neurol. 2010;6:247–255. doi: 10.1038/nrneurol.2010.35. [DOI] [PubMed] [Google Scholar]
- Matsuyama T, Kimura T, Kitagawa M, Pfeffer K, Kawakami T, Watanabe N, Kündig TM, Amakawa R, Kishihara K, Wakeham A. Targeted disruption of IRF-1 or IRF-2 results in abnormal type I IFN gene induction and aberrant lymphocyte development. Cell. 1993;75:83–97. [PubMed] [Google Scholar]
- Mi S, Hu B, Hahm K, Luo Y, Kam Hui ES, Yuan Q, Wong WM, Wang L, Su H, Chu TH, Guo J, Zhang W, So KF, Pepinsky B, Shao Z, Graff C, Garber E, Jung V, Wu EX, Wu W. LINGO-1 antagonist promotes spinal cord remyelination and axonal integrity in MOG-induced experimental autoimmune encephalomyelitis. Nat Med. 2007;13:1228–1233. doi: 10.1038/nm1664. [DOI] [PubMed] [Google Scholar]
- Ming X, Li W, Maeda Y, Blumberg B, Raval S, Cook SD, Dowling PC. Caspase 1 expression in multiple sclerosis plaques and cultured glial cells. J Neurol Sci. 2002;197:9–18. doi: 10.1016/s0022-510x(02)00030-8. [DOI] [PubMed] [Google Scholar]
- Ramana CV, Gil MP, Schreiber RD, Stark GR. (2002) STAT1-dependent and independent pathways in IFN-γ-dependent signaling. Trends Immunol. 2002;23:96–101. doi: 10.1016/s1471-4906(01)02118-4. [DOI] [PubMed] [Google Scholar]
- Ren Z, Wang Y, Tao D, Liebenson D, Liggett T, Goswami R, Stefoski D, Balabanov R. Central nervous system expression of interferon regulatory factor 1 regulates experimental autoimmune encephalomyelitis. J Neuroimmune Pharmacol. 2010;5:260–265. doi: 10.1007/s11481-010-9193-z. [DOI] [PubMed] [Google Scholar]
- Ren Z, Wang Y, Liebenson D, Liggett T, Goswami R, Stefoski D, Balabanov R. IRF-1 signaling in central nervous system glial cells regulates inflammatory demyelination. J Neuroimmunol. 2011;233:147–159. doi: 10.1016/j.jneuroim.2011.01.001. [DOI] [PubMed] [Google Scholar]
- Ruulus SR, Bauer J, Sontrop K, Huitinga K, 't Hart BA, Dijkstra CD. Reactive oxygen species are involved in the pathogenesis of experimental allergic encephalomyelitis in Lewis rats. J Neuroimmunol. 1995;56:207–217. doi: 10.1016/0165-5728(94)00154-g. [DOI] [PubMed] [Google Scholar]
- Smith KJ, McDonald WI. The pathophysiology of multiple sclerosis: the mechanisms underlying the production of symptoms and the natural history of the disease. Philos Trans R Soc Lond B Biol Sci. 1999;354:1649–1673. doi: 10.1098/rstb.1999.0510. [DOI] [PMC free article] [PubMed] [Google Scholar]
- Steinman L, Zamvil SS. How to successfully apply animal studies in experimental allergic encephalomyelitis to research on multiple sclerosis. Ann Neurol. 2006;60:12–21. doi: 10.1002/ana.20913. [DOI] [PubMed] [Google Scholar]
- Swanborg RH. Experimental allergic encephalomyelitis. Methods Enzymol. 1988;162:413–421. doi: 10.1016/0076-6879(88)62095-7. [DOI] [PubMed] [Google Scholar]
- Tada Y, Ho A, Matsuyama T, Mak TW. Reduced incidence and severity of antigen-induced autoimmune diseases in mice lacking interferon regulatory factor-1. J Exp Med. 1997;185:231–238. doi: 10.1084/jem.185.2.231. [DOI] [PMC free article] [PubMed] [Google Scholar]
- Taniguchi T, Ogasawara K, Takaoka A, Tanaka N. Family of transcription factors as regulators of host defense. Annu Rev Immunol. 2001;19:623–655. doi: 10.1146/annurev.immunol.19.1.623. [DOI] [PubMed] [Google Scholar]
- Thakker P, Leach MW, Kuang W, Benoit SE, Leonard JP, Marusic S. IL-23 is critical in the induction but not in the effector phase of experimental autoimmune encephalomyelitis. J Immunol. 2007;178:2589–2598. doi: 10.4049/jimmunol.178.4.2589. [DOI] [PubMed] [Google Scholar]
- Tompkins SM, Padilla J, Dal Canto MC, Ting JP, Van Kaer L, Miller SD. De novo CNS processing of myelin antigen is required for the initiation of EAE. J Immunol. 2002;168:4173–4183. doi: 10.4049/jimmunol.168.8.4173. [DOI] [PubMed] [Google Scholar]
- Trapp BD, Peterson J, Ransohoff RM, Rudick R, Mörk S, Bö L. Axonal transection in the lesions of multiple sclerosis. N Engl J Med. 1998;338:278–285. doi: 10.1056/NEJM199801293380502. [DOI] [PubMed] [Google Scholar]
- Trebst C, Heine S, Lienenklaus S, Lindner M, Baumgärtner W, Weiss S, Stangel M. Lack of interferon-beta leads to accelerated remyelination in a toxic model of central nervous system demyelination. Acta Neuropathol. 2007;114:587–596. doi: 10.1007/s00401-007-0300-z. [DOI] [PubMed] [Google Scholar]
- Wang Y, Ren Z, Tao D, Tilwalli S, Goswami R, Balabanov R. STAT1/IRF-1 signaling pathway mediates the injurious effect of interferon-gamma on oligodendrocyte progenitor cells. Glia. 2010;58:195–208. doi: 10.1002/glia.20912. [DOI] [PubMed] [Google Scholar]
- Wannamaker W, Davies R, Namchuk M, Pollard J, Ford P, Ku G, Decker C, Charifson P, Weber P, Germann UA, Kuida K, Randle JC. (S)-1-((S)-2-{[1-(4-amino-3-chloro-phenyl)-methanoyl]-amino{-3,3-dimethyl-butanoyl)-pyrrolidine-2-carboxylic acid ((2R,3S)-2-ethoxy-5-oxo-tetrahydro-furan-3-yl)-amide (VX-765), an orally available selective interleukin (IL)-converting enzyme/caspase-1 inhibitor, exhibits potent anti-inflammatory activities by inhibiting the release of IL-1beta and IL-18. J Pharmacol Exp Ther. 2007;321:509–516. doi: 10.1124/jpet.106.111344. [DOI] [PubMed] [Google Scholar]
- Waxman SG. Acquired channelopathies in nerve injury and MS. Neurology. 2001;56:1621–1627. doi: 10.1212/wnl.56.12.1621. [DOI] [PubMed] [Google Scholar]