

Abstract
Neutrophil directional migration in response to chemical gradients, also known as chemotaxis, is one of the key phenomena in the immune responses against bacterial infection. To better study neutrophils chemotaxis, several in vitro assays have been developed that replicate chemotactic gradients around neutrophils isolated from whole blood. One drawback for most of these assays is the lengthy processing of blood required for neutrophils isolation, which can alter the responsiveness of neutrophils compared to the in vivo conditions. To address this limitation, we have designed a microfluidic chip for chemotaxis studies which can use neutrophils isolated on the chip, directly from whole blood. We have tested three different cell adhesion molecules as substrates for neutrophil isolation (P-selectin, E-selectin and fibronectin) and found average capture efficiencies of 20–40 neutrophils/mm2 at optimized concentrations. Subsequent analysis of neutrophil migration in chemoattractant gradients of N-formyl-methyl-leucyl-phenylalanine (fMLP) or Interleukin-8 (IL-8) shows higher average velocities over E-selectin as compared to the P-selectin. Our microfluidic assay uses just a drop of whole blood (<10 μL) for neutrophil isolation and provides a robust platform to perform chemotaxis assays in the competing environment of different chemokines.
Introduction
Neutrophil directional migration in response to soluble chemoattractant gradients is a critical process during the response of the innate immune against bacterial infection. Also known as chemotaxis, it plays a significant role in several other physiological processes such as inflammation,1 wound healing,2 metastasis,3 atherosclerosis,4 arthritis5 etc. With recent developments in microfluidic technologies, cell migration research has gained significant attention in recent years and a variety of in vitro migration assays have been developed.6–9 One major challenge for these assays is the isolation of neutrophils from whole blood without activating them or altering their phenotype. The most commonly used isolation procedures involve Ficoll–Hypaque centrifugation, erythrocyte lysis or the combination of these two techniques.10 Alternatively, neutrophils can be separated from whole blood by negative immunomagnetic separation techniques which deplete all unwanted cells by selective capture on functionalized magnetic beads.11 These techniques require large volumes of whole blood (of the order of milliliters) and are prone to mechanical, osmotic or thermal shocks to which neutrophils are highly sensitive.12,13 While recent studies involving high speed microfluidic lysis process can yield 98–100% leukocytes with minimal activation,14 the method still requires a centrifugation step for debris removal, which is difficult to implement on the chip. The effects of cell lysate contaminat on neutrophils’ responsiveness to subsequent chemotactic gradients are also unknown.
A second critical challenge in studying neutrophil chemotaxis is establishing more complex gradient generation schemes to study sequential effects of different chemokines15 or activity of anti-inflammatory agents.16 Since the development of the Boyden chamber in 1962, several other techniques including micropipette generated gradients,18 hydrogel based assay,19,20 Zigmond chamber21 and Dunn chamber22 have been proposed for studying chemotactic responsiveness of many cells, including neutrophils, to artificial chemical gradients.17 However, many of these assays pose limitations of gradient nonlinearity and spatial/temporal instability making repeatability of the experimental conditions difficult to control. While some of these methods are unsuitable for observing single cell responses (e.g. Boyden chamber), others lack the capability to support multifactor combinatorial gradients or only offer short lived gradients (e.g. Dunn chamber). More recently, microfluidic gradient generators have greatly evolved and a number of models categorized as parallel-flow or flow-resistive gradient generators have been proposed to perform in vitro chemotaxis.7–9,23,24 Although many of the microfluidic techniques succeed in eliminating the issues related to quantification as well as spatial and temporal stability of gradients, they fail either to provide dynamic control over the established gradients or to independently generate combinatorial gradients of multiple chemokines.6 Moreover, none of these techniques were able to provide a complete assay for combined capture and migration analysis without undergoing additional isolation steps.
To closely mimic the in vivo scenarios existing around cells, a simple and efficient in vitro chemotaxis study demands two essential steps: (1) the isolation and immobilization of neutrophils on the device for subsequent microscopy and monitoring cellular responses and (2) the ability to create a dynamic yet controlled and complex environment of multiple chemokines around the cells. Here, we present a technique integrating the two major steps of isolating neutrophils from whole blood samples and probing their migration, on a single microfluidic platform which is also capable of performing fast switches between multiple chemokines gradients. This device requires just a drop of whole blood easily obtained from a finger prick (5–10 μL) and directly isolates primary neutrophils into the cell capture and migration chamber coated with cell adhesion molecules (CAM). We have optimized the surface modification protocol for efficient neutrophil isolation and studied neutrophil migration under gradients of different chemoattractants. Our procedure provides a quick and integrated platform to perform the entire migration study in vitro within a single microfluidic device in a bio-mimetic scenario.
Materials and methods
Device fabrication
Designs of the devices were prepared using AutoCAD software (AutoCAD 2000, Autodesk Inc.) after which they were printed on a transparency at resolution of 50 000 dpi (Fineline Imaging, Colorado Springs, CO). Two designs were used, one for optimizing the efficiency of neutrophil capture from whole blood and the other for integrated capture and chemotaxis assays, as shown in Fig. 1. The first design is for a capture device consisting of simple channels with markings on the side for positional information, and fabricated using standard microfluidic technologies (Fig. 1B). The second design is for a chemotaxis device that incorporates microstructured valves and was fabricated using multilayer procedures. For this, two silicon masters were prepared using SU8 soft photolithography techniques. Poly-dimethylsiloxane (PDMS) was patterned on the two wafers to replicate the microfluidic network in a 150 μm thin layer and the control network in a 4 mm thick layer. Devices were fabricated by the bonding of the control PDMS layer on top of the microfluidic network layer and the two layers on a glass slide as previously described.7 During bonding, vacuum was applied to the valves using syringe and tubing connections to maintain them in open position, and prevent them from irreversibly bonding to the glass substrate. Appropriate inlet and outlet ports were punched using sharpened needles (Part # NE-201PL-C, Small Parts Inc., Miramar, FL) before bonding the devices to glass slides. The channel dimensions of the neutrophil capture chambers were 450 μm wide and 80 μm tall.
Fig. 1.

Overall design of the microfluidic devices for neutrophils separation from whole blood and chemotaxis assay. (A) Microfluidic device with six parallel channels for neutrophil capture characterization. (B) Magnified image of the cell capture chamber with ruler markers on the top and bottom. Dimensions for each section between the two marks are 750 × 450 μm. (C) Microfluidic device for combined cell capture and chemotaxis assay. Two gradient generators are connected to the cell capture and migration chamber through microfluidic valves. Inset figures present details of the microstructured membrane valves employed in the device. (D) Close-up picture of the gradient flow chamber. The valve connecting the top gradient network is open allowing fluids to flow through the cell capture and migration chamber while the bottom valve is closed diverting fluids from the second gradient network to the waste reservoir. Dimensions of the separation and chemotaxis chamber are 450 μm wide × 80 μm tall.
Cell adhesion molecules and surface treatment
Three different adhesion molecules (P-selectin, E-selectin and fibronectin) were used to capture primary neutrophils from whole blood in the microfluidic channels. These substrates were chosen because of their significant role in neutrophil trafficking in vivo. To characterize the neutrophil capture efficiency, the cell capture chambers were coated with the adhesion molecules by flowing through solutions of six different concentrations of each adhesion molecule (concentrations shown in Table 1). Solutions were prepared by diluting the stock solution in sterile water or phosphate buffered saline (PBS) as advised by the vendors. These dilutions were loaded in the six cell capture chambers of the device and incubated for 1 h at room temperature. After one hour, P-selectin was aspirated and the flow chambers perfused with 2% HSA (Human Serum Albumin, Sigma-Aldrich Catalog # A5843) in Hank’s buffer saline solution (HBSS, Sigma-Aldrich Catalog # H9269) to block non-specific binding sites and incubated for at least 15 minutes.
Table 1.
Concentration of the solutions used for surface treatment and neutrophil isolation in microfluidic channels
| Substrate | Concentrations (μg/mL) | Vendor | Catalog # |
|---|---|---|---|
| Human recombinant P-selectin | 0.1, 10, 25, 50, 75 and 100 | R&D Systems Inc. | ADP3-050 |
| Human recombinant E-selectin | 0.1, 1, 10, 25, 50 and 100 | R&D Systems Inc. | ADP1-050 |
| Fibronectin | 1, 10, 50, 100, 300 and 500 | R&D Systems Inc. | F0895 |
Experimental setup
The microfluidic flow channels require subtle connections with the macroscopic components such as tubing, needles, syringes etc. Therefore, to ensure sealed connections, tubing and needle specifications are chosen such that the inside diameter (ID) of the tubing is slightly smaller than the outside diameter (OD) of the connecting needle, while the OD of the tubing is slightly larger than the ID of the punching needle used previously to make inlet/outlet ports in the PDMS device. This setup has been well standardized and is consistently employed for all the experiments performed in this study.
Characterization of neutrophil capture
The PDMS device used to characterize cell capture consists of six distinct parallel channels each having an inlet and an outlet port (Fig. 1A). The channel dimensions of each segment of the capture device are 750 × 450 × 80 μm (L × W × H). The length of each segment was chosen such that it will conveniently fit in the field of view at 10× ocular and 10× objective magnification. 10 μL whole blood is mixed with 70 μL heparinised HBSS solution and loaded in the cell chamber. Six 1 mL syringes (Part # 309602, Becton, Dickinson and Company, Franklin Lakes, NJ) are filled with HBSS containing 0.2% HSA. Most of the air trapped in the dead volume of the syringe is eliminated by tapping the inverted syringes. Syringes are then connected to tygon tubing approximately 10 to 12 inches long (Part # TGY-010-C, Small parts Inc.) through the needles (Part # NE-301PL-C, Small parts Inc.). The syringes are placed on the syringe pump rack (PHD 2000, Harvard Apparatus, Holliston, MA) and the loose ends of the tubing are connected to the inlets of the device properly secured on the microscope stage. Smaller fragments of tubing are connected to the outlet ports. The pump is turned on at the rate of 4–5 μL/min and the outlet tubings are clamped once the channels are filled with fluid, while leaving the pump running. This priming step is necessary to eliminate any trapped air pockets by continuing the inflow that pressurizes the air bubbles to diffuse through the porous PDMS matrix. Blood sample can be loaded as soon as all the air pockets are eliminated.
Neutrophil migration setup
The gradient generating device used to study cell migration consists of two inlets, one outlet and a cell loading port. In a similar manner as explained above, the device is primed after functionalizing the channel surface with adhesion molecules. Two syringes are prepared, one with only buffer containing 0.2% HSA while the other also containing the appropriate concentration of chemokine. Two chemoattractants, either recombinant human Interleukin-8 (IL8, Catalog # 208-IL, R&D Systems inc.) or N-formyl-methyl-leucyl-phenylalanine (fMLP, Part # F3506, Sigma-Aldrich) were employed at 10 nM and 20 nM concentrations, respectively. For consistency, the two syringes are connected to the device such that chemokine gradient in the cell capture and migration chambers is always in the same orientation, from top (100%) to bottom (0%). After the device is primed, inlet ports are clamped and the blood sample is loaded through the cell loading port as described in the following section.
Sample loading and neutrophil capture
A 1.25 mm lancet (Part # 366579, Becton Dickinson) is used to prick the finger and 10 μL whole blood is drawn with a pipette. Before withdrawing the blood, 70 μL of HBSS mixed with sodium heparin (Part # 367871, Becton Dickinson) is injected into the open end of a loading needle using a pipette. The blood in the pipette is then directly mixed with the heparin solution inside the needle. A slight pressure is gradually applied to the open end of the needle using an index finger to push the blood sample through the tubing until a small drop of fluid appeared on the other end of the tubing. To avoid entrapment of air bubbles while connecting the tubing to the PDMS device, a drop of HBSS should always be present in excess at the connecting ports of the device. The loose end of the sample tubing is held with forceps and carefully inserted in the PDMS port. Once a sealed connection is established, pressure is again applied to the loading needle to push samples through the cell capture and migration chamber. The inlet and outlet tubings are then clamped using binder clips for 5–10 minutes allowing cells to interact and bind with the glycoprotein molecules.
Microscopy
For the neutrophil capture characterization experiments, images for 7–10 sections (each 750 μm long, Fig. 1B) were acquired at 2 s interval using time lapse microscopy and at least 10 frames were captured. This was done to make sure that only adherent neutrophils were counted. An inverted Olympus microscope (Model # CKX41) and a CMOS color camera (Pixelink PL-A742) were used to capture time lapse images in phase contrast mode. A 10× ocular and 10× objective magnification were used. The neutrophils captured in the chambers were counted manually in 7–10 distinct areas for each concentration. The average number of captured cells was calculated from three repeated experiments for each concentration and CAM. For migration experiments, images were captured at a rate of 10 frames/minute (6 second interval) for 30 minutes. Migration patterns were tracked using the Metamorph imaging software (Version 4.1, Universal Imaging, etc.) and the average distance traveled in the direction of the gradient was plotted against time. Migration analysis was performed at 25, 50 and 200 μg/mL concentrations for P-selectin, E-selectin and fibronectin, respectively. These concentration values were obtained from the neutrophil capture data at which maximum capture was observed for the three substrates.
Captured time lapse images were converted to 8 bit and individual cells were tracked using Metamorph imaging software (Ver 4.1, Universal Imaging Corporation). Elapsed time and migration distance from the origin in the Y direction were derived for each cell and average displacements were calculated for the entire cell population in consideration. Migration curves representing the average distance traveled in the direction of increasing chemokine concentration against time were plotted and compared. It is notable that the slope of gradient along the flow path in the cell chamber gradually changes depending on the flow rates and the diffusivities of chemoattractants. Therefore, to maintain consistency, only the first upstream quarter of the cell chamber was considered for microscopic observation where the variations in gradient profile are minimal.
Data analysis
To analyze neutrophil migration, we calculated mean-squared displacements of individual neutrophils
from the displacement of the cell during a time interval τ at different time instances t,
We used SigmaPlot software (Systat software, Inc) to calculate μ, the random motility coefficient, and P, the directional persistence time. Considering the two-dimensional migration of neutrophils on a flat surface, we used the following equation to fit a persistent random walk model for cell migration to the recorded displacement data:25–27
Average random motility coefficient and average directional persistence time were calculated for at least 15 neutrophils moving on each of the surfaces coated with different substrates at optimal concentration.
Statistical analysis
All values were expressed as average number of cells captured per square millimeter of the cell capture chamber surface area. A two-way ANOVA test was used for statistical comparisons of capture efficiencies for different substrates. Statistical significance was assigned where P < 0.05.
Results
We designed and tested a microfluidic device capable of isolating neutrophils from a droplet of whole blood and performing complex in vitro chemotaxis assays. We compared the effect on neutrophil capture and neutrophil chemotaxis of three different cell adhesion molecules (CAM) surface coatings and two chemoattractant gradients.
Effect of surface treatment on neutrophil capture
We characterized the neutrophil isolation on substrates coated with three different CAM using blood samples obtained from three different individuals. The average number of cells captured per square millimeter was plotted against the concentration of CAM solution used to prepare the capture surface. The experimental data suggests that the capture efficiency for all three CAM initially increases with concentration, and then plateaus or starts descending at higher concentration value (Fig. 2). The maximum capture efficiency for P- and E-selectins was approximately 35 and 15 cells/mm2 for concentrations of 25 and 50 μg/mL, respectively. At the same time only ~3–4 cells/mm2 were captured on fibronectin coated surfaces at 200 μg/mL concentration of priming solution. The statistical analysis showed that substrate concentration has significant effect (P ≪ 0.05) on cell capture.
Fig. 2.

Efficiency of neutrophils capture from whole blood in microfluidic channels coated with different cell adhesion molecules, at different concentrations. (A) Average number of neutrophils captured on P-selectin coated channels. (B) Average number of neutrophils captured on E-selectin coated channels. (C) Average number of neutrophils captured on fibronectin coated channels.
Considering an average of 5000 neutrophils/μL of blood, calculation suggests that a maximum average number of 135 neutrophils could be present in each field of view at any given time. However, we were able to capture an average of 20–40 cells in the field of view for each experiment, and the differences may be explained by the fact that not all cells have equal chances to interact with the surface in the 5 minutes time for capture. Additionally, the interposition of red blood cells between neutrophils and the substrate could further reduce the number of neutrophils that can be captured in the microfluidic device.
The morphology of the captured cells was initially spherical. As shown in Fig. 3, cells spread on the surface only after the chemokine was introduced in the channel, suggesting that the selectin binding did not induce neutrophil activation and the cells were captured in their quiescent state. A number of red blood cells could also be observed in the channel, and which are progressively removed from the device with the fluid flow.
Fig. 3.
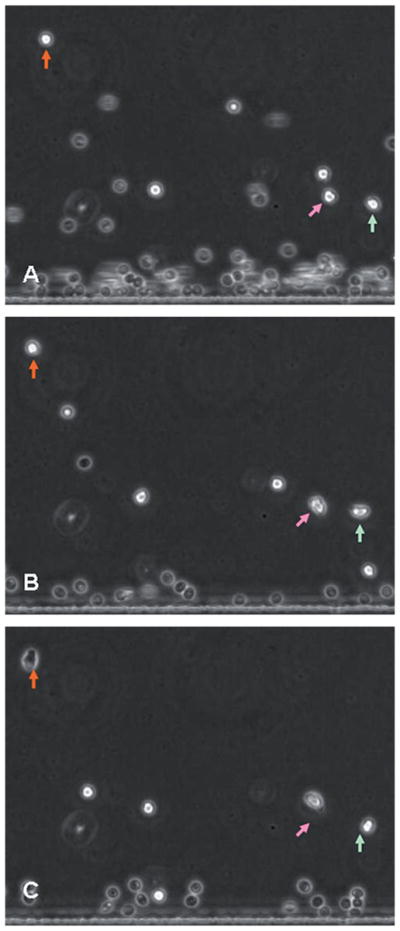
Morphology of neutrophils over P-selectin. The three figures (A), (B) and (C) were taken at 0, 1 and 5 minutes after the introduction of chemoattractant into the device. Arrows indicate neutrophils. The position of the arrows is fixed in order to outline the migration of neutrophils. Neutrophils are initially round (A), after one minute they are changing their morphology (B), and after 5 minutes the cells are fully polarized with a leading edge in the direction of migration (C).
Effect of chemokine exposure on neutrophil capture
To identify whether the chemoattractant exposure has any significant effect on neutrophil capture from whole blood, we primed the CAM coated channel with 20 nM fMLP and the cells were captured in a similar manner as described above. The effects of chemotactic priming of channels appeared significant from the statistical analysis (P ≪ 0.05). However, the comparison of capture data in primed vs. unprimed conditions, shows that approximately twice as many cells were captured over the primed E-selectin, and five times more cells on the primed fibronectin surfaces were compared to the unexposed surface. The difference was not significant in the case of P-selectin coated surfaces. Moreover, most cells were firmly adhered to the surface and no rolling was observed for the treated channels. The statistical analysis suggests that there is no interaction between substrates, concentration and priming conditions.
Neutrophil migration assay
After determining the optimized conditions for maximum cell capture efficiency, we performed the migration experiment using the switching gradient device (Figs. 1C and D). Two different chemoattractants were individually used to create a gradient over each binding substrate. Each experiment was repeated 2–3 times with fresh blood samples from different donors and migration data for at least 10 and up to 40 cells were averaged for each case. Average distance traveled in the direction of the gradient is plotted against time. Both IL8 and fMLP gradients yield similar velocity curves over P-selectin and average displacements of around 30–40 μm were observed in 30 minutes, as presented in Fig. 4A and B. In the presence of E-selectin and gradients of fMLP and IL8, we observed average displacements of 50 μm and 70 μm respectively, within the first 30 minutes, (Fig. 4C and D). In the presence of fibronectin, the cells migrated about 65 μm in fMLP and only 35 μm in IL8 gradients in 30 minutes, as shown in Fig. 4E and F.
Fig. 4.

Average neutrophil migration on P-selectin, E-selectin, and fibronectin coated substrates. (A) Neutrophil migration on 25 μg/mL P-selectin surface in the presence of 20 nM/450 μm fMLP gradient. (B) Neutrophil migration over P-selectin surface in the presence of 10 nM/450 μm IL-8 gradient. (C) Neutrophil migration over 50 μg/mL E-selectin in the presence of 20 nM/450 μm fMLP gradient. (D) Neutrophil migration over E-selectin in the presence of 10 nM/450 μm IL-8 gradient. (E) Neutrophil migration over 200 μg/mL fibronectin in the presence of 20 nM/450 μm fMLP gradient. (F) Neutrophil migration over fibronectin in the presence of 10 nM/450 μm IL-8 gradient. Error bars in all figures represent standard error of the mean.
From the directional analysis, the random motility coefficient (μ) and the directional persistence time (P) were calculated for the initial 10 minutes of migration and the mean values for about 15 cells for each condition (except fibronectin where capture efficiency was low and less than 10 cells were observed) are given in Table 2. Migration analysis suggests that the migration profile was more directionally biased and persistent for P-selectin, compared to the other two substrates. Also when the effects of the two chemoattractants are compared, fMLP demonstrated greater directional bias than IL8 for the all three substrates.
Table 2.
Migration analysis and motility parameters at various conditions
| Substrate CAM | Chemokine | Persistence time (P) (minutes) | Random motility coefficient (μ) (μm2/minute) |
|---|---|---|---|
| P-selectin | fMLP | 4.09 | 8.07 |
| P-selectin | IL-8 | 3.77 | 14.89 |
| E-selectin | fMLP | 2.64 | 23.64 |
| E-selectin | IL-8 | 3.79 | 33.92 |
| Fibronectin | fMLP | 3.22 | 17.7 |
| Fibronectin | IL-8 | 3.83 | 27.01 |
Discussion
The directed migration of neutrophils in vivo involves sequential signaling events to guide them from blood stream into the tissue near the site of injury. The endothelium, when exposed to inflammation signals, starts expressing cell adhesion molecules such as P-selectin and E-selectin and can present chemoattractants like IL8, for which complementary receptors exist on leukocyte surface. This mechanism allows localization of circulating neutrophils towards the inner wall of blood vessels where the haemodynamic shear stress gets minimized and the cells begin to roll as a result of weak transient binding of CAMs with cell receptors. The presence of inflammation signals on the endothelial cells eventually induces the expression of integrin receptors, causing cellular arrest followed by transmigration of neutrophils into the tissue.
Neutrophil rolling and adhesion mechanisms under varying shear stresses have been rigorously studied and well characterized.24,28–30 While it is widely accepted that different selectins play unique roles in neutrophil trafficking, here we have taken a step closer to the in vivo conditions to observe binding and migration patterns of freshly isolated primary neutrophils on selectin substrates. We show that in vitro, the selectins not only facilitate neutrophil isolation from peripheral blood but can also allow migration on a surface in the presence of a chemotactic gradient. By comparing capturing efficiencies of substrates coated with P-selectin, E-selectin and fibronectin at various concentrations, we found that each substrate has a threshold concentration value for which a maximum number of cells are captured. If the priming solutions contain chemoattractants, more neutrophils can be isolated on the same CAM coated surface, however, subsequent motility may be affected. It is also worth noting that some previous studies have shown that heparin binds to P-selectin, competing with neutrophil rolling and adherence on the coated glass surface in the microfluidic device. At concentrations required for anticoagulant effect (20 units/mL) heparin can reduce the adhesion of promyeloid HL-60 cells to P-selectin coated surfaces by as much as 50%.31 One practical implication of this observation is that when one uses another anticoagulant than heparin, the concentration of P-selectin for neutrophil capture and chemotaxis could be reduced less than half compared to the optimal concentration we have determined.
The selective capture of leukocyte subpopulation (neutrophils) is important and it has been previously shown that neutrophils can be preferentially captured using P- and E-selectin substrates with 90–98% purity.28 Among the contaminant cells are monocytes and lymphocytes. While some monocytes could to respond to the same chemotactic stimuli as neutrophils, they can be easily differentiated from neutrophils in our assay based on their larger size. In our experiments, we observed an overall uniform size distribution of the captured cells suggesting that most of the captured leukocytes were neutrophils. The observed average migration velocities in the direction transversal to the channel were comparable with previous findings where migration of HL60 cells over fibronectin was investigated under similar flow conditions.32
The commonly used neutrophils isolation methods such as Ficoll–Hypaque isolation10 and immunomagnetic separation11 work reliably, however, they require over an hour to isolate neutrophils and demand several milliliters of whole blood. These methods are not suited for studies where rat or mice models are used due to the lower volumes of blood samples available in these smaller animals (only a few milliliters). Such experiments often mandate sacrificing the animal in order to extract enough blood, and make prolonged monitoring of the animals very difficult to accomplish. Recently, microfluidic devices coated with antibodies have been demonstrated for the isolation of leukocytes from whole blood.33 These devices require only small volumes of blood and accomplish the isolation of targeted leuckocyte subpopulation in less than 10 minutes. One limitation of these devices, in the context of the chemotaxis assays, is that the binding of the cells to the antibody coated surface is strong and practically irreversible, prohibiting their use for chemotaxis assays. In this context, P and E selectins although incomparably less selective for cell capture, contribute to weaker bonds between cells and substrate, and allow cell motility. The multipurpose device presented here requires only 5–10 μL blood that can be easily obtained from a finger prick or a small incision in the tail vein of a rat. Moreover, the complete procedure from blood drawing to capturing takes about 5–10 minutes for getting the device ready to perform migration experiments. This could represent the basis for novel assays to perform chemotaxis studies in simplified and rapid formats. This is a significant advantage in chemotaxis studies where fast isolation and loading of primary neutrophils can be performed in a single step prior to the migration analysis. For further complex situations involving more than two chemokines, the design of the device can be easily modified to incorporate multiple gradient networks to suit the requirements for combinatorial chemotaxis.
Conclusions
We were able to separate neutrophils from a drop of whole blood in less than 10 minutes in a microfluidic device. We monitored neutrophil chemotaxis at individual cell level in the same microfluidic chamber and observed the early cell migration events following exposure to different chemoattractant gradients.
Acknowledgments
Funding from Shriners Hospitals for Children and National Institute of Biomedical Imaging and Bioengineering BioMEMS Resource Center Grant (P41 EB002503).
Footnotes
Part of a special issue on Point-of-care Microfluidic Diagnostics; Guest Editors—Professor Kricka and Professor Sia.
References
- 1.Woolhouse IS, Bayley DL, Stockley RA. Thorax. 2002;57:709–714. doi: 10.1136/thorax.57.8.709. [DOI] [PMC free article] [PubMed] [Google Scholar]
- 2.Knapp DM, Helou EF, Tranquillo RT. Experimental Cell Research. 1999;247:543–553. doi: 10.1006/excr.1998.4364. [DOI] [PubMed] [Google Scholar]
- 3.Dekker LV, Segal AW. Science. 2000;287:982–985. doi: 10.1126/science.287.5455.982. [DOI] [PubMed] [Google Scholar]
- 4.Ross R, Glomset JA. New England Journal of Medicine. 1976;295:420–425. doi: 10.1056/NEJM197608192950805. [DOI] [PubMed] [Google Scholar]
- 5.Trung PH, Prieur AM, Griscelli C. Annals of the Rheumatic Diseases. 1980;39:481–484. doi: 10.1136/ard.39.5.481. [DOI] [PMC free article] [PubMed] [Google Scholar]
- 6.Keenan TM, Folch A. Lab Chip. 2008;8:34–57. doi: 10.1039/b711887b. [DOI] [PMC free article] [PubMed] [Google Scholar]
- 7.Irimia D, Liu SY, Tharp WG, Samadani A, Toner M, Poznansky MC. Lab Chip. 2006;6:191–198. doi: 10.1039/b511877h. [DOI] [PMC free article] [PubMed] [Google Scholar]
- 8.Lin F, Nguyen CMC, Wang SJ, Saadi W, Gross SP, Jeon NL. Annals of Biomedical Engineering. 2005;33:475–482. doi: 10.1007/s10439-005-2503-6. [DOI] [PubMed] [Google Scholar]
- 9.Jeon NL, Baskaran H, Dertinger SKW, Whitesides GM, Van de Water L, Toner M. Nature Biotechnology. 2002;20:826–830. doi: 10.1038/nbt712. [DOI] [PubMed] [Google Scholar]
- 10.Quinn MT, DeLeo FR, Bokoch GM. Neutrophil Methods and Protocols. 2007 doi: 10.1007/978-1-59745-467-4. [DOI] [PubMed] [Google Scholar]
- 11.Cotter MJ, Norman KE, Hellewell PG, Ridger VC. American Journal of Pathology. 2001;159:473–481. doi: 10.1016/S0002-9440(10)61719-1. [DOI] [PMC free article] [PubMed] [Google Scholar]
- 12.Kouoh F, Levert H, Gressier B, Luyckx M, Brunet C, Dine T, Ballester L, Cazin M, Cazin JC. Apmis. 2000;108:417–421. doi: 10.1034/j.1600-0463.2000.d01-77.x. [DOI] [PubMed] [Google Scholar]
- 13.Pelegri C, Rodriguezpalmero M, Morante MP, Comas J, Castell M, Franch A. Journal of Immunological Methods. 1995;187:265–271. doi: 10.1016/0022-1759(95)00193-1. [DOI] [PubMed] [Google Scholar]
- 14.Sethu P, Anahtar M, Moldawer LL, Tompkins RG, Toner M. Analytical Chemistry. 2004;76:6247–6253. doi: 10.1021/ac049429p. [DOI] [PubMed] [Google Scholar]
- 15.Kobayashi Y. Front Biosci. 2008;13:2400–2407. doi: 10.2741/2853. [DOI] [PubMed] [Google Scholar]
- 16.Serhan CN, Chiang N, Van Dyke TE. Nat Rev Immunol. 2008;8:349–361. doi: 10.1038/nri2294. [DOI] [PMC free article] [PubMed] [Google Scholar]
- 17.Boyden S. Journal of Experimental Medicine. 1962;115:453–466. doi: 10.1084/jem.115.3.453. [DOI] [PMC free article] [PubMed] [Google Scholar]
- 18.Gundersen RW, Barrett JN. Science. 1979;206:1079–1080. doi: 10.1126/science.493992. [DOI] [PubMed] [Google Scholar]
- 19.Brown AF. Journal of Cell Science. 1982;58:455–467. doi: 10.1242/jcs.58.1.455. [DOI] [PubMed] [Google Scholar]
- 20.Nelson RD, Quie PG, Simmons RL. Journal of Immunology. 1975;115:1650–1656. [PubMed] [Google Scholar]
- 21.Zigmond SH. Journal of Cell Biology. 1977;75:606–616. doi: 10.1083/jcb.75.2.606. [DOI] [PMC free article] [PubMed] [Google Scholar]
- 22.Zicha D, Dunn GA, Brown AF. Journal of Cell Science. 1991;99:769–775. doi: 10.1242/jcs.99.4.769. [DOI] [PubMed] [Google Scholar]
- 23.Keenan TM, Hsu CH, Folch A. Applied Physics Letters. 2006:89. [Google Scholar]
- 24.Kuntz RM, Saltzman WM. Biophysical Journal. 1997;72:1472–1480. doi: 10.1016/S0006-3495(97)78793-9. [DOI] [PMC free article] [PubMed] [Google Scholar]
- 25.Dickinson RB, Tranquillo RT. Aiche J. 1993;39:1995–2010. [Google Scholar]
- 26.Othmer HG, Dunbar SR, Alt W. J Math Biol. 1988;26:263–298. doi: 10.1007/BF00277392. [DOI] [PubMed] [Google Scholar]
- 27.Dunn GA. Agents Actions. 1983;12:14–33. doi: 10.1007/978-3-0348-9352-7_1. [DOI] [PubMed] [Google Scholar]
- 28.Reinhardt PH, Kubes P. Blood. 1998;92:4691–4699. [PubMed] [Google Scholar]
- 29.Greenberg AW, Hammer DA. Biotechnology and Bioengineering. 2001;73:111–124. doi: 10.1002/bit.1043. [DOI] [PubMed] [Google Scholar]
- 30.Ohnishi M, Imanishi N. Inflammation. 2000;24:583–593. doi: 10.1023/a:1007033625049. [DOI] [PubMed] [Google Scholar]
- 31.Wang JG, Geng JG. Thromb Haemost. 2003;90:309–316. doi: 10.1160/TH03-01-0045. [DOI] [PubMed] [Google Scholar]
- 32.Walker GM, Sai JQ, Richmond A, Stremler M, Chung CY, Wikswo JP. Lab Chip. 2005;5:611–618. doi: 10.1039/b417245k. [DOI] [PMC free article] [PubMed] [Google Scholar]
- 33.Cheng X, Irimia D, Dixon M, Sekine K, Demirci U, Zamir L, Tompkins RG, Rodriguez W, Mehmet T. Lab Chip. 2007;7:170–178. doi: 10.1039/b612966h. [DOI] [PMC free article] [PubMed] [Google Scholar]