Abstract
Fluorescence recovery after photobleaching (FRAP) and fluorescence correlation spectroscopy (FCS) are the two most direct methods to measure the diffusion of molecules in intact living cells. Ideally, these methods should produce similar results for an identical system. We have used these methods to monitor the diffusion of two G-protein-coupled receptors and their associated proteins in the plasma membranes of cells that do not or do contain invaginated protein domains called caveolae. FRAP studies show that caveolae domains increase the immobile fraction of receptors without significantly changing their mobility. On the other hand, FCS studies show an unexpected increase the mobility of caveolae-associated proteins. Our data suggest that the geometry of caveolae domains gives rise to a confined diffusion of its attached proteins, resulting in an apparent increase in mobility.
Keywords: Fluorescence correlation spectroscopy, Fluorescence recovery after photobleaching, Protein diffusion, Caveolae, G-protein-coupled receptors
Fluorescence correlation spectroscopy (FCS)1 and fluorescence recovery after photobleaching (FRAP) are routinely used to measure the diffusion of fluorescent proteins in cells. FRAP monitors the recovery of fluorescence by the diffusion of fluorophores into a region that has been bleached by a high-intensity laser. Usually, the bleach spot is on the micron scale and the recovery is more than 1 min, depending on the mobility of the fluorophore [1]. FCS, on the other hand, monitors the fluctuations of fluorescence intensity as molecules diffuse in and out of a small (~1 fl) confocal volume [2]. The most common type of FCS measurement is single-point FCS, which has the drawback of being sensitive only to diffusing fluorophores while immobile ones are not detected. Alternately, FRAP measurements give a good indication of the population of species that are immobile during the sampling period. In principle, FCS and FRAP should offer similar and complementary information. However, because the size of the sampling areas differs greatly in the two methods, discrepancies may arise due to local structural barriers that impede or corral the movement of probes. This is particularly true on the plasma membranes of living cells where diffusion barriers exist (see, e.g., Ref. [3]).
Here, we have used FCS and FRAP to determine the effect of membrane domains called caveolae on the diffusion of two related integral membrane proteins. Caveolae are flask-shaped membrane invaginations (see Fig. 1 and Refs. [4–6]) formed from the caveolin family of proteins (see Refs. [6–11]). Caveolae are found on the plasma membrane of many mammalian cells. These domains appear to participate in vesicle trafficking and endocytosis. In addition, caveolin proteins (i.e., Cav1 and Cav3) may specifically bind to other cellular proteins involved in transmission of extracellular signals (see, e.g., Refs. [12,13]).
Fig. 1.
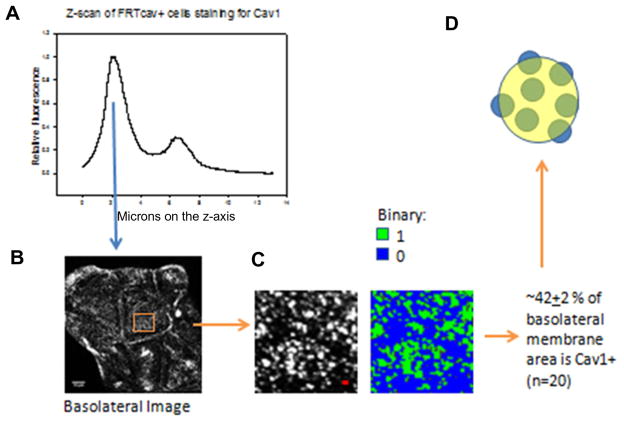
(A) Example of the distribution of Cav1–eGFP in the Z direction expressed in an FRTwt cell. (B) Corresponding image of the cell. (C) Expanded view of a region of the image in black and white and binary depiction. (D) Cartoon depicting caveolae in an FCS-based illuminated measurement.
An important class of signaling proteins that may target caveolae are G-protein-coupled receptors (GPCRs) [14]. GPCRs are the largest family of mammalian receptors that structurally consist of seven transmembrane helices. When an extracellular agent interacts with its specific GPCR, it initiates a series of sequential molecular interactions that involve activation of surface-associated heterotrimeric G proteins and subsequent activation or inhibition of cytosolic enzymes that result in various cellular responses [15]. Many GPCRs and G-protein subunits have been reported to localize in lipid rafts and caveolae domains (see Refs. [14,16]). By corralling GPCRs and G proteins, caveolae may affect signaling by promoting their oligomerization, their association with agonists, and their interaction with intracellular G proteins.
Heterotrimeric G proteins are activated by GPCRs and consist of a Gα and a Gβγ subunit. There are four families of Gα subunits, and only the Gαq subtype has been reported to reside in caveolae domains [16]. Our laboratory used live cell fluorescence imaging to show that in the basal state, GαqGβγ localizes to caveolae domains [17] due to strong interactions between Gαq and Cav1 [17,18]. For those studies, we used Fisher rat thyroid (FRTwt) cells with corroborating experiments in other cell lines. FRTwt cells do not express detectable levels of Cav1, but a sister line that is stably transfected with canine Cav1 (FRTcav+) displays caveolae domains as visualized by electron microscopy [7,19]. In this cell line, caveolae appear at high density on the basolateral membrane and very little on the apical membrane. Furthermore, caveolae are enriched in regions of cell-to-cell contact in accord with the observations that they may organize proteins involved in intercellular signaling such as connexins [20].
Gαq is coupled to many GPCRs, and its activation results in an increase in intracellular calcium, resulting in mitogenic and proliferative changes in the cell (see Ref. [15]). One of the more notable GPCRs that is coupled to Gαq is the bradykinin type 2 receptor (B2R). B2R binds the extracellular agonist bradykinin, which is a key mediator of the inflammation response [21]. The binding of bradykinin to B2R activates Gαq, resulting in activation of phospholipase Cβ (PLCβ) enzymes that ultimately results in an increase in intracellular calcium and activation of many calcium-sensitive proteins. FRT cells do not express B2R receptors, allowing us to monitor the effect of caveolae domains on the homo-oligomerization of these receptors.
We have found that the presence of caveolae greatly affects B2R/Gαq signaling, correlating with a significant increase in calcium release in FRTcav+ cells as compared to FRTwt [17,20]. In addition, we have found a significant amount of Förster resonance energy transfer (FRET) between eCFP–Cav1 and B2R–eYFP and between enhanced cyan fluorescent protein (eCFP)–Cav1 and Gαq–eYFP (enhanced yellow fluorescent protein), supporting a caveolae localization of these proteins [17,20]. These studies, as well as sedimentation studies, suggest that B2R localizes to caveolae domains [22]. In contrast, the presence of caveolae does not affect the function of another GPCR pathway, the μ-opioid receptor (μOR)/Gαi system, correlating with a lack of FRET between these proteins and Cav1 [20].
Here, we have measured the impact of caveolae on the diffusion properties of B2R using FCS and FRAP. Although FRAP studies show a small increase in the immobile population of B2R in the presence of caveolae, FCS studies show an unexpected increase in receptor mobility with caveolae. We postulate that this surprising FCS result is caused by confined movement of B2R to the periphery of caveolae domains.
Materials and methods
Materials
FRTwt and FRTcav+ cells and canine Cav1–eGFP (enhanced green fluorescent protein) DNA were gifts from Deborah Brown (Stony Brook University) and were cultured in F-12 Coon’s modified medium obtained from Sigma, as described previously [17]. Cells were imaged in Leibovitz’s L-15 medium from Gibco (see Ref. [23]) and transfected using Lipofectamine (Invitrogen) following the manufacturer’s protocol.
μOR–eGFP and Gαi–eYFP were obtained from Lakshmi Devi (Mount Sinai Medical Center). Gαq–eYFP was obtained from Catherine Berlot (Geisinger Research). B2R and B2R–GFP were obtained from Fredrik Leeb-Lundberg (Lund University). We have found that expressed proteins are functional [17,20,24]. The membrane marker is an eYFP fused with the first 20 amino acids of Gap-43 and is palmitoylated on cysteines 3 and 4 posttranslationally (Clontech).
FRAP measurements
FRTwt and FRTcav cells expressing fluorescently tagged proteins were seeded on glass-bottom dishes (MatTek). Cells were imaged with a 60× oil objective (NA 1.42) using an Olympus FluoView FV1000 microscope. For variable radius FRAP (vrFRAP), the focal plane was set on either the top or bottom membranes and circular regions of interest with increasing radii (1, 2, or 3 μm) were selected for bleaching. For areas of basolateral membranes and cell-to-cell contact, an approximately 2 × 2-μm rectangular region was selected for bleaching. The region of interest was illuminated with a high-intensity (100% transmittivity) 488-nm argon ion laser for 500 ms, and the recovery was observed for 120 s under low-intensity illumination (2% transmittivity). Under these bleaching conditions, at least approximately 50% of the original intensity was bleached after 500 ms of the bleaching pulse. To correct for photobleaching, a similar region of interest in a nonbleached cell located in the same field of view was selected and the time-dependent decrease in fluorescence was used to correct the recovery curves. Cells that exhibited cell movement or excessive photobleaching were not considered for the analysis. The corrected fluorescence recovery was fitted as described previously, using one component exponential fit [24]. Comparison of the normalized FRAP curves was performed using a Student t test with a statistical significance of P < 0.010 using SigmaPlot (Jandel Scientific).
FCS measurements
FCS measurements on cells expressing the membrane protein of interest were performed on an LSM 510–Confocor 2 system equipped with a 40× (NA 1.2) water immersion objective. GFP and YFP were excited using 488- and 514-nm argon ion laser lines, respectively, and the fluorescence emission was recorded using an avalanche photodiode through a longpass emission filter. The beam waist, ω0, and focal volume were calibrated with 10 nM rhodamine 6G solution (D = 2.8 × 10⁻⁶ cm2/s). Measurements of each cell were taken over 30 s and repeated more than four times. For each cell, the traces were averaged to obtain the final autocorrelation function to be used for fitting. The power of the excitation laser was adjusted such that there was sufficient signal-to-noise ratio and minimal photobleaching. Photobleaching was assessed by observing the time-dependent decrease in intensity of the time trace. This was achieved using 55% output of a 500-mW maximum output argon ion laser and 1% transmittivity for both the 488- and 514-nm laser lines. Traces that showed a decrease or increase of intensity over time were not used for analysis. Autocorrelation functions were analyzed using a two-component, pseudo-two-dimensional diffusion model by modifying the three-dimensional diffusion fitting routine provided by the Confocor2 software with the following equation and setting the structural parameter to quasi-infinite:
where τ is the correlation time, τD is the average time a particle spends in the confocal volume, N is the average number of molecules in the confocal volume, and S is the structural parameter. S was set to 100 (quasi-infinite) for two-dimensional diffusion. The diffusion coefficient, D, is calculated from the τD of a molecule using the Einstein relation for diffusion: r2 = 4D × τD, where r is the radius of the observation volume. For GFP-tagged proteins a fast component (~100–300 μs) is attributed to autofluorescence [25], whereas for YFP-tagged proteins the fast component in the time scales of 10 to 30 μs due to flickering of the eYFP was observed [26]. In both cases, a slow component in the 10- to 50-ms time range due to membrane diffusion could be clearly resolved in the autocorrelation curves.
Number and brightness analysis
An Olympus FluoView FV1000 microscope was used to determine the molecular brightness and number [27–29]. Data were taken at 12.5 μs/pixel, and an image series of 100 slices was acquired in the pseudo-photon-counting mode with a pixel size of 107 nm using an argon 488-nm laser and 0.1% transmittivity, as described previously [30].
Results
Visualization of caveolae domains
The size of a caveolae domain is too small to observe by fluorescence microscopy (i.e., ~50–100 nm in diameter; see Refs. [4–6]). In FRT cells, caveolae are concentrated on the basolateral membrane as opposed to the apical membrane [20]. To ensure that we will be viewing caveolae domains in FCS measurements, we estimated the number of caveolae that would be illuminated in a confocal volume. Confocal imaging of GFP fluorescence in FRTwt cells transfected with Cav1–eGFP suggests that 82% of the fluorescence intensity is on the basolateral membranes (n = 20) (see Fig. 1). By analyzing the fluorescence intensity of Cav1–eGFP on the basolateral membranes of these cells (n = 20), we estimate that caveolae domains account for approximately 40% of the basal and lateral membrane areas. Even though this model is based on the diffraction-limited measurements of Cav1–eGFP and should be considered only as an estimated assessment of the area, it indicates that there is a high probability of viewing caveolae on the basal and lateral membranes in FCS measurements. Because larger areas are bleached in FRAP measurements that may encompass other regions besides the caveolae-rich basolateral membrane, it is possible that a smaller percentage of caveolae is viewed.
FRAP studies
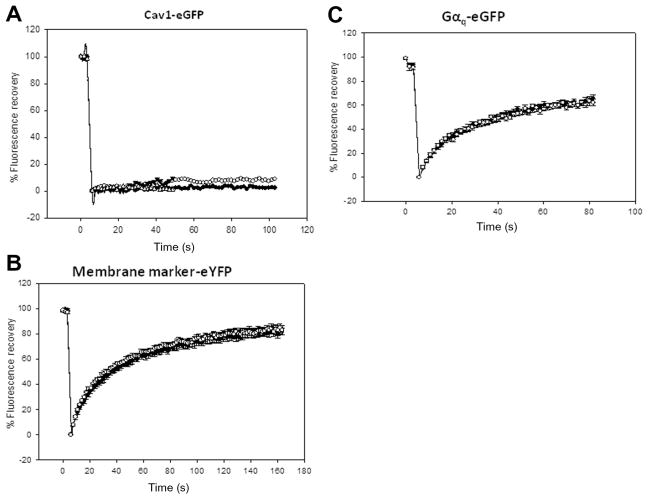
We determined the impact of caveolae on receptor diffusion by FRAP. These studies were initiated by measuring the diffusion of Cav1–eGFP expressed in FRTwt cells that do not contain caveolae. We find that after bleaching, the fluorescence of Cav1–eGFP does not recover over a 100-s period, suggesting an extremely limited diffusion. This immobility is consistent with Cav1 forming protein domains (Fig. 2A). We then measured the diffusion of a commercially available plasma membrane marker consisting of an eYFP linked to a small peptide with two hydrocarbon chains that anchor the fluorophore to the membrane surface. This construct is introduced into cells by transient transfection (see Materials and Methods). This marker should be freely diffusing on the membrane surface, and we find that its diffusion is unaffected by the presence of caveolae (Fig. 2B), suggesting that caveolae do not affect diffusion of small lipid components. In addition, Gαq, which is only peripherally bound to the membrane surface, is not sensitive to the presence of caveolae in FRAP measurements, suggesting that surface diffusion of this protein is similar on caveolae and non-caveolae surfaces (Fig. 2C).
Fig. 2.
FRAP studies of Cav1–eGFP (A), membrane marker–eYFP (Clontech) (B), and Gαq–eGFP (C) diffusing in the basolateral membrane of FRTwt and FRTcav+ cells. The open and closed circles are for data taken in FRTwt and FRTcav+ cells, respectively, where n = 10 to 13 (see Table 1). The data shown are average values and standard errors.
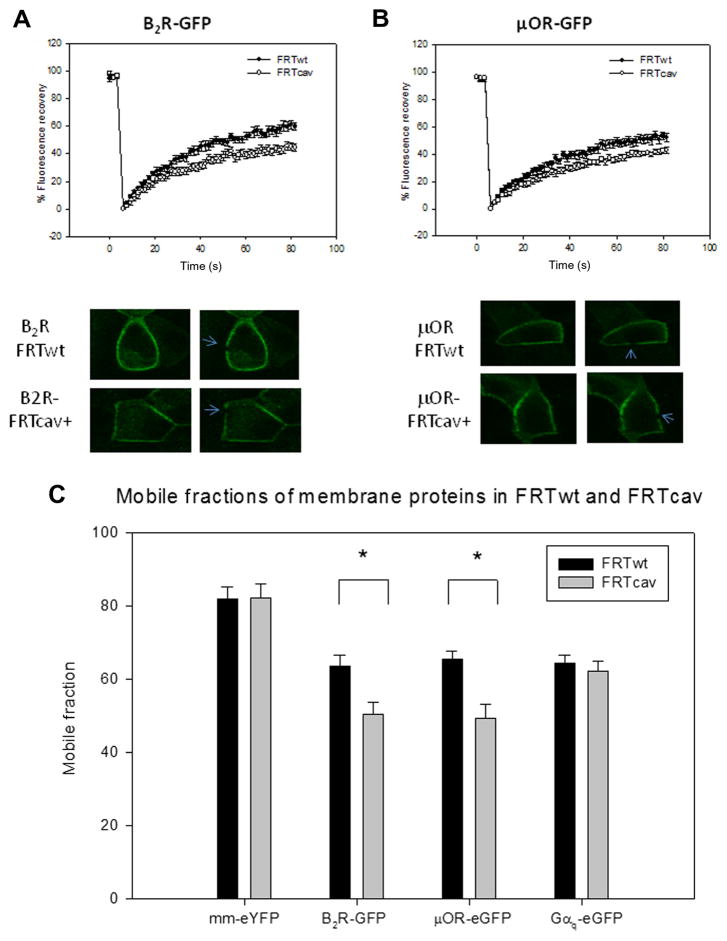
If B2R is incorporated into caveolae domains, we would expect its diffusion to be slower on the basolateral membrane where caveolae are localized, but not on the apical membrane where little caveolae are found. In accord with this idea, we find either no significant or small differences in the diffusion coefficients of B2R in the basolateral and apical membranes of FRTwt cells and FRTcav+ cells, which may be attributed to small differences in membrane structure (i.e., curvature of the apical membrane because it is not bound to glass, small folds in the lateral membrane, etc) (Fig. 3A and B). In addition, the recoveries of μOR in the basolateral and apical membranes were within error, as were the recoveries of μOR in the absence and presence of caveolae domains (Table 1 and Fig. 3A and B). However, when viewing caveolae-rich FRTcav+ basolateral membranes, the mobile fractions of both receptors are significantly reduced (Fig. 3C). Because both receptors show high mobility as compared with Cav1–eGFP, and because the presence of caveolae similarly effects their diffusion, these results suggest only a weak association of the receptors to caveolae domains. FRAP results are summarized in Table 1.
Fig. 3.
(A and B) FRAP studies of B2R–GFP (A) and μOR–GFP (B) diffusing in the basolateral membrane of FRTwt cells (●) and FRTcav+ cells (○), showing compiled data (top) and sample images (bottom), where n = 12 and 13 (see Table 1) and the arrow points to the bleached spot. (C) Comparison of mobile fractions in FRTwt and FRTcav+ cells obtained from FRAP curves in Fig. 5A below. Data are shown with standard errors. Because the data have a normal distribution as determined by a Shapiro–Wilk test, a Student t test was performed between FRTwt and FRTcav+ for each membrane protein. An asterisk indicates statistical difference in the mobile fractions of membrane proteins between FRTwt and FRTcav (P < 0.001).
Table 1.
FRAP and FCS results for proteins in FRT cells.
| Cell type | Protein | Diffusion coefficient | Mobile fraction | n (cells) |
|---|---|---|---|---|
| a-FRTwt | μOR–eGFP | 4.7 ± 0.9 × 10⁻¹¹ cm2/s | 0.80 ± 0.04 | 12 |
| a-FRTcav+ | μOR–eGFP | 4.1 ± 0.7 × 10⁻¹¹ cm2/s | 0.77 ± 0.02 | 12 |
| a-FRTwt | B2R–GFP | 4.6 ± 0.6 × 10⁻¹¹ cm2/s | 0.80 ± 0.03 | 6 |
| 5.0 ± 0.6 × 10⁻⁹ cm2/s | 22 | |||
| a-FRTcav+ | B2R–GFP | 4.3 ± 0.6 × 10⁻¹¹ cm2/s | 0.79 ± 0.04 | 6 |
| 6.3 ± 0.7 × 10⁻⁹ cm2/s | 21 | |||
| b-FRTwt | μOR–eGFP | 5.7 ± 0.7 × 10⁻¹¹ cm2/s | 0.66 ± 0.04 | 12 |
| 3.2 ± 0.2 × 10⁻⁹ cm2/s | 18 | |||
| b-FRTcav+ | μOR–eGFP | 5.3 ± 0.7 × 10⁻¹¹ cm2/s | 0.49 ± 0.02 | 12 |
| 3.4 ± 0.2 × 10⁻⁹ cm2/s | 16 | |||
| b-FRTwt | B2R–GFP | 6.8 ± 0.7 × 10⁻¹¹ cm2/s | 0.64 ± 0.03 | 13 |
| 8.1 ± 0.8 × 10⁻⁹ cm2/s | 80 | |||
| b-FRTcav+ | B2R–GFP | 6.0 ± 0.8 × 10⁻¹¹ cm2/s | 0.51 ± 0.03 | 12 |
| 14.9 ± 0.9 × 10⁻⁹ cm2/s | 86 | |||
| b-FRTwt | mm–eYFP | 5.7 ± 0.6 × 10⁻¹¹ cm2/s | 0.82 ± 0.04 | 10 |
| 12.3 ± 0.3 × 10⁻⁹ cm2/s | 81 | |||
| b-FRTcav+ | mm–eYFP | 5.7 ± 0.3 × 10⁻¹¹ cm2/s | 0.82 ± 0.03 | 13 |
| 9.3 ± 0.3 × 10⁻⁹ cm2/s | 60 | |||
| b-FRTwt | Gαq–eGFP | 2.0 ± 0.2 × 10⁻¹⁰ cm2/s | 0.64 ± 0.03 | 12 |
| 6.2 ± 0.3 × 10⁻⁹ cm2/s | 75 | |||
| b-FRTcav+ | Gαq–eGFP | 2.1 ± 0.2 × 10⁻¹⁰ cm2/s | 0.62 ± 0.02 | 10 |
| 11.0 ± 0.1 × 10⁻⁹ cm2/s | 74 |
Note: Shown are diffusion results for proteins and membrane marker (mm–eYFP) in FRTwt and FRTcav+ cells, where “a-” denotes the apical membrane and “b-” denotes the basolateral membrane. Values in normal font are those derived from FRAP measurements, whereas FCS measurements are in bold font. Diffusion coefficients assuming a 2 × 2 × 2-μm area reflect the beam dimensions in the x, y, and z planes and are thought to be appropriate for viewing membrane proteins diffusing in the basolateral membrane. Diffusion coefficients assuming a 2 × 4-μM area (not shown) were consistently 1.7 ± 0.1-fold lower in magnitude but the comparative results are unchanged. The data have a normal distribution as determined by Shapiro–Wilk test, and standard errors are shown. Differences in the mobile fractions for μOR and B2R in the basolateral membranes of FRTwt and FRTcav+ cells are significant (P < 0.001), whereas differences for mm–eYFP and Gαq–eGFP are not. Statistical analysis for the mobile fraction data can be found in Fig. 3C. These results show similar FRAP diffusion properties of the receptors in the absence and presence of caveolae.
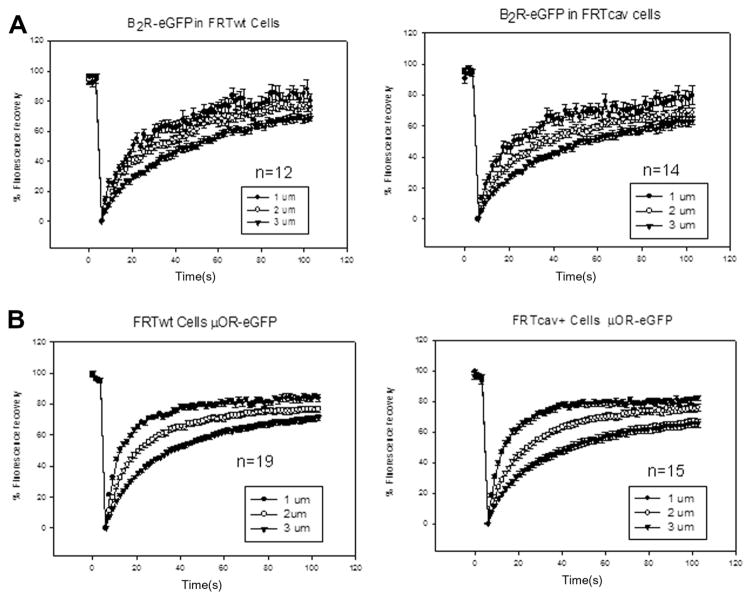
The distribution of caveolae is not uniform and the diameter of the bleach spot is relatively large, so there is a possibility that diffusion from membrane regions besides the basolateral membrane contributes to the observed recovery. We repeated the FRAP measurements with increasing radius of bleach spot (vrFRAP) on the basolateral membrane. This method has been previously used to investigate the lateral confinement of NK2 receptors in HEK293 cells [31] and in μOR in a neuronal cell line [32,33]. For receptors exhibiting confined diffusion within a domain size r, the authors found an inverse linear relationship between the mobile fraction, M, and the radius of the bleach spot:
where MP is the permanent mobile fraction. Furthermore, the diffusion coefficients obtained from each size of the bleached spot are apparent diffusion coefficients that depend on the domain size, r, the mobile fraction, and the size of the bleach spot, R. We see this relationship between the mobile fraction and bleach spot size for both B2R and μOR, but we could not detect significant differences in immobile fractions or apparent diffusion coefficients between FRTwt and FRTcav+ cells. This suggests that there are other mechanisms of receptor confinement in the absence of caveolae. We also find that the diffusion coefficients obtained using vrFRAP are similar to reported values (Table 2 and Fig. 4). Taken together, the FRAP results are inconsistent with a caveolae localization of B2R but instead correlate with a transient localization.
Table 2.
Results of vrFRAP in FRT cell basal membranes.
| Cell type | Protein | Diffusion coefficient | Mobile fraction | n (cells) |
|---|---|---|---|---|
| FRTwt 1 μm | μOR–eGFP | 4.1 ± 0.3 × 10⁻¹⁰ cm2/s | 0.81 ± 0.02 | 19 |
| FRTwt 2 μm | μOR–eGFP | 2.3 ± 0.2 × 10⁻¹⁰ cm2/s | 0.75 ± 0.02 | 19 |
| FRTwt 3 μm | μOR–eGFP | 1.5 ± 0.1 × 10⁻¹⁰ cm2/s | 0.70 ± 0.02 | 19 |
| FRTcav+ 1 μm | μOR–eGFP | 4.0 ± 0.2 × 10⁻¹⁰ cm2/s | 0.79 ± 0.02 | 15 |
| FRTcav+ 2 μm | μOR–eGFP | 2.1 ± 0.1 × 10⁻¹⁰ cm2/s | 0.74 ± 0.02 | 14 |
| FRTcav+ 3 μm | μOR–eGFP | 1.4 ± 0.1 × 10⁻¹⁰ cm2/s | 0.65 ± 0.03 | 15 |
| FRTwt 1 μm | B2R–GFP | 2.5 ± 0.2 × 10⁻¹⁰ cm2/s | 0.73 ± 0.02 | 14 |
| FRTwt 2 μm | B2R–GFP | 1.7 ± 0.2 × 10⁻¹⁰ cm2/s | 0.71 ± 0.01 | 13 |
| FRTwt 3 μm | B2R–GFP | 1.3 ± 0.1 × 10⁻¹⁰ cm2/s | 0.73 ± 0.01 | 12 |
| FRTcav+ 1 μm | B2R–GFP | 1.8 ± 0.1 × 10⁻¹⁰ cm2/s | 0.80 ± 0.02 | 15 |
| FRTcav+ 2 μm | B2R–GFP | 1.9 ± 0.2 × 10⁻¹⁰ cm2/s | 0.72 ± 0.03 | 14 |
| FRTcav+ 3 μm | B2R–GFP | 1.2 ± 0.1 × 10⁻¹⁰ cm2/s | 0.72 ± 0.04 | 15 |
Note: Diffusion coefficients were calculated by taking the values of t1/2 of the fitted recovery curves and calculating the diffusion by Einstein’s equation.
Fig. 4.
FRAP studies of B2R–GFP (A) and μOR–GFP (B) diffusing in the basolateral membrane of FRTwt and FRTcav+ cells where the size of the bleach spot was varied. Although the calculated diffusion coefficient decreased approximately 3-fold with bleach size, accompanied by a decrease in mobile fraction, no significant differences between mobility or mobile fraction for either receptor in FRTwt and FWTcav+ were found.
FCS measurements
We measured the mobility of B2R and μOR using single-point FCS. Fig. 5 shows an example of raw data and residuals, whereas the compiled results are listed in Table 1. We found that the apparent diffusion coefficients of μOR–eGFP on the basolateral membranes of FRTwt and FRTcav+ cells were identical. In addition, the apparent diffusion coefficients of B2R–GFP in the apical membranes of FRTwt and FRTcav+ cells were similar. Furthermore, the mobility of the membrane marker, mm–YFP, slowed in the presence of caveolae (Table 1). This reduced mobility is interpreted as being due to a small amount of incorporation of the palmitoyl groups into the domain because saturated lipids tend to incorporate into caveolae [4,5]. We note that the diffusion coefficients determined by FCS are faster than FRAP measurements (see Table 1) but are comparable to other reports of GPCR diffusion measured by FCS (see compilation in Ref. [24]).
Fig. 5.
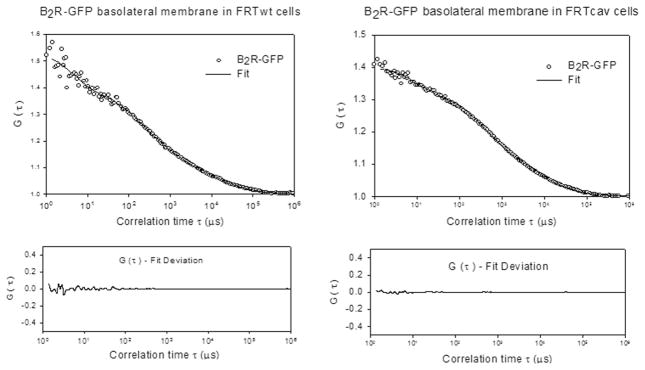
Representative FCS curves of B2R–GFP in FRTwt and FRTcav cells showing the fit and residuals for each curve.
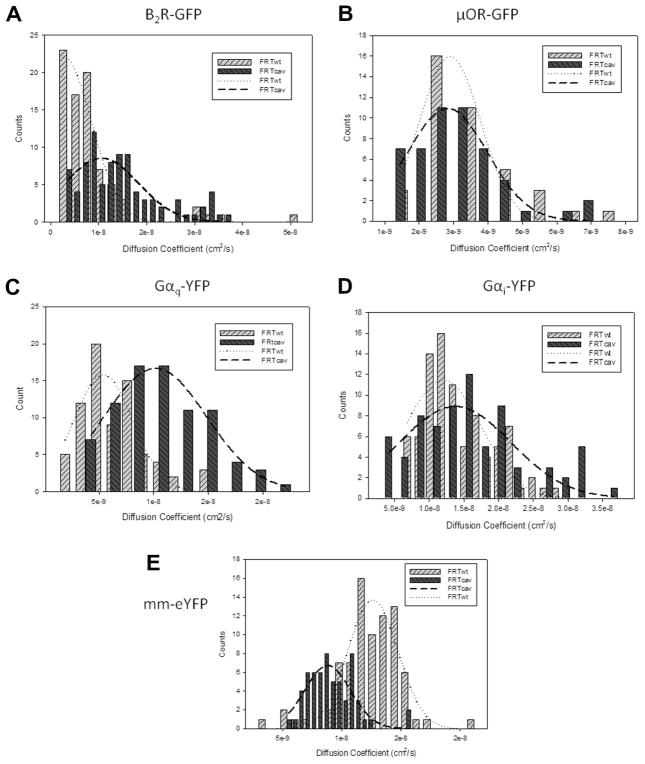
In contrast to observations for diffusion on the apical membrane, when we focused on the caveolae-rich basolateral membrane of FRTcav+ cells, we found a significant shift in the apparent diffusion of B2R toward faster mobilities: D = 8.1 ± 0.8 × 10⁻¹⁰ cm2/s (n = 80) for FRTwt and D = 14.9 ± 0.9 × 10⁻⁹ cm2/s (n = 86) for FRTcav+ (P ≤ 0.001). In addition, we found that the distribution of B2R diffusion coefficients differ in the two cell types (Fig. 6); a narrow distribution was seen for FRTwt cells as compared with a broader distribution in FRTcav+ cells. Similarly, a shift toward faster apparent diffusion coefficients in the presence of caveolae was seen for Gαq–eGFP, which has been shown to interact with caveolae (6.2 ± 0.3 × 10⁻⁹ cm2/s (n = 75) for FRTwt and 11.0 ± 0.1 × 10⁻⁸ cm2/s (n = 74) for FRTcav. As a control, we monitored the diffusion of another G protein that does not interact with caveolae, Gαi–eGFP [16], and found that caveolae do not affect their apparent diffusion (1.4 ± 0.1 × 10⁻⁸ cm2/s (n = 88) for FRTwt and 1.6 ± 0.1 × 10⁻⁸ cm2/s (n = 74) for FRTcav+ cells). The unexpected observation that B2R and Gαq appear to diffuse more rapidly on the basolateral membrane of FRTcav+ cells, whereas μOR and Gαi do not, indicates that caveolae are perturbing the movement and/or organization of these proteins (see Discussion).
Fig. 6.
Distribution of diffusion coefficients extracted from FCS data showing the broadening toward slower coefficients for membrane marker (E), similar coefficients for μOR (B) and Gαi (D), and faster values for B2R–GFP (A) and Gαq (C) in the presence of caveolae. Although the curves are fit to Gaussian distributions, no model is intended.
Number and brightness studies
It is possible that B2R exists as an aggregate that can be disrupted by caveolae, resulting in an increase in mobility. To determine whether this is the case, we monitored changes in the aggregation state of B2R by number and brightness (N&B) analysis [27]. N&B analysis reports on the molecular brightness and oligomerization of a fluorescent-tagged protein, resulting in higher values of molecular brightness values compared with the brightness of a monomeric control. In these studies, brightness was measured by following changes in fluorescence intensity on a confocal microscope pixel by pixel over a time series of repetitive scans, as described previously [30]. However, we could not detect significant differences in the brightness of the basolateral populations of μOR in FRTwt or FRTcav+ cells (29,904 ± 166 vs. 29,026 ± 207 counts/s/molecule) or of B2R in FRTwt or FRTcav+ cells (24,386 ± 418 vs. 24,014 ± 704 counts/s/molecule). These results suggest that caveolae are not affecting the homo-oligomerization of these receptors.
Discussion
Several methods have suggested that B2R and Gαq localize to caveolae domains [16,17,20,22,34,35]. We recently presented functional and FRET data supporting the idea that a subpopulation of B2R localizes in caveolae domains [20]. In this study, we have used diffusion measurements to test this idea. However, rather than support a caveolae localization of B2R, we find a much more complicated picture. FRAP measurements showed that the presence of caveolae did not affect the diffusion coefficients of the membrane marker, the surface-associated protein Gαq, or the two receptors. The inability of caveolae to affect diffusion of these proteins may be due to the large membrane area sampled in FRAP measurements that may include regions containing little caveolae. In addition, the ability of a caveolin molecule in a caveola that contains more than 100 caveolins as well as other proteins to fully compete with receptors for Gαq, and the ability of Gαq to compete with other caveolin proteins in the domain, would most likely not result in a significant drop in Gαq mobility.
Because Cav1 is essentially immobile, caveolae should increase the immobile population of the proteins. Although an approximately 15% increase in immobile population of B2R was observed, a similar increase was seen for μORs, which do not appear to localize to caveolae domains based on functional and FRET studies [20]. Thus, the mechanism underlying the increase in immobile fraction with caveolae might be due to a general diffusion barrier of these domains that nonspecifically affects larger transmembrane proteins.
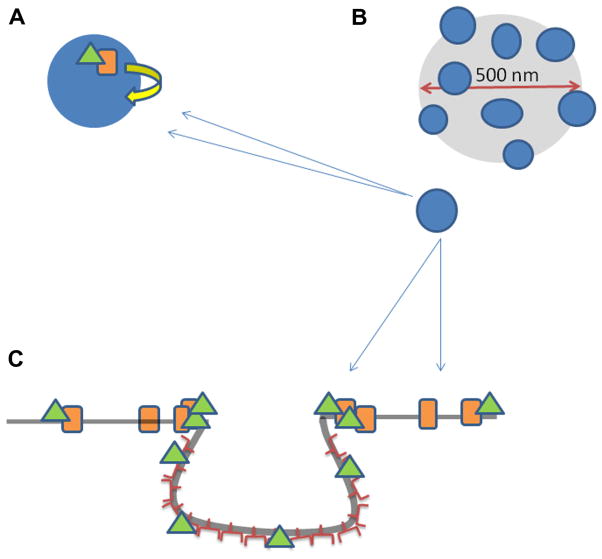
Although FRAP studies could not detect differences between μOR and B2R, FCS measurements that are more sensitive to local diffusion show that caveolae domains give an apparent increase in the mobility of B2R but not μOR. The faster mobility of B2R in the presence of caveolae is unexpected because interaction with caveolae would be expected to impede diffusion. However, because caveolae is affecting the rate of B2R diffusion, and because Cav1 is close enough to participate in FRET with the receptor, we suggest that a novel model for B2R–caveolae localization may explain these seemingly contrary results. We propose that the faster apparent diffusion of B2R in the presence of caveolae results from confined diffusion around the neck region of the domains rather than partitioning of the receptor into the domains. This peripheral association would result in a quasi-one-dimensional circular diffusion on the caveolae exterior. How would this affect the observed diffusion? In FCS measurements, a membrane area of approximately 250 nm is illuminated and there is the possibility of viewing many caveolae of the basolateral membrane because their diameters range from 50 to 100 nm and their density is high on the basolateral membrane (see Fig. 1). If the domains are totally contained within the FCS illumination volume, their diffusion cannot be detected by FCS because FCS is sensitive only to movement of fluorophores in and out of the confocal volume. Alternately, if the domains are partially contained in the illuminated area, the quasi-one-dimensional diffusion of receptors along the caveolae periphery would give rise to a faster effective diffusion in the observation area because its diffusion is confined in the domain periphery. The variation in the number of caveolae, the amount of their circumference illuminated, and the amount of receptors associated with the periphery would give rise to a broadened distribution of observed diffusion coefficients toward faster values, which is consistent with Fig. 6. A peripheral localization would fit well with the functional, FRET, and sedimentation studies described previously [20,22]. This model is depicted in Fig. 7. Although other interpretations are possible, a quasi-one-dimensional diffusion of receptor along the caveolae neck is the simplest. B2R has been reported to internalize through a caveolae pathway [22], and if this were the case one would expect a reduction of mobility with stimulation as the receptor incorporates into caveolae vesicles. The similar value of B2R diffusion properties in the absence and presence of caveolae with bradykinin stimulation (see Supplemental Fig. 1 in supplementary material) also supports a peripheral localization. Super-resolution studies are under way to test this hypothesis.
Fig. 7.
Cartoon describing our proposed model of B2R diffusion in the presence of caveolae. (A) B2R (orange rectangle), with its attached Gαq (green triangle), is transiently confined to diffuse on the periphery of caveolae (small blue circle) due to interactions between Cav1 and Gαq. (B) Cartoon depicts the illumination diameter in an FCS measurement focused on a plasma membrane region rich in caveolae (blue dots). (C) Side view of a caveolae domain in which B2R (orange rectangle) with its attached Gαq (green triangle) diffuses on the membrane until it encounters a caveolae invagination. The G protein interacts with the caveolin proteins while the receptor remains bound. It is possible for Gαq to diffuse on the surface of the caveolae domain, becoming detached from the receptor, which does not enter the domain. (For interpretation of the references to color in this figure legend, the reader is referred to the web version of this article.)
In summary, this study has highlighted the dependence of diffusion measurements on the geometry of proteins diffusing in membranes and other confined systems. Care must be taken in both the analysis and interpretation.
Supplementary Material
Acknowledgments
The authors are grateful to Deborah Brown (Stony Brook University) for providing the FRT cells, to Lakshmi Devi (Mount Sinai School of Medicine) for providing the DNA for the receptors, and to Urszula Golebiewska (Queensborough Community College) for her advice. This work was supported by grant NIH053132.
Appendix A. Supplementary material
Supplementary data associated with this article can be found, in the online version, at http://dx.doi.org/10.1016/j.ab.2013.04.033.
Footnotes
Abbreviations used: FCS, fluorescence correlation spectroscopy; FRAP, fluorescence recovery after photobleaching; GPCR, G-protein-coupled receptor; FRT, Fisher rat thyroid; B2R, bradykinin type 2 receptor; PLCβ, phospholipase Cβ; FRET, Förster resonance energy transfer; eCFP, enhanced cyan fluorescent protein; eYFP, enhanced yellow fluorescent protein; μOR, μ-opioid receptor; eGFP, enhanced green fluorescent protein; vrFRAP, variable radius FRAP; N&B, number and brightness.
References
- 1.Alexrod D, Koppel D, Schlessinger J, Elson E, Webb W. Mobility measurements by analysis of fluorescence photobleaching recovery kinetics. Biophys J. 1976;16:1055–1069. doi: 10.1016/S0006-3495(76)85755-4. [DOI] [PMC free article] [PubMed] [Google Scholar]
- 2.Schwille P, Haupts U, Maiti S, Webb WW. Molecular dynamics in living cells observed by fluorescence correlation spectroscopy with one- and two-photon excitation. Biophys J. 1999;77:2251–2265. doi: 10.1016/S0006-3495(99)77065-7. [DOI] [PMC free article] [PubMed] [Google Scholar]
- 3.Suzuki K, Ritchie K, Kajikawa E, Fujiwara T, Kusumi A. Rapid hop diffusion of a G-protein-coupled receptor in the plasma membrane as revealed by single-molecule techniques. Biophys J. 2005;88:3659–3680. doi: 10.1529/biophysj.104.048538. [DOI] [PMC free article] [PubMed] [Google Scholar]
- 4.Anderson RG. The caveolae membrane system. Annu Rev Biochem. 1998;67:199–225. doi: 10.1146/annurev.biochem.67.1.199. [DOI] [PubMed] [Google Scholar]
- 5.Schlegel A, Volonte D, Engelman JA, Galbiata F, Mehta P, Zhange X-L, Scherer P, Lisanti MP. Crowded little caves: structure and function of caveolae. Cell Signal. 1998;10:457–463. doi: 10.1016/s0898-6568(98)00007-2. [DOI] [PubMed] [Google Scholar]
- 6.Parton RG, Simons K. The multiple faces of caveolae. Nat Rev Mol Cell Biol. 2007;8:185–194. doi: 10.1038/nrm2122. [DOI] [PubMed] [Google Scholar]
- 7.Lipardi C, Mora R, Colomer V, Paladino S, Nitsch L, Rodriguez-Boulan E, Zurzolo C. Caveolin transfection results in caveolae formation but not apical sorting of glycosylphosphatidylinositol (GPI)-anchored proteins in epithelial cells. J Cell Biol. 1998;140:617–626. doi: 10.1083/jcb.140.3.617. [DOI] [PMC free article] [PubMed] [Google Scholar]
- 8.Monier S, Dietzen DJ, Hastings WR, Lublin DM, Kurzchalia TV. Oligomerization of VIP21–caveolin in vitro is stabilized by long chain fatty acylation or cholesterol. FEBS Lett. 1996;388:143–149. doi: 10.1016/0014-5793(96)00519-4. [DOI] [PubMed] [Google Scholar]
- 9.Rothberg KG, Heuser JE, Donzell WC, Ying YS, Glenney JR, Anderson RGW. Caveolin, a protein component of caveolae membrane coats. Cell. 1992;68:673–682. doi: 10.1016/0092-8674(92)90143-z. [DOI] [PubMed] [Google Scholar]
- 10.Rothberg KG, Ying YS, Kamen BA, Anderson RGW. Cholesterol controls the clustering of the glycophospholipid-anchored membrane receptor for 5-methyltetrahydrofolate. J Cell Biol. 1990;111:2931–2938. doi: 10.1083/jcb.111.6.2931. [DOI] [PMC free article] [PubMed] [Google Scholar]
- 11.Hansen CG, Nichols BJ. Exploring the caves: cavins, caveolins, and caveolae. Trends Cell Biol. 2010;20:177–186. doi: 10.1016/j.tcb.2010.01.005. [DOI] [PubMed] [Google Scholar]
- 12.Rybin VO, Xu X, Lisanti MP, Steinberg SF. Differential targeting of β-adrenergic receptor subtypes and adenylyl cyclase to cardiomyocyte caveolae: a mechanism to functionally regulate the cAMP signaling pathway. J Biol Chem. 2000;275:41447–41457. doi: 10.1074/jbc.M006951200. [DOI] [PubMed] [Google Scholar]
- 13.Zajchowski LD, Robbins SM. Lipid rafts and little caves: compartmentalized signalling in membrane microdomains. Eur J Biochem. 2002;269:737–752. doi: 10.1046/j.0014-2956.2001.02715.x. [DOI] [PubMed] [Google Scholar]
- 14.Chini B, Parenti M. G-protein coupled receptors in lipid rafts and caveolae: how, when, and why do they go there? J Mol Endocrinol. 2004;32:325–338. doi: 10.1677/jme.0.0320325. [DOI] [PubMed] [Google Scholar]
- 15.Alberts B, Bray D, Lewis J, Raff M, Roberts K, Watson J. Molecular Biology of the Cell. Garland; New York: 1994. [Google Scholar]
- 16.Oh P, Schnitzer JE. Segregation of heterotrimeric G proteins in cell surface microdomains: Gq binds caveolin to concentrate in caveolae, whereas Gi and Gs target lipid rafts by default. Mol Biol Cell. 2001;12:685–698. doi: 10.1091/mbc.12.3.685. [DOI] [PMC free article] [PubMed] [Google Scholar]
- 17.Sengupta P, Philip F, Scarlata S. Caveolin-1 alters Ca2+ signal duration through specific interaction with the Gαq family of G proteins. J Cell Sci. 2008;121:1363–1372. doi: 10.1242/jcs.020081. [DOI] [PMC free article] [PubMed] [Google Scholar]
- 18.Guo Y, Golebiewska U, Scarlata S. Modulation of Ca2+ activity in cardiomyocytes through caveolae–Gαq interactions. Biophys J. 2011;100:1599–1607. doi: 10.1016/j.bpj.2011.02.013. [DOI] [PMC free article] [PubMed] [Google Scholar]
- 19.Mora R, Bonilha VL, Marmorstein A, Scherer PE, Brown D, Lisanti MP, Rodriguez-Boulan E. Caveolin-2 localizes to the Golgi complex but redistributes to plasma membrane, caveolae, and rafts when co-expressed with caveolin-1. J Biol Chem. 1999;274:25708–25717. doi: 10.1074/jbc.274.36.25708. [DOI] [PubMed] [Google Scholar]
- 20.Calizo RC, Scarlata S. A role for G-proteins in directing G-protein-coupled receptor–caveolae localization. Biochemistry. 2012;51:9513–9523. doi: 10.1021/bi301107p. [DOI] [PMC free article] [PubMed] [Google Scholar]
- 21.Bachvarov DR, Houle S, Bachvarova M, Bouthillier J, Adam A, Marceau F. Bradykinin B2 receptor endocytosis, recycling, and down-regulation assessed using green fluorescent protein conjugates. J Pharmacol Exp Ther. 2001;297:19–26. [PubMed] [Google Scholar]
- 22.de Weerd W, Leeb-Lundberg L. Bradykinin sequesters B2 bradykinin receptors and the receptor coupled Gα subnuits Gαq and Gαi in caveolae in DDT1 MF-2 smooth muscle cells. J Biol Chem. 1997;272:17858–17866. doi: 10.1074/jbc.272.28.17858. [DOI] [PubMed] [Google Scholar]
- 23.Lipardi C, Mora R, Colomer V, Paladino S, Nitsch L, Rodriguez-Boulan E, Zurzolo C. Caveolin transfection results in caveolae formation but not apical sorting of glycosylphosphatidylinositol (GPI)-anchored poteins in epithelial cells. J Cell Biol. 1998;140:617–626. doi: 10.1083/jcb.140.3.617. [DOI] [PMC free article] [PubMed] [Google Scholar]
- 24.Philip F, Sengupta P, Scarlata S. Signaling through a G-protein coupled receptor and its corresponding G protein follows a stoichometrically limited model. J Biol Chem. 2007;282:19203–19216. doi: 10.1074/jbc.M701558200. [DOI] [PubMed] [Google Scholar]
- 25.Brock R, Hink MA, Jovin TM. Fluorescence correlation microscopy of cells in the presence of autofluorescence. Biophys J. 1998;75:2547–2557. doi: 10.1016/S0006-3495(98)77699-4. [DOI] [PMC free article] [PubMed] [Google Scholar]
- 26.Schwille P, Kummer S, Heikal AA, Moerner WE, Webb WW. Fluorescence correlation spectroscopy reveals fast optical excitation-driven intramolecular dynamics of yellow fluorescent proteins. Proc Natl Acad Sci USA. 2000;97:151–156. doi: 10.1073/pnas.97.1.151. [DOI] [PMC free article] [PubMed] [Google Scholar]
- 27.Digman MA, Dalal R, Horwitz AF, Gratton E. Mapping the number of molecules and brightness in the laser scanning microscope. Biophys J. 2008;97:2320–2332. doi: 10.1529/biophysj.107.114645. [DOI] [PMC free article] [PubMed] [Google Scholar]
- 28.Dalal RB, Digman MA, Horwitz AF, Vetri V, Gratton E. Determination of particle number and brightness using a laser scanning confocal microscope operating in the analog mode. Microsc Res Tech. 2008;81:69–81. doi: 10.1002/jemt.20526. [DOI] [PubMed] [Google Scholar]
- 29.Digman MA, Wiseman PW, Choi C, Horwitz AR, Gratton E. Stoichiometry of molecular complexes at adhesions in living cells. Proc Natl Acad Sci USA. 2009;106:1–6. doi: 10.1073/pnas.0806036106. [DOI] [PMC free article] [PubMed] [Google Scholar]
- 30.Golebiewska U, Johnston JM, Devi L, Filizola M, Scarlata S. Differential response to morphine of the oligomeric state of μ-opioid in the presence of δ-opioid receptors. Biochemistry. 2011;50:2829–2837. doi: 10.1021/bi101701x. [DOI] [PMC free article] [PubMed] [Google Scholar]
- 31.Cézanne L, Lecat S, Lagane B, Millot C, Vollmer J-Y, Matthes H, Galzi J-L, Lopez A. Dynamic confinement of NK2 receptors in the plasma membrane: improved FRAP analysis and biological relevance. J Biol Chem. 2004;279:45057–45067. doi: 10.1074/jbc.M404811200. [DOI] [PubMed] [Google Scholar]
- 32.Saulière-Nzeh AN, Millot C, Corbani M, Mazères S, Lopez A, Salomé L. Agonist-selective dynamic compartmentalization of human μ-opioid receptor as revealed by resolutive FRAP analysis. J Biol Chem. 2010;285:14514– 14520. doi: 10.1074/jbc.M109.076695. [DOI] [PMC free article] [PubMed] [Google Scholar]
- 33.Saulière A, Gaibelet G, Millot C, Mazères S, Lopez A, Salomé L. Diffusion of the μ-opioid receptor at the surface of human neuroblastoma SH–SY5Y cells is restricted to permeable domains. FEBS Lett. 2006;580:5227–5231. doi: 10.1016/j.febslet.2006.08.056. [DOI] [PubMed] [Google Scholar]
- 34.Lamb M, Zhang C, Shea T, Kyle D, Leeb-Lundberg LMF. Human B1 and B2 bradykinin receptors and their agonists target caveolae-related lipid rafts to different degrees in HEK293 cells. Biochemistry. 2002;41:14340–14347. doi: 10.1021/bi020231d. [DOI] [PubMed] [Google Scholar]
- 35.Murthy KS, Makhlouf GM. Heterologous desensitization mediated by G protein-specific binding to caveolin. J Biol Chem. 2000;275:30211–30219. doi: 10.1074/jbc.M002194200. [DOI] [PubMed] [Google Scholar]
Associated Data
This section collects any data citations, data availability statements, or supplementary materials included in this article.


