

Abstract
Background. Asthma-like symptoms are frequent in overweight and obesity, but the mechanism is unclear when airway hyperresponsiveness (AHR) is lacking. In this study, we focused on obese women with a clinical suspicion of asthma but negative methacholine challenge and tested distal airway hyperreactivity, explored by Forced Vital Capacity dose-response slope (FVC DRS). Objective. To question AHR at the distal airway level in obese women. Methods. A total of 293 symptomatic obese and nonobese women free of treatment were investigated. Methacholine challenge tests were undertaken, and patients were divided according to their results to the test. In hyperreactive and nonhyperreactive patients and in our total population, correlations, regression analyses, and analyses of covariance were performed to compare distal airway hyperreactivity in three groups of body mass index (BMI). Results. After adjusting for age and baseline respiratory values, the relationship between FVC and FEV1 (forced expiratory volume in one second) DRS was influenced by BMI, with a lower slope in obese than overweight and normal patients in our total population (P = 0.008) and in our nonhyperreactive one (P = 0.028). Conclusion. Distal airway hyperresponsiveness was observed in symptomatic wheezing obese women negative to methacholine challenge.
1. Introduction
The relationship between obesity and airway hyperresponsiveness (AHR) has been a great matter of interest among the scientific community for many years. Several studies have enlightened that obese patients (body mass index (BMI) > 30 kg/m²) were more likely to have a clinical diagnosis of asthma and to receive antiasthma drugs, but the effect of obesity on airway hyperresponsiveness remains debated [1–4].
Overweight and obesity are comorbid conditions known to be associated with poorer asthma control [5] and potential resistance to current therapy [6]. However, other studies have challenged these associations [7], and the potential benefit of weight loss on bronchial reactivity was questioned [8].
Previous reports demonstrated that obesity was an independent risk factor for AHR [9, 10], but the symptomatic mechanisms in patients free of AHR are to be addressed.
Asthma-like symptoms are frequent but not always related to AHR—with an important risk of bias in epidemiological studies, where challenges are rarely done (creating a risk of overdiagnosis). In a study by Stenius-Aarniala et al. [11], obese patients had more severe symptoms when taking more asthma medications, but there was no evidence of airflow obstruction.
Previous studies have hypothesized that the variations in airway calibre and pulmonary volumes, occurring during bronchoconstriction, were different in obese and nonobese asthmatic patients, due to a greater involvement of distal airways in the obese population [12, 13]. However, what this involvement means from a physiological point of view is unclear, and no alternative diagnoses are proposed in these symptomatic patients who did not respond to methacholine.
Airway closure has been found to be a determinant of AHR. Chapman and his team [14] came to this conclusion by comparing airway closure during bronchoconstriction in asthmatic, nonasthmatic, and nonasthmatic obese subjects. Airway closure and airway narrowing, measured by spirometry, suggested a link between airway closure and AHR. Hence it was important to study the association between obesity and airway closure.
The Forced Vital Capacity fall throughout a methacholine challenge test was previously reported as potential reflection of small airway closure in several studies [15–17].
Besides, the role of gender in AHR in overweight and obese people is a potential confounder in many studies. According to epidemiological reports [18], bronchial asthma or AHR has been found to be associated with obesity only in males [19, 20], only in females [21], or in both genders [22]. For this study, we decided to include only women, in order to maintain homogeneity and to avoid any effect due to gender.
In the present study, we investigated symptomatic obese women aiming at demonstrating any difference at the distal level of the airway tree. We assessed the impact of BMI on several lung function parameters derived from the methacholine challenge, such as FVC fall and FEV1 fall throughout the methacholine challenge test, and FEV1 and FVC dose-response slopes, in order to better understand the complex relationships between obesity, airway closure, AHR, and asthma-like symptoms.
2. Methods
2.1. Study Design
The study was based on the retrospective analysis of subjects from the Respiratory Department of the Arnaud de Villeneuve Hospital (Montpellier, France).
According to the French Law (Law 88-1138 relative to Biomedical Research of December 20, 1988, modified on August 9, 2004), this noninterventional study did not require approval by an ethics committee or informed signed consent from patients. It was reviewed and approved by our institutional review board (IRB number: 11/10-07).
A total of 293 consecutive women were considered from January 2007 to December 2009. All patients had symptoms likely to suggest asthma, which include wheezing, dyspnoea, chest tightness, or cough in the following circumstances: (1) with exposure to cold air, (2) after exercise, (3) during respiratory infections, (4) following inhalant exposures in the workplace, and (5) after exposure to allergens and other asthma triggers [23]. Differential diagnoses were excluded according to good clinical practice by the physicians [24], subjects were free from any asthma medication, and smokers greater than 5 packs per year were excluded.
All patients underwent a methacholine bronchial provocation test, and AHR was defined as a provocative concentration causing a 20% fall in FEV1 (PC20) inferior or equal to 16 mg/mL. Throughout this paper, positive patients to the methacholine test are referred to as “AHR+” and negative patients as “AHR−.”
Three groups of patients were considered according to their BMI. BMI-normal subjects were defined as having a BMI < 25 kg/m2, overweight subjects as having a BMI ≥ 25 kg/m2 and < 30 kg/m2, and obese subjects as having a BMI ≥ 30 kg/m2 [25].
2.2. Methacholine Challenge
Methacholine challenges were performed according to the American Thoracic Society Guidelines [23], with the five-breath dosimeter method (ADD AerodoseR with Atomisor NL11AD nebulizer, Atomisor, CE 0459, Dir. Eur. 93/42/CEE). After the baseline spirometry was performed, the first dose of methacholine was administered if the FEV1 value was greater than 80% of the predicted value. The FEV1 was measured after the appropriate amount of time (about 30 seconds). We made sure to obtain an acceptable-quality FVC at each dose, without too much manoeuvres in order to avoid tiredness. The quality control for FVC repeatability was done by a calibrated machine coupled to a professional software (JAEGER).
Furthermore, in order to keep the cumulative effect of methacholine, the waiting time between each dose was kept under 2 minutes. When an FEV1 fall greater or equal to 20% was reached, a bronchodilator was administered and FEV1 was measured after a 15-minute wait and until complete recovery was reached.
AHR was defined by a PC20 lower or equal to 16 mg/mL.
2.3. Variables
AHR was measured as the FEV1 dose-response slope (DRS) throughout the methacholine challenge test. Distal airway closure was estimated by the FVC DRS. These DRS were obtained from a calculation based on the last value minus the baseline value, divided by the last methacholine dose in mg. With this methodology, we could take into account the methacholine dose when considering the fall in respiratory parameters. The relationship between changes in FVC and FEV1, each represented by their dose-response slope, provided an estimate of the proportion of FEV1 change that was attributable to airway closure.
The closing index was the percentage fall in FVC divided by the percentage fall in FEV1. The percentage falls were defined as (last value − baseline value)/last value.
Implemented Variables
| (1) |
2.4. Statistical Analyses
First, a Kolmogorov-Smirnov test was used to assess the normality of our variables. Because variables were not normally distributed, the comparison of population characteristics between normal weight, overweight, and obese patients was studied via nonparametric Kruskal-Wallis tests, and the results were expressed as medians and interquartile ranges. Nonparametric Spearman correlation tests were also executed, in order to quantify the strength of the relationship between FEV1 and FVC fall.
The effect of BMI on the relationship between the fall in FEV1 and the fall in FVC throughout the methacholine test was examined using a linear regression of FVC DRS against FEV1 DRS for the three levels of BMI (normal, overweight, and obesity), with BMI-normal patients as our control group. FEV1 DRS was considered as the predicted variable, and FVC DRS as the independent parameter. This allowed us to calculate the contribution of the FVC DRS to the FEV1 DRS.
In order to compare the slopes calculated in the linear regressions and represented in the graphic representations, we carried out analyses of covariance (ANCOVA), with FEV1 DRS as the predicted variable and FVC DRS and BMI as the independent parameters. We focused particularly on the interaction term, which described significant differences between the slopes.
This has been done for the AHR+ patients, the AHR− patients, and the whole population. In order to achieve normality and a clearer graphic representation, log (FEV1 DRS) and log (FVC DRS) were used instead of the variables themselves.
All these results were adjusted for age and baseline respiratory values, and a P value lower than 0.05 was considered statistically significant.
Statistical tests were performed with R 2.10 (the R Foundation for Statistical Computing) and SAS 9.2 (SAS Institute Inc., Cary, NC).
3. Results
3.1. Demographics and Body Mass Index
Baseline demographics and clinical characteristics categorized according to BMI groups are shown in Tables 1, 2, and 3. 182 women with normal BMI, 62 overweight, and 49 obese participated in this study. Overweight and obese women were older (P < 0.0001) and had lower values in baseline FVC and FEV1 (P < 0.0001) and FEV1/FVC ratio (P = 0.0375). Obese patients also had higher values in FEV1 fall (P = 0.0230), FEV1 DRS (P = 0.0008), FVC fall (P = 0.0011), and FVC DRS (P = 0.0008) (Table 1).
Table 1.
Lung function data of the BMI-normal, overweight, and obese patients, in the entire population.
| Variables | Total | BMI < 25 | 25 ≤ BMI < 30 | BMI ≥ 30 | P value |
|---|---|---|---|---|---|
| n = 293 | n = 182 | n = 62 | n = 49 | ||
| Smoking | 0.2350 | ||||
| Yes | 39 (13.31) | 29 (15.93) | 8 (12.90) | 2 (4.08) | |
| No | 228 (77.82) | 137 (75.27) | 50 (80.65) | 41 (83.67) | |
| Former smoker | 26 (8.87) | 16 (8.76) | 4 (6.45) | 6 (12.24) | |
| Age (years) | 41.04 (12.80) | 37.91 (12.76) | 45.38 (12.39)*** | 47.18 (9.32)** | <0.0001 |
| BMI (kg/m2) | 24.65 (5.41) | 21.22 (2.19) | 27.45 (1.51)*** | 33.83 (4.02)*** | <0.0001 |
| FVC (L) | 3.20 (0.59) | 3.36 (0.54) | 2.99 (0.61)** | 2.89 (0.56)*** | <0.0001 |
| FVC (% pred) | 0.99 (0.14) | 1.01 (0.14) | 0.97 (0.13) | 0.98 (0.15) | 0.1094 |
| FEV1 (L) | 2.72 (0.54) | 2.88 (0.52) | 2.49 (0.49)** | 2.42 (0.48)** | <0.0001 |
| FEV1 (% pred) | 0.98 (0.14) | 0.99 (0.14) | 0.94 (0.13)* | 0.97 (0.16) | 0.0287 |
| FEV1/FVC (%) | 0.85 (0.06) | 0.86 (0.07) | 0.84 (0.05)* | 0.84 (0.05)* | 0.0375 |
| FVC fall (%) | 11.32 (8.71) | 10.66 (8.84) | 10.85 (8.07) | 14.37 (8.53)** | 0.0111 |
| FEV1 fall (%) | 16.92 (9.96) | 16.72 (10.38) | 15.17 (9.40) | 19.86 (8.53)* | 0.0230 |
| FVC DRS | 0.03 (0.10) | 0.03 (0.11) | 0.02 (0.03) | 0.05 (0.11)** | 0.0008 |
| FEV1 DRS | 0.04 (0.13) | 0.04 (0.15) | 0.03 (0.05) | 0.07 (0.15)** | 0.0008 |
| CI | 0.68 (0.57) | 0.67 (0.64) | 0.72 (0.53) | 0.71 (0.28) | 0.1142 |
Data are presented as median (interquartile range) (all but smoking) and n (%) (smoking). BMI: body mass index; FEV1: forced expiratory volume in one second; FVC: forced volume capacity; DRS: dose-response slope; CI: closing index.
*P < 0.05 versus BMI < 25; **P < 0.01 versus BMI < 25; ***P < 0.001 versus BMI < 25.
Table 2.
Lung function data of the BMI-normal, overweight, and obese patients, in the AHR+ population.
| Variables | Total | BMI < 25 | 25 ≤ BMI < 30 | BMI ≥ 30 | P value |
|---|---|---|---|---|---|
| n = 123 | n = 71 | n = 20 | n = 32 | ||
| Smoking | 0.3120 | ||||
| Yes | 18 (14.63) | 13 (18.31) | 4 (20.00) | 1 (3.13) | |
| No | 93 (75.61) | 51 (71.83) | 14 (70.00) | 28 (87.50) | |
| Former smoker | 12 (9.76) | 7 (9.86) | 2 (10.00) | 3 (9.38) | |
| Age (years) | 41.50 (12.94) | 37.98 (13.28) | 45.57 (13.03) | 46.80 (9.44) | 0.0025 |
| BMI (kg/m2) | 25.19 (6.26) | 20.66 (2.05) | 27.58 (1.45)*** | 33.77 (4.11)*** | <0.0001 |
| FVC (L) | 3.04 (0.52) | 3.18 (0.45) | 2.98 (0.60) | 2.78 (0.54) | 0.0004 |
| FVC (% pred) | 0.95 (0.13) | 0.96 (0.12) | 0.94 (0.11) | 0.94 (0.14) | 0.5261 |
| FEV1 (L) | 2.57 (0.50) | 2.73 (0.47) | 2.44 (0.47)** | 2.31 (0.46)*** | <0.0001 |
| FEV1 (% pred) | 0.93 (0.14) | 0.96 (0.13) | 0.90 (0.11) | 0.92 (0.15) | 0.1930 |
| FEV1/FVC (%) | 0.84 (0.07) | 0.86 (0.04) | 0.82 (0.05) | 0.83 (0.05) | 0.1068 |
| FVC fall (%) | 17.52 (8.42) | 16.76 (9.60) | 19.02 (5.15) | 18.26 (7.21) | 0.3434 |
| FEV1 fall (%) | 24.97 (8.15) | 25.38 (9.58) | 24.71 (5.29) | 24.26 (6.10) | 0.7683 |
| FEV1 DRS | 0.09 (0.20) | 0.10 (0.22) | 0.07 (0.08) | 0.11 (0.18) | 0.6897 |
| FVC DRS | 0.06 (0.15) | 0.06 (0.18) | 0.05 (0.05) | 0.08 (0.13) | 0.5523 |
| CI | 0.69 (0.26) | 0.65 (0.25) | 0.77 (0.15) | 0.76 (0.24) | 0.0591 |
Data are presented as median (interquartile range) (all but smoking) and n (%) (smoking). BMI: body mass index; FEV1: forced expiratory volume in one second; FVC: forced volume capacity; DRS: dose-response slope; CI: closing index.
*P < 0.05 versus BMI < 25; **P < 0.01 versus BMI < 25; ***P < 0.001 versus BMI < 25.
Table 3.
Lung function data of the BMI-normal, overweight, and obese patients, in the AHR− population.
| Variables | Total | BMI < 25 | 25 ≤ BMI < 30 | BMI ≥ 30 | P value |
|---|---|---|---|---|---|
| n = 170 | n = 111 | n = 42 | n = 17 | ||
| Smoking | 0.2350 | ||||
| Yes | 21 (12.35) | 16 (14.41) | 4 (9.52) | 1 (5.88) | |
| No | 135 (79.41) | 86 (77.48) | 36 (85.71) | 13 (76.47) | |
| Former smoker | 14 (8.24) | 9 (8.11) | 2 (4.76) | 3 (17.64) | |
| Age (years) | 40.70 (12.71) | 37.86 (12.48) | 45.29 (12.22)** | 47.90 (9.32)*** | 0.0003 |
| BMI (kg/m2) | 24.25 (4.67) | 21.57 (2.21) | 27.39 (1.54)*** | 33.92 (3.98)*** | <0.0001 |
| FVC (L) | 3.31 (0.62) | 3.47 (0.57) | 2.98 (0.62)*** | 3.10 (0.54)** | <0.0001 |
| FVC (% pred) | 1.02 (0.14) | 1.03 (0.14) | 0.98 (0.14)* | 1.06 (0.13) | 0.0415 |
| FEV1 (L) | 2.82 (0.55) | 2.97 (0.53) | 2.51 (0.50)*** | 2.63 (0.47)** | <0.0001 |
| FEV1 (% pred) | 1.01 (0.14) | 1.02 (0.14) | 0.96 (0.14)* | 1.06 (0.14) | 0.0226 |
| FEV1/FVC (%) | 0.85 (0.06) | 0.85 (0.06) | 0.84 (0.05) | 0.85 (0.04) | 0.5918 |
| FVC fall (%) | 6.87 (5.68) | 6.81 (5.61) | 6.95 (6.05) | 7.05 (5.54) | 0.9337 |
| FEV1 fall (%) | 11.14 (6.54) | 11.26 (6.40) | 10.62 (7.25) | 11.58 (5.89) | 0.6511 |
| FEV1 DRS | 0.006 (0.003) | 0.006 (0.003) | 0.005 (0.003) | 0.006 (0.002) | 0.4671 |
| FVC DRS | 0.003 (0.003) | 0.004 (0.003) | 0.003 (0.002) | 0.005 (0.002) | 0.7422 |
| CI | 0.67 (0.72) | 0.68 (0.79) | 0.70 (0.63) | 0.72 (0.30) | 0.5918 |
Data are presented as median (interquartile range) (all but smoking) and n (%) (smoking). BMI: body mass index; FEV1: forced expiratory volume in one second; FVC: forced volume capacity; DRS: dose-response slope; CI: closing index.
*P < 0.05 versus BMI < 25; **P < 0.01 versus BMI < 25; ***P < 0.001 versus BMI < 25.
AHR+ patients differed only by age and baseline FEV1. In this subgroup, overweight and obese women were significantly older (P < 0.0001) and had lower values in baseline FEV1 (P < 0.0001) (Table 2). Considering the AHR− population (Table 3), overweight and obese patients were older (P = 0.0003) and had lower values in baseline FEV1 and FVC (P < 0.0001).
3.2. Airway Closure and Obesity
3.2.1. Correlation between FEV1 DRS and FVC DRS
Whether it be in our whole population, AHR+ patients, or AHR− patients, the relationship between FEV1 DRS and FVC DRS was strong, particularly for the obese patients in the entire population, where the variability of FVC accounted for about 90% of the variability of FEV1 (R 2 = 0.90), and the Spearman coefficient was 0.97 (Table 4).
Table 4.
Adjusted R 2 and Spearman coefficients for the relationship between FVC DRS and FEV1 DRS.
| Populations | Adjusted R 2 | Spearman correlation coefficient |
|---|---|---|
| Entire population | ||
| BMI < 25 | 0.8243 | 0.8999 |
| 25 ≤ BMI < 30 | 0.8614 | 0.9320 |
| BMI ≥ 30 | 0.9008 | 0.9700 |
| AHR+ patients | ||
| BMI < 25 | 0.7988 | 0.8332 |
| 25 ≤ BMI < 30 | 0.8590 | 0.9030 |
| BMI ≥ 30 | 0.8220 | 0.9284 |
| AHR− patients | ||
| BMI < 25 | 0.6698 | 0.6778 |
| 25 ≤ BMI < 30 | 0.6862 | 0.8032 |
| BMI ≥ 30 | 0.7724 | 0.8728 |
Data shown are the adjusted R 2 calculated by the linear regression log(FEV1 DRS) = log(FVC DRS) and the Spearman correlation coefficient between the two variables log(FEV1 DRS) and log(FVC DRS), for the three levels of BMI and for our three populations (AHR+ patients, AHR− patients, and total population).
Considering the AHR+ patients, the FVC variability accounted for about 80% of the variability of FEV1, and the Spearman coefficients were between 0.83 (BMI-normal patients) and 0.93 (obese patients).
In the AHR− population, the values were again high, particularly for the obese patients, with an R 2 of 0.77 and a Spearman coefficient of 0.87.
3.2.2. Impact of BMI on the Relationship between FEV1 DRS and FVC DRS Analyzed by ANCOVAs, after Adjusting for Age and Baseline Respiratory Values
Entire Population. The relationship between FVC DRS and FEV1 DRS was significantly different according to BMI, with a lower slope in obese than overweight and normal patients (0.74 (sd: 0.04) versus 0.91 (0.04) and 0.90 (0.05), resp., P = 0.008) (Figure 1, Tables 5 and 6).
Figure 1.
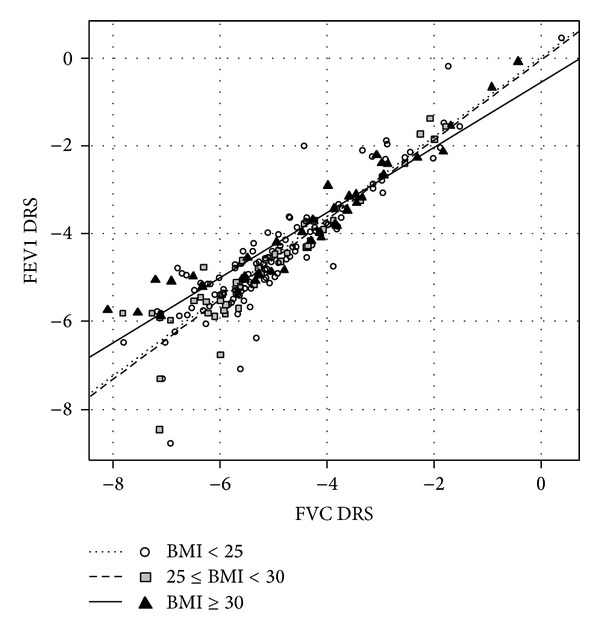
Relationship between FVC dose-response slope and FEV1 dose-response slope, log-transformed, in the entire population, after adjustment for age and baseline respiratory values. Linear regression lines for each level of BMI are shown.
Table 5.
Analyses of covariance for the impact of BMI on the relationship between FVC DRS (independent variable) and FEV1 DRS (predicted variable), adjusted for age and baseline respiratory values.
| Parameter | Entire population | AHR+ | AHR− | ||||||
|---|---|---|---|---|---|---|---|---|---|
| Estimate | Std. error | P value | Estimate | Std. error | P value | Estimate | Std. error | P value | |
| (Intercept) | 0.02 | 0.19 | 0.91 | 0.00 | 0.20 | 0.99 | −1.74 | 0.52 | 0.01 |
| Age | −0.01 | 0.00 | 0.11 | 0.00 | 0.00 | 0.98 | −0.01 | 0.01 | 0.23 |
| Baseline FVC | −0.13 | 0.18 | 0.46 | 0.19 | 0.24 | 0.44 | −0.20 | 0.23 | 0.40 |
| Baseline FEV1 | 0.06 | 0.21 | 0.77 | 0.02 | 0.29 | 0.94 | 0.10 | 0.28 | 0.73 |
| Log(FVC DRS) | 0.91 | 0.04 | <2e −16 | 0.86 | 0.05 | <2e −16 | 0.62 | 0.09 | <2e −16 |
| BMI (overweight) | −0.06 | 0.35 | 0.87 | 0.42 | 0.44 | 0.34 | 0.93 | 0.94 | 0.33 |
| BMI (obese) | −0.57 | 0.30 | 0.06 | 0.11 | 0.33 | 0.74 | −1.64 | 1.06 | 0.12 |
| Log(FVC DRS) ∗ BMI (overweight) | 0.00 | 0.07 | 0.96 | 0.18 | 0.12 | 0.15 | 0.17 | 0.16 | 0.30 |
| Log(FVC DRS) ∗ BMI (obese) | −0.16 | 0.06 | 0.01 | 0.08 | 0.09 | 0.41 | −0.33 | 0.17 | 0.03 |
FEV1: forced expiratory volume in one second; FVC: forced volume capacity; DRS: dose-response slope.
BMI-normal subjects were considered as the control group.
Table 6.
Impact of BMI on the relationship between FVC DRS and FEV1 DRS—slope comparisons.
| BMI < 25 | 25 ≤ BMI < 30 | BMI ≥ 30 | P | |
|---|---|---|---|---|
| Entire population | 0.90 (0.04) | 0.91 (0.05) | 0.74 (0.04)** | 0.0079 |
| AHR+ population | 0.86 (0.06) | 1.04 (0.06) | 0.94 (0.06) | 0.4090 |
| AHR− population | 0.62 (0.09) | 0.78 (0.14) | 0.29 (0.06)* | 0.0283 |
Data shown are slopes (and their standard deviations) calculated by the linear regression log(FEV1 DRS) = log(FVC DRS), adjusted for age and baseline respiratory values, for the three levels of BMI and for the three populations. The P value is calculated by analyses of covariance.
*P < 0.05 versus BMI < 25; **P < 0.01 versus BMI < 25.
AHR+ Patients. No difference was found in the AHR+ population, with slope values of 0.87 (0.06), 1.04 (0.06), and 0.94 (0.06) (P = 0.409) for the BMI-normal, the overweight, and the obese patients, respectively (Figure 2, Tables 5 and 6).
Figure 2.
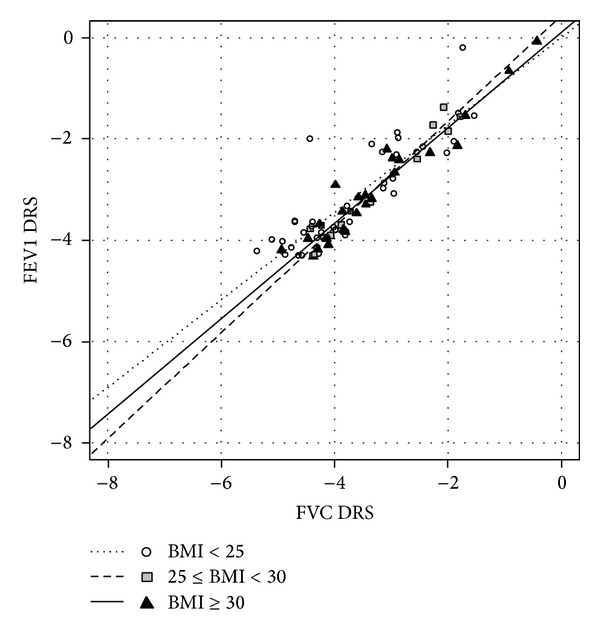
Relationship between FVC dose-response slope and FEV1 dose-response slope, log-transformed, in the AHR+ population, after adjustment for age and baseline respiratory values. Linear regression lines for each level of BMI are shown.
AHR− Patients. The methacholine-negative patients were found to have very different slopes, with a lower slope in obese than overweight and normal patients (0.29 (0.06) versus 0.78 (0.14) and 0.62 (0.09), resp., P = 0.028) (Figure 3, Tables 5 and 6).
Figure 3.
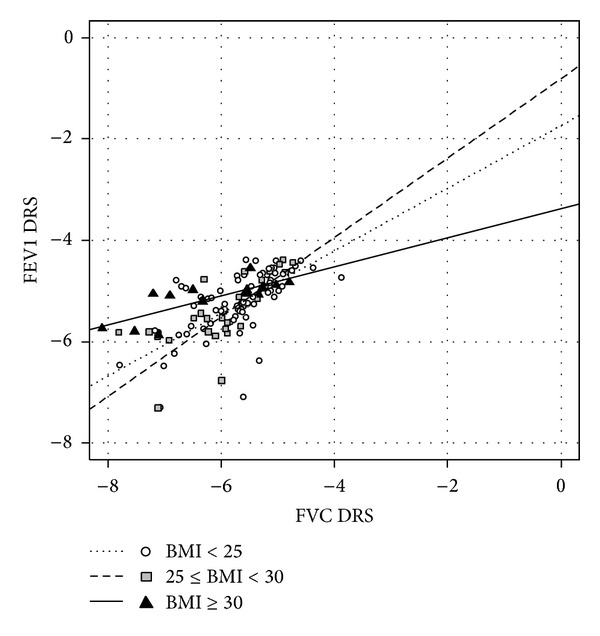
Relationship between FVC dose-response slope and FEV1 dose-response slope, log-transformed, in the AHR− population, after adjustment for age and baseline respiratory values. Linear regression lines for each level of BMI are shown.
4. Discussion
4.1. Main Results
In obese women tested for AHR, we observed increased dose-response slope of FVC plotted against FEV1, in the whole population and in AHR− patients. According to the graphic representations, the regressions, and the analyses of covariance, we observed a greater contribution of FVC fall to the FEV1 fall for obese women.
Our results highlight the importance of obesity on the involvement of distal airways. On the patients with asthma-like symptoms but negative challenge, obesity could increase airway resistance via distal airways [26], thus leading to distal AHR (i.e., FVC fall throughout the methacholine challenge test) but not to proximal one [14]. Indeed, the problem in observing methacholine-positive patients is that focusing on distal airway hyperreactivity is made tricky by the proximal airway hyperreactivity, which “hides” any other part of the airway tree.
Increased closing index and classical improvement at exercise of a certain degree of hypoxia at rest are other reflections of small airway involvement [27]. But to the best of our knowledge, this is the first time that distal impairment in symptomatic but not hyper responsive women is dynamically observed and challenged by nonspecific parasympathomimetics. Whether this phenomenon can be reached by any kind of medication remains a critical issue to address as weaning from inhaled corticosteroids, and bronchodilators remained free of life-threatening event [28].
4.2. Implications for Research and Clinical Relevance
Nitrogen slopes or respiratory CT scan in these patients might be worth investigation to achieve a better understanding of the mechanisms involved in the impact of obesity on distal airways. This could lead to better treatments for wheezing obese patients, who are clearly a complex phenotype. A more specific medication, treating especially distal airways, might be worth investigation in these patients.
Unfortunately, symptoms were not quantified, and lung volumes were not prospectively recorded. But rigorousness of the protocol and methacholine dosage nonetheless allowed us to observe an expected difference.
As in every functional study dedicated to BMI influences, result expression is a critical issue to address, as equations are including the BMI. Changes in percentage of flows and volumes are then highly affected by the pretest values, that is to say that FEV1 fall is easier to observe in the obese with lower starting FEV1 values. Most of our results were clearly influenced by basal values of flows and volumes, and an adjustment was required.
Some authors [15–17] reported that FVC fall during methacholine test was a good indicator of small airway closure. We decided to compute dose-response slopes because it was applicable to nonhyperreactive patients. This allowed us to analyse these data in this particular subpopulation, where the diagnostics are often tricky [28].
Previous studies already suggested that increased abdominal pressure on the diaphragm in the obese can lead to a stronger contribution of airway closure [29, 30]. Even though obesity decreases baseline pulmonary capacity by altering respiratory physiology [31], the contribution of distal airway closure to the change in FEV1 has been shown to be affected by obesity. However, the mechanical hypothesis—loss of elastic recoil—insufficiently accounts for explaining the dynamic and methacholine-sensitive process we reported here. Imbalanced small airway pressure and/or impaired bronchiolar smooth muscle tones associated with a possible mucostasis are hypothesis to specifically address in future studies.
Whether currently available treatment dedicated to small airways may help these patients is rather unknown. Most lines of evidence suggest a negative answer as neither inhaled corticosteroids (ICS) nor long-acting beta agonists tended to improve symptoms, because of their inability to reach the distal area of the lung [32]. On the contrary, newer formulations of ICS, such as hydrofluoroalkane propellants in solution, could have greater access to the distal airways [33, 34], but more studies are necessary to reach a conclusion, as no evidence of airway inflammation is presently shown. Weight loss and exercise training are key management cornerstones, but failure and/or relapse after intermittent therapeutic adherence are frequent.
At a glance, we identified a different level of methacholine-induced bronchoconstriction only at distal airway level of symptomatic nonasthmatic women of a nonestablished cause.
Conflict of Interests
Gregory Marin, Anne Sophie Gamez, Arnaud Bourdin, Djamila Kacimi, Isabelle Vachier, Fabrice Paganin, Pascal Chanez, Muriel Varrin, and Nicolas Molinari have no conflict of interests.
Authors' Contribution
Gregory Marin, Anne-Sophie Gamez, Djamila Kacimi, and Fabrice Paganin helped in collecting clinical data; Arnaud Bourdin, Isabelle Vachier, and Pascal Chanez designed the study; Gregory Marin and Nicolas Molinari finalized statistical analysis; all authors helped in writing and reading the paper.
Acknowledgment
Gregory Marin is supported by CIFRE-ANRT Grant no. 1037/2010.
Abbreviation
- AHR:
Airway hyperresponsiveness
- AHR+:
Hyperreactive patients
- AHR−:
Nonhyperreactive patients
- BMI:
Body mass index
- DRS:
Dose-response slope
- FEV1:
Forced expiratory volume in one second
- FVC:
Forced Vital Capacity
- PC20:
Provocative concentration causing a 20% fall in FEV1.
References
- 1.Beuther DA, Sutherland ER. Overweight, obesity, and incident asthma: a meta-analysis of prospective epidemiologic studies. American Journal of Respiratory and Critical Care Medicine. 2007;175(7):661–666. doi: 10.1164/rccm.200611-1717OC. [DOI] [PMC free article] [PubMed] [Google Scholar]
- 2.Sposato B, Scalese M, Scichilone N, et al. BMI can influence adult males' and females' airway hyperesponsiveness differently. Multidisciplinary Respiratory Medicine. 2012;7(article 45) doi: 10.1186/2049-6958-7-45. [DOI] [PMC free article] [PubMed] [Google Scholar]
- 3.Schachter LM, Salome CM, Peat JK, Woolcock AJ. Obesity is a risk for asthma and wheeze but not airway hyperresponsiveness. Thorax. 2001;56(1):4–8. doi: 10.1136/thorax.56.1.4. [DOI] [PMC free article] [PubMed] [Google Scholar]
- 4.Shore SA. Obesity, airway hyperresponsiveness, and inflammation. Journal of Applied Physiology. 2010;108(3):735–743. doi: 10.1152/japplphysiol.00749.2009. [DOI] [PMC free article] [PubMed] [Google Scholar]
- 5.Saint-Pierre P, Bourdin A, Chanez P, Daures J-P, Godard P. Are overweight asthmatics more difficult to control? Allergy. 2006;61(1):79–84. doi: 10.1111/j.1398-9995.2005.00953.x. [DOI] [PubMed] [Google Scholar]
- 6.Deesomchok A, Fisher T, Webb KA, et al. Effects of obesity on perceptual and mechanical responses to bronchoconstriction in asthma. American Journal of Respiratory and Critical Care Medicine. 2010;181(2):125–133. doi: 10.1164/rccm.200906-0934OC. [DOI] [PubMed] [Google Scholar]
- 7.Bustos P, Amigo H, Oyarzún M, Rona RJ. Is there a causal relation between obesity and asthma? Evidence from Chile. International Journal of Obesity. 2005;29(7):804–809. doi: 10.1038/sj.ijo.0802958. [DOI] [PubMed] [Google Scholar]
- 8.Aaron SD, Fergusson D, Dent R, Chen Y, Vandemheen KL, Dales RE. Effect of weight reduction on respiratory function and airway reactivity in obese women. Chest. 2004;125(6):2046–2052. doi: 10.1378/chest.125.6.2046. [DOI] [PubMed] [Google Scholar]
- 9.Sharma S, Tailor A, Warrington R, Cheang M. Is obesity associated with an increased risk for airway hyperresponsiveness and development of asthma? Allergy, Asthma and Clinical Immunology. 2008;4(2):51–58. doi: 10.1186/1710-1492-4-2-51. [DOI] [PMC free article] [PubMed] [Google Scholar]
- 10.Celedón JC, Palmer LJ, Litonjua AA, et al. Body mass index and asthma in adults in families of subjects with asthma in Anqing, China. American Journal of Respiratory and Critical Care Medicine. 2001;164(10):1835–1840. doi: 10.1164/ajrccm.164.10.2105033. [DOI] [PubMed] [Google Scholar]
- 11.Stenius-Aarniala B, Poussa T, Kvarnström J, Grönlund E-L, Ylikahri M, Mustajoki P. Immediate and long term effects of weight reduction in obese people with asthma: randomised controlled study. British Medical Journal. 2000;320(7238):827–832. doi: 10.1136/bmj.320.7238.827. [DOI] [PMC free article] [PubMed] [Google Scholar]
- 12.Sutherland TJT, Cowan JO, Taylor DR. Dynamic hyperinflation with bronchoconstriction: differences between obese and nonobese women with asthma. American Journal of Respiratory and Critical Care Medicine. 2008;177(9):970–975. doi: 10.1164/rccm.200711-1738OC. [DOI] [PubMed] [Google Scholar]
- 13.Parambil JG, Yi ES, Ryu JH. Obstructive bronchiolar disease identified by CT in the non-transplant population: analysis of 29 consecutive cases. Respirology. 2009;14(3):443–448. doi: 10.1111/j.1440-1843.2008.01445.x. [DOI] [PubMed] [Google Scholar]
- 14.Chapman DG, Berend N, King GG, Salome CM. Increased airway closure is a determinant of airway hyperresponsiveness. European Respiratory Journal. 2008;32(6):1563–1569. doi: 10.1183/09031936.00114007. [DOI] [PubMed] [Google Scholar]
- 15.Yoo Y, Yu J, Lee SH, et al. Comparison of ΔFVC (% decrease in FVC at the PC20) between cough-variant asthma and classic asthma. Journal of Asthma. 2007;44(1):35–38. doi: 10.1080/02770900601034379. [DOI] [PubMed] [Google Scholar]
- 16.Gibbons WJ, Sharma A, Lougheed D, Macklem PT. Detection of excessive bronchoconstriction in asthma. American Journal of Respiratory and Critical Care Medicine. 1996;153(2):582–589. doi: 10.1164/ajrccm.153.2.8564102. [DOI] [PubMed] [Google Scholar]
- 17.Yoo Y, Yu J, Kim DK, Koh YY. Percentage fall in FVC at the provocative concentration of methacholine causing a 20% fall in FEV1 in symptomatic asthma and clinical remission during adolescence. Chest. 2006;129(2):272–277. doi: 10.1378/chest.129.2.272. [DOI] [PubMed] [Google Scholar]
- 18.Torchio R, Gobbi A, Gulotta C, et al. Mechanical effects of obesity on airway responsiveness in otherwise healthy humans. Journal of Applied Physiology. 2009;107(2):408–416. doi: 10.1152/japplphysiol.00083.2009. [DOI] [PubMed] [Google Scholar]
- 19.Gilliland FD, Berhane K, Islam T, et al. Obesity and the risk of newly diagnosed asthma in school-age children. American Journal of Epidemiology. 2003;158(5):406–415. doi: 10.1093/aje/kwg175. [DOI] [PubMed] [Google Scholar]
- 20.Litonjua AA, Sparrow D, Celedon JC, DeMolles D, Weiss ST. Association of body mass index with the development of methacholine airway hyperresponsiveness in men: the Normative Aging Study. Thorax. 2002;57(7):581–585. doi: 10.1136/thorax.57.7.581. [DOI] [PMC free article] [PubMed] [Google Scholar]
- 21.Chen Y, Dales R, Tang M, Krewski D. Obesity may increase the incidence of asthma in women but not in men: longitudinal observations from the Canadian National Population Health Surveys. American Journal of Epidemiology. 2002;155(3):191–197. doi: 10.1093/aje/155.3.191. [DOI] [PubMed] [Google Scholar]
- 22.Jarvis D, Chinn S, Potts J, Burney P. Association of body mass index with respiratory symptoms and atopy: results from the European Community Respiratory Health Survey. Clinical and Experimental Allergy. 2002;32(6):831–837. doi: 10.1046/j.1365-2222.2002.01380.x. [DOI] [PubMed] [Google Scholar]
- 23.American Thoracic Society. Guidelines for methacholine and exercise challenge testing-1999. American Journal of Respiratory and Critical Care Medicine. 2000;161(1):309–329. doi: 10.1164/ajrccm.161.1.ats11-99. [DOI] [PubMed] [Google Scholar]
- 24. GINA, 2012, http://ginasthma.org/
- 25.Torrance GM, Hooper MD, Reeder BA. Trends in overweight and obesity among adults in Canada (1970–1992): evidence from national surveys using measured height and weight. International Journal of Obesity. 2002;26(6):797–804. doi: 10.1038/sj.ijo.0801991. [DOI] [PubMed] [Google Scholar]
- 26.Collins LC, Hoberty PD, Walker JF, Fletcher EC, Peiris AN. The effect of body fat distribution on pulmonary function tests. Chest. 1995;107(5):1298–1302. doi: 10.1378/chest.107.5.1298. [DOI] [PubMed] [Google Scholar]
- 27.Martin RJ. Therapeutic significance of distal airway inflammation in asthma. Journal of Allergy and Clinical Immunology. 2002;109(2, supplement):S447–S460. doi: 10.1067/mai.2002.121409. [DOI] [PubMed] [Google Scholar]
- 28.Aaron SD, Vandemheen KL, Boulet L-P, et al. Overdiagnosis of asthma in obese and nonobese adults. CMAJ. 2008;179(11):1121–1131. doi: 10.1503/cmaj.081332. [DOI] [PMC free article] [PubMed] [Google Scholar]
- 29.Sugerman HJ, DeMaria EJ, Felton WL, III, Nakatsuka M, Sismanis A. Increased intra-abdominal pressure and cardiac filling pressures in obesity-associated pseudotumor cerebri. Neurology. 1997;49(2):507–511. doi: 10.1212/wnl.49.2.507. [DOI] [PubMed] [Google Scholar]
- 30.Salome CM, King GG, Berend N. Physiology of obesity and effects on lung function. Journal of Applied Physiology. 2010;108(1):206–211. doi: 10.1152/japplphysiol.00694.2009. [DOI] [PubMed] [Google Scholar]
- 31.Parameswaran K, Todd DC, Soth M. Altered respiratory physiology in obesity. Canadian Respiratory Journal. 2006;13(4):203–210. doi: 10.1155/2006/834786. [DOI] [PMC free article] [PubMed] [Google Scholar]
- 32.Spangler DL. The role of inhaled corticosteroids in asthma treatment: a health economic perspective. The American Journal of Managed Care. 2012;18(2, supplement):S35–S39. [PubMed] [Google Scholar]
- 33.Kraft M. Part III: location of asthma inflammation and the distal airways: clinical inplications. Current Medical Research and Opinion. 2007;23(supplement 3):S21–S27. doi: 10.1185/030079907X226177. [DOI] [PubMed] [Google Scholar]
- 34.Zeidler M, Corren J. Hydrofluoroalkane formulations of inhaled corticosteroids for the treatment of asthma. Treatments in Respiratory Medicine. 2004;3(1):35–44. doi: 10.2165/00151829-200403010-00005. [DOI] [PubMed] [Google Scholar]