

Abstract
Photoacoustic imaging (PA) is continuing to be applied for physiological imaging and more recently for molecular imaging of living subjects. Owing to its high spatial resolution in deep tissues, PA imaging holds great potential for biomedical applications and molecular diagnostics. There is however a lack of probes for targeted PA imaging, especially in the area of enzyme-activatable probes. Here we introduce a molecular probe, which upon proteolytic processing is retained at the site of enzyme activity and provides PA contrast. The probe oligomerizes via a condensation reaction and accumulates in cells and tumors that express the protease. We demonstrate that this probe reports furin and furin-like activity in cells and tumor models by generating a significantly higher photoacoustic signal relative to furin-deficient and non-target controls. This probe could report enzyme activity in living subjects at depths significantly greater than fluorescence imaging probes and has potential for molecular imaging in deep tumors.
1. INTRODUCTION
Proteases, enzymes that catalyse the hydrolytic cleavage of peptide bonds, participate in a variety of critical biological processes in both physiological and pathological states. In particular, proteases enable cancer cells to adapt to the topology of the primary and secondary sites and efficiently alter their microenvironment.1 Proteases are essential for degrading extracellular proteins and activating cofactors to promote cell migration and invasiveness.2 Because of their involvement in progression of highly metastatic cancers, proteases became important targets for therapeutic interventions and there has been a high interest in developing molecular probes that enable imaging of protease activity in living subjects.3
Owing to the high variety of photochemical mechanisms such as Förster resonance energy transfer (FRET), photoinduced electron transfer and quenching, enzyme-activatable probes (EAPs) have been successfully developed for fluorescence imaging of numerous proteases3,4. However, these probes have major limitations particularly when imaging in living subjects is required. For example some of these fluorescence-based EAPs have low specificity, inhibit the target protease interfering with the normal function, fail to accumulate at the target site making it very difficult to validate the target protease, or have low sensitivity because they lack signal amplification.4 Most importantly, the fluorescence EAPs are limited to imaging superficial depths (up to 1 mm) in living subjects because of the high tissue autofluorescence and strong scattering of fluorescence light inside deep biological tissue. While fluorescence microscopy can provide micron scale resolution at superficial depths of up to 1 mm, fluorescence optical tomography, can image several centimeters deep inside biological tissue but provides very poor spatial resolution (typically about 1/3rd of imaging depth). Therefore fluorescence based EAPs are not an ideal choice for probing tumor environment. Protease sensitive bioluminogenic substrates5,6 can detect protease activity in cells and tumors that constitutively express the luciferase reporter gene and offer higher sensitivity because autofluorescence and tissue attenuation associated with fluorophore excitation are absent. Bioluminescence imaging, similar to fluorescence imaging, also suffers from strong scattering of light from deep tissue, rendering bioluminescence strategies not suitable for clinical translation.
A distinctive strategy for protease activity imaging aims to provide increased sensitivity and ease of target validation in deep tissue using non-ionizing imaging methods. We propose a photoacoustic (PA) imaging based enzyme-sensitive probe. PA imaging, a synergistic combination of optical and ultrasound imaging technologies, has advanced into a noninvasive real-time modality for preclinical biomedical imaging.7–10 PA imaging can provide high spatial resolution even at several centimeters deep inside biological tissue (typically 1/10th of the imaging depth).7,11 Endogenous tissue contrast can provide the means for both anatomical and molecular PA imaging applications. However, for discriminating between pathological and normal states using PA imaging, exogenous contrast agents are often required. A variety of probes that can increase the endogenous PA signal of disease states such as cancer through passive or direct targeting have been developed.12 However, there is a scarcity of molecular probes for targeted PA imaging, especially in the area of enzyme-sensitive probes. The classic OFF/ON schemes of EAPs for fluorescence imaging are not directly translatable to PA imaging. Elaborated activatable probe designs for dual-wavelength PA imaging have been recently developed and their applicability was demonstrated in cells in culture13 and in vivo.14 Liang et al., employed a bioorthogonal intracellular condensation reaction that leads to formation of nanostructures retained at the site of target activity, and allows for fluorescence imaging of furin activity in live cells.15 Furin is one of the central regulators of tumor progression and metastasis and a proven drug target in vitro16 and in vivo,17 and the ability to non-invasively visualize furin and furin-like activity in small animals is of high interest. The condensation reaction takes place in live cells between 2-cyano-6-aminobenzothiazole (CABT) and thiol and amino groups of a cysteine, which become accessible after proteolytic activity of furin. The probe carries the reactive groups and a reporter molecule (fluorescein) coupled to the furin substrate RVRR (where R is arginine and V is valine).
Here, to enable deep tissue PA imaging we redesign this protease activity sensing platform. We introduce a PA probe, which reports proteolytic activity via a bioorthogonal condensation reaction followed by formation of aggregates and nanostructures, which accumulate at target site. We demonstrate that the oligomerizable probe produces significantly higher photoacoustic signal in cells and in mice tumors overexpressing furin (MDA-MB-231) than in furin-deficient controls (LoVo). This is the first example of a PA-based probe for directly imaging enzyme activity in living subjects and has potential for highly specific early detection of cancers expressing furin in vivo.
2. EXPERIMENTAL DETAILS
Reagents
All reagents and solvents were purchased from Sigma-Aldrich with the exception of: Boc-Lys(Fmoc)-OH (AnaSpec, Fremont, CA), Boc-Cys(SEt)-COOH·DCHA (Bachem, Torrance, CA), 2-cyano-6-amino-benzothiazole (ICIS, China), and Atto740-NHS ester (Atto-Tec GmbH, Siegen, Germany). Furin was purchased from Biolabs (2,000 U ml−1); one unit (U) is defined as the amount of furin that releases 1 pmol of methylcoumarinamide (MCA) from the fluorogenic peptide Boc-RVRR-MCA (Bachem) in one minute at 30 °C).
ESOR-PA probe synthesis
The ESOR-PA probes were synthesized similarly to the previously described protocol15 and characterized by MALDI-TOF mass spectrometry (Supplementary Fig. S3 and S4) Detailed description for each synthetic step is given in supplementary information (Supplementary Methods). HPLC was performed on a Dionex HPLC System (Dionex Corporation) equipped with a GP50 gradient pump and an inline diode array UV-Vis detector. A reversed-phase C18 (Phenomenax, 5 μm, 10 × 250 mm or Dionex, 5 μm, 4.6 × 250 mm) column was used with an acetonitrile (B) / H2O (A) gradient mobile phase containing 0.1% trifluoroacetic acid at a flow of 1 mL/min for the analysis.
Fluorescence spectrometry
Fluorescence spectra were recorded using a FluoroMax-3 (Horiba Jobin Yvon) spectrofluorometer. The signals were recorded three hours after incubating 2 μM probe solutions in furin (100 pmol·U−1) buffer (100 mM HEPES, 1 mM CaCl2, pH 7.5) containing tris(2-carboxyethyl) phosphine (TCEP, 1 mM) at 37 °C.
Transmission electron microscopy
TEM samples were prepared by drying 5 μL of 0.3 mM ESOR-PA01 solution on carbon coated 600 mesh copper grid 3 hours after incubation with furin (100 pmol·U−1) buffer (pH 7.5) containing TCEP at 37 °C. The samples were imaged on a FEI Tecnai G2 F20 X-TWIN Transmission Electron Microscope at 200kV accelerating voltage.
Photoacoustic imaging
In vitro and cell experiments
The PA instrument used for in vitro cell culture experiment was described in a previous study.13,18 A tunable pulsed laser with a repetition rate of 10 Hz and a pulse width of 5 ns (Nd:YAG Surelight-III-10 connected to Surelite OPO Plus, Continuum) was focused on to the phantom sample using a fiber optic focused ring light guide (Fiberoptic Systems Inc, 1 inch working distance, 1 cm focal spot diameter). The average laser light intensity at 740 nm wavelength was measured to be ~15 mJ/cm2 on the sample surface. A 5 MHz focused transducer (A309S, 25.5 mm focal length, F#2.0, Panametrics) was placed (without intercepting the light path) inside the fiber optic ring light guide to perform PA imaging in reflection mode. A precision xyz-stage (U500, Aerotech Inc.) with minimum step size of 0.5 mm was used to move the transducer and the fiber ring along a planar 2D trajectory. At every position, the acquired photoacoustic signal (A-scan, signal as a function of depth along z-axis) was averaged over 3 laser pulses. The intensity of the laser pulses as a function of time was recorded using a silicon photodiode (DET10A, Thorlabs). This information was used to synchronize the acquisition and compensate for pulse-to-pulse variations in laser intensity. The analog PA signals (A-scans) were amplified using a preamplifier (Panametrics, PR5072) and digitized using a digitizer/oscilloscope NI 5114. The A-scan from each position of the transducer was band pass filtered with 100% fractional bandwidth, compensated for laser intensity variation and envelope detected. 2-D images (B-scans) were obtained by scanning the sample along the x direction and acquiring each corresponding 1-D image (A-scan). After each B-scan along the x axis, using the xyz-stage the transducer/light head was returned to its original x coordinate and further translated by one scanning step by 0.5 mm along the y axis to start a new B scan. Thus several B-scans were obtained by raster scanning the sample in the x-y plane. All B-scans were combined to reconstruct a 3D volumetric image of the phantom sample. We further performed maximum amplitude projection (MAP) on each of the A-lines in the 3D volumetric data. The final MAP image was obtained by combining projections from all B-scans.
Furin-like activity photoacoustic imaging in vitro
2 μM of ESOR-PA01 and ESOR-PA02 probes were incubated at 37 °C for 3 h in the presence and in the absence of furin (100 pmol·U−1) in furin buffer (pH 7.5) containing TCEP at 37 °C. The solutions were loaded into transparent polyethylene tubes and the tubes were sealed using heat. The filled tubes were fixed in 1% agarose solution in PBS and the gel was subsequently imaged as described above.
Furin-like activity photoacoustic imaging in cells
MDA-MB-231 cells were cultured in DMEM (high glucose) supplemented with 10% FBS and 1% penicillin/streptomycin. LoVo cells were grown in F12 nutrient mixture supplemented with 10% FBS and 1% penicillin/streptomycin. MDA-MD-231 and LoVo cells (plated at high density, 8 million cells in a 10-cm dish) were incubated for 17 h at 37 °C with 5 μM ESOR-PA01 probe. To mimic closer an in vivo situation, we performed the same experiments at shorter incubation time (3h) and lower concentration. For the short time incubation protocol, the cells were incubated for 3 h at 37 °C with 2 μM ESOR-PA01 probe. Subsequently, cells were washed 3× with 10 mL PBS and then 1 h at 37 °C in 10 mL media. Cells were harvested using trypsin and counted. Equal amounts of cells in PBS (2.5 million for the long incubation and 7.5 million cells for short incubation study, respectively) mixed 1:1 with 1% ultra-pure agarose (melting point 65 °C) in PBS, were added to agarose gel wells made in advance. Afterwards the wells were covered with an additional layer of warm (60 °C) agarose, cooled at room temperature and scanned using a PA instrument with 740 nm laser excitation, as described above.
For the experiment where furin inhibitor was required, a short incubation protocol was used and equal moles of Furin Inhibitor I and II (EMD Biosciences) were added to a final concentration of 200 μM each in addition to the furin positive probe. Cells were harvested and loaded on the agarose gel phantom as describe above.
In vivo photoacoustic imaging
For all mice experiments we used a commercial Endra Nexus128 PA tomography system (Endra Inc., Ann Arbor, Michigan).19 The system houses a tunable nanosecond pulsed laser (7 ns pulses, 20 Hz pulse repetition frequency, about 7 mJ/pulse on the animal surface, wavelength range 680 nm to 950 nm), 128 unfocused ultrasound transducers (with 5 MHz center frequency and 3 mm diameter) arranged in a hemi-spherical bowl filled with water, animal tray on top of the bowl, data acquisition/reconstruction console, servo motors for three dimensional rotation of the bowl, and a temperature monitor of water bath. We optimized the imaging protocol to suit our probe experiments using 120 views and 100 pulses/view, covering 25 mm × 25 mm × 25 mm volume with a voxel size of 250 μm in x, y and z directions. This takes approximately 11 min to acquire one data set. For each animal we first obtained pre-contrast data at 740 nm. After i.v. administration of the furin probe, we acquired post-contrast data every 15 min up to 1 h at 740 nm scan wavelength. Three-dimensional PA image was reconstructed off-line using data acquired from all 128 transducers at each view using a back-projection algorithm.19 The algorithm corrects for pulse to pulse variations in the laser intensity and small changes in the temperature that affect acoustic velocity in the water. The reconstructed raw data is analyzed using AMIDE 0.9.2 software.20
Furin-like activity photoacoustic imaging in mice
All animal handling was performed in accordance with Stanford University’s Animal Research Committee guidelines. Female nude mice (Nu/Nu, Charles River Laboratories, Wilmington, MA) were implanted subcutaneously on the upper thigh with 10 million cells of either MDA-MB-231 or LoVo and tumors developed within 3–4 weeks. Mice were used for imaging when the tumors were 0.8–10 mm in diameter. Mice were anesthetized using 2% isoflurane in oxygen and a catheter was applied to the tail vein. Afterwards, they were placed in the ENDRA Nexus128 PAT imaging system and scanned to determine the endogenous signal of tumors at 740 nm wavelength. When the pre-scan was completed (11 min acquisition time), the mice were injected via the tail vein catheter with 25 nmol of ESOR-PA01 probe (or furin negative ESOR-PA02) further diluted from DMSO stock soutions (5.1 mM and 4.7 mM, respectively) in sterile 150 μL of PBS (167 mM, 25 nmoles). Mice were scanned every 15 min for 1 h. We imaged three groups of mice. The first group (n=4) included mice bearing furin-deficient LoVo tumors and was subjected to the furin positive probe ESOR-PA01; the second group (n=4) consisted of mice with MDA-MB-231 tumors and they were injected with furin positive probe ESOR-PA01; the third group of mice (n=4), used as a second negative control, contained mice with MDA-MB-231 tumors injected with furin-negative probe ESOR-PA02. All three groups of mice were handled identically. The raw 3D-data sets were reconstructed using reconstruction algorithm available on ENDRA Nexus 128.19 Topographic images were visualized and quantified in AMIDE 0.9.2 software20. The normalization was done by using the mean of the 3D-data from t=0 point to normalize the 3D-data of other time points.
Furin-like activity detection using fluorogenic probe in cell lysates
Furin-like activity was measured using Boc-RVRR-AMC, where AMC is 7-amino-4-methyl-coumarin (Bachem). Cultured cells were lysed directly in a 10-cm dish on ice using 500 μL passive lysis buffer (Promega, Madison, WI). The protein concentration was measured using the 660 nm Protein Assay (Thermo Scientific) following the manufacturer’s instructions. 10 μg of total protein where mixed with 10 μM total concentration of Boc-RVRR-AMC in DPBS buffer containing Mg2+ and Ca2+. The fluorescence of released aminocoumarin was then measured on a micro-plate reader (Ex./Em. = 360 nm/460 nm) every 5 min for 2 h.
Statistical analysis
All cell culture and mice group comparisons were performed using the Student’s t test (two-sided, paired).
3. RESULTS
Design of enzyme sensitive oligomerizable reactive photoacoustic (ESOR-PA) probes
The design of the ESOR-PA probes is based on a recently developed strategy, which leads to the formation of oligomeric nanostructures inside cells upon enzymatic processing by furin15.
The furin probe ESOR-PA01 consists of a short peptide furin substrate, RVRR, linked to two pro-reactive moieties, a side-protected cysteine and 2-cyano-6-aminobenzothiazole (CABT), and a near-infrared (NIR) absorber, the fluorescent dye Atto740 (fluorescence quantum yield ϕfl=10%), on a lysine side chain, Ac-RVRRC(SEt)K(Atto740)-CABT, (Scheme 1, R-arginine, V-valine, C-cysteine, K-lysine, SEt-ethylthio group). Atto740 fluorophore was chosen because of its near-infrared (NIR) absorbance and exceptional resistance to photobleaching. As control probe, we have designed and synthesized ESOR-PA02, a probe containing a non-furin substrate peptide RRRV (furin negative probe: Ac-RRRVC(SEt)K(Atto740)-CABT, Scheme 1).
Scheme 1. Chemical structures of photoacoustic activatable furin probe ESOR-PA01 and of the negative control non-cleavable probe ESOR-PA02.
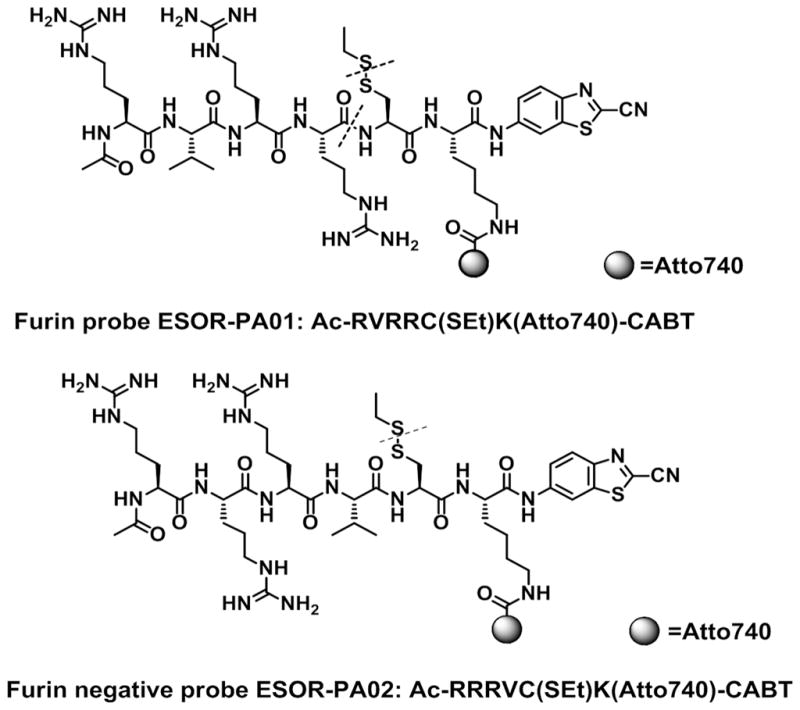
After cellular uptake of the probe the disulfide bond of SEt-protected cysteine is cleaved in the reductive environment of the cells and furin processes the peptide by cleaving RVRR sequence at the C-terminus. Dotted lines indicate cleavage sites; Ac-acetyl group, R-arginine, V-valine, C-cysteine, K-lysine, SEt-ethylthio group.
The mechanism of action of the activatable ESOR-PA probe to generate photoacoustic contrast is depicted in Figure 1. First, following cellular uptake the disulfide bond of cysteine is cleaved in the reductive environment of the cell. Next, furin processes the peptide, cleaving RVRR sequence and releasing the amino group of cysteine. The 1,2-aminothiol group undergoes a bioorthogonal condensation reaction with the 2-cyano group of CABT to form dimers and longer oligomers. These oligomers containing Atto740 reporter molecule accumulate in cells and further aggregate and form nanostructures, events accompanied by a proximity quenching effect of the fluorophores, which further increases the photoacoustic signal by minimizing radiative emission. This accumulation of dyes in the cells is detected as a strong PA signal upon excitation with laser pulses.
Figure 1. Diagram depicting the mechanism of action of the ESOR-PA furin probe and generation of photoacoustic contrast.

After cellular internalization the probe is processed by furin. The 1,2-thioamino group of cysteine are activated and further react with the CABT component to form a condensation product. Several condensation reactions lead to formation of Atto740-containing oligomers, which further aggregate and form nanostructures, trapping the reporter molecule in the cells. After pulsed laser excitation a PA signal can be measured.
Photoacoustic imaging of furin-like activity in vitro
First, both probes ESOR-PA01 and the negative control ESOR-PA02 were characterized in vitro using fluorescence spectrometry and PA imaging. The probes (2 μM) were incubated in the presence and in the absence of furin under reductive conditions, for 3 h at 37 °C and the fluorescence signal was measured (Figure 2a, c).
Figure 2. In vitro characterization of ESOR-PA probes.

(a) Fluorescence spectrometry of ESOR-PA01 and ESOR-PA02 probes incubated in the presence and absence of furin. The signals were recorded 3 h after incubating 2 μM probe solutions in furin (100 pmol·U−1) buffer (pH 7.5) containing TCEP at 37 °C. (b) Photoacoustic imaging of the same solutions used for fluorescence spectrometry. (c) Quantitation of the integrated fluorescence and PA signals measured for ESOR-PA01 and ESOR-PA02 probes incubated in the presence and absence of furin. **P<0.01, n.s. P>0.05 (FL: n=3, P=0.007, P=0.174; PA: n=4, P=7.24×10⁻⁶, P=0.11), error bars, SD. (d) Representative transmission electron microscopy image of ESOR-PA01 assembled nanoparticle products 3 h after incubation with furin. TEM samples were prepared by drying 5 μL of 0.3 mM ESOR-PA01 solution on carbon coated 600 mesh copper grid. The samples were imaged using a transmission electron microscope at 200 kV accelerating voltage.
We noticed a significant drop (6-fold) in fluorescence after 3 h for the furin-positive probe ESOR-PA01 incubated with furin, relative with no furin added, in accordance with fluorophore self-quenching mechanism after furin cleavage and oligomerization. For the negative control probe ESOR-PA02, no significant decrease in fluorescence signal was detected in the absence compared with the presence of furin. The same solutions were loaded in polyethylene tubes, fixed in agar and used for PA imaging (Figure 2b). An inverse trend was obtained: the ESOR-PA01 probe showed a significant increase in PA signal (4-fold) in the presence of furin relative to that in the absence of the enzyme (Figure 2c). On the other hand, for the negative control ESOR-PA02 probe similar levels of PA signal were detected in the absence and in the presence of furin (Figure 2c). Again, this is in agreement with the probe activation mechanism by furin. To confirm the formation of nanoparticle after furin cleavage, we performed transmission electron microscopy (TEM) for ESOR-PA01 probe (Figure 2d). Nanoparticles of 130 ± 45 nm (average size ± SD, 80 nanoparticles analyzed) were formed in the presence of furin. However no precipitate was formed, indicating high water solubility of the oligomers.
Photoacoustic imaging of furin-like activity in cells
To demonstrate the efficacy of the ESOR-PA probe for imaging of furin and furin-like activity, we first tested the probe in live cells. Furin-overexpressing breast adenocarcinoma MDA-MB-231 cells and furin-deficient colorectal adenocarcinoma LoVo cells were incubated with 5 μM furin positive probe ESOR-PA01 for 17 h in normal culturing conditions. Subsequently, the cells were washed, harvested and placed in wells in 1% agarose gel phantom. PA imaging of the phantom (Figure 3a) revealed that the furin positive probe ESOR-PA01, when incubated with MDA-MB-231 cells, produces 2.6-fold higher PA signal than when incubated with furin deficient LoVo cell (Figure 3b). Additionally, a shorter probe incubation time (3 h, 2 μM ESOR-PA01) experiment was performed, using a further control, addition of furin inhibitors. This prevented the increase in PA signal, which was 2.2-fold lower than in MDA-MB-231 cells incubated with furin probe ESOR-PA01 in the absence of furin inhibitor (Figure 3c, d).
Figure 3. Photoacoustic imaging of furin-like activity in cells.

(a) LoVo and MDA-MB-231 cells were incubated with 5 μM solution of furin probe ESOR-PA01 in DMEM for 17 h; cells were washed, harvested and equal number of cells (2.5 milion) was added to 1% agarose gel wells and embedded into the agarose gel phantom. The phantom was imaged using a PA system with 740 nm excitation pulse laser. (b) Average PA signal quantified from the phantom imaging; n=4 (4 independent experiments of 2 or 3 wells each), **P = 2.58×10⁻⁴, error bars, SD. (c) LoVo and MDA-MB-231 cells (with and without 200 μM Furin inhibitor I and Furin inhibitor II) were incubated with 2 μM solution of furin probe ESOR-PA01 in DMEM for 3 h; cells were washed, harvested and equal number of cells (7.5 milion) was added to agarose gel wells and embedded into the agarose gel phantom. (d) Average PA signal quantified from the phantom imaging; (n=6, **P=5.24×10⁻⁴ and P=5.74×10⁻³, statistical significances calculated relative to MDA-MB-231, error bars, SD). (e) Evaluation of total furin-like activity in cells lysates using a fluorogenic Boc-RVRR-AMC probe. Cells were lysed on ice and then 10 μg total protein were added in a 96-well plate and incubated with 10 μM Boc-RVRR-AMC. Fluorescence of released aminocoumarin was measured every 5 min for 2 h on a micro-plate reader (Ex./Em. = 360 nm/460 nm);
To further confirm that the difference in PA signal is indicative of the furin-like activity in these cells, we used a fluorogenic substrate Boc-RVRR-AMC, which releases the fluorophore aminocoumarin after furin processing. MDA-MB-231 total cell lysate showed 3.1-fold higher level of total furin-like activity than LoVo cells (Figure 3e). This is in agreement with the detection of furin-like activity using our furin PA probe ESOR-PA01.
Photoacoustic imaging of furin-like activity in tumor bearing mice
We performed PA imaging experiments in living mice to investigate the potential of the developed oligomerizable PA probe in living subjects. We subcutaneously implanted MDA-MB-231 (furin-overexpressing) and LoVo (furin-deficient) cells, respectively, in the upper thigh region of the left leg in nude female mice. 3–4 weeks after implantation, the tumors developed to 8–10 mm in diameter and the mice were used for PA imaging. The first group (n=4), which included mice bearing furin-deficient LoVo tumors, was subjected to the furin positive probe ESOR-PA01 (25 nmol in 150 μL PBS, delivered by tail vein) followed by PA imaging. The anesthetized mice were positioned in the instrument with the tumor placed in the field of view. The experimental setup is shown in Figure 4a. The second group (n=4) consisted of mice with MDA-MB-231 tumors and they were tail-vein injected with the furin probe ESOR-PA01 (25 nmol) and imaged in identical conditions. The third group of mice (n=4), used as a second negative control, contained MDA-MB-231 tumors and it was subjected to the furin-negative probe ESOR-PA02 (25 nmol, delivered by tail vein) and imaged in a similar manner to the previous groups. All the data sets were normalized to t=0 min (PA signal obtained from the tumors before probe injection). For the first group of mice (LoVo tumors and furin positive probe), volumetric region of interest quantification of the PA signal in the tumors showed a very minimal increase in the PA signal at all time points post probe injection as compared to pre-injection. The peak was at 15 min post-injection (1.6-fold on average) and gradually decreased to the initial endogenous level after 60 min (Figure 4b). In contrast, for the second group of mice carrying MDA-MB-231 furin overexpressing tumors and injected with furin probe, a significant increase (P=0.01) in the PA signal (2.3-fold at 60 min) was detected at all time points post probe injection (Figure 4c), indicating that furin processing causes the probe to accumulate in the tumor maintaining relatively constant PA signals during the entire course of imaging.
Figure 4. Photoacoustic imaging of furin-like activity in tumor-bearing mice.

(a) Photographic image of a mouse placed in a positioning device for PA imaging; the subcutaneous tumor is positioned in the dimple. The dotted yellow line corresponds to the upper part of the tumor images shown in (d). (b) and (c) Variation of the PA signal with time after injection of 25 nmoles furin probe ESOR-PA01 via tail vein in either mice carrying LoVo (furin negative) (b) or MDA-MB-231 (furin positive) tumors (c). PA signal was normalized to t=0 min pre-injection time point; n=4, error bars, SD. (d) Representative PA images (maximum amplitude projections) of mice tumors visualized in Amide software, acquired for 11 min at t=0 min (pre-injection) and t=60 min after furin probe injection. (e) Increase of the photoacoustic signal quantified from 3D volumetric data of mice tumors, either from furin probe ESOR-PA01 injection in mice carrying LoVo (n=4) and MDA-MB-231 (n=4) tumors, or furin negative probe ESOR-PA02 in mice carrying MDA-MB-231 tumors (n=4). The data represent the PA signal increase at t=60 min post-probe-injection relative to the pre-probe-injection signal (t=0); **P=0.01, *P=0.03, n.s. P=0.08; error bars, SD.
For the third group, mice carrying MDA-MB-231 tumors injected with furin-negative probe ESOR-PA02, very low levels of PA signal were detected, similar to the first negative control LoVo group (Figure S1). Representative PA images of the tumors for LoVo and MDA-MD-231 groups of mice are shown in Figure 4d (also see Supplementary Movies M1–4). Furthermore, we quantified the overall PA signal increase for all groups (Figure 4e). The PA signal increase generated by the furin probe (at 60 minutes after probe injection) is 7.1-fold higher in furin positive MDA-MB-231 tumors than in furin-deficient LoVo tumors (n=4, P=0.01) and 2.7-fold higher than for MDA-MB-231 tumors exposed to the negative control probe (n=4, P=0.03). No significant difference was observed for the PA signal increase of the LoVo group subjected to positive furin probe ESOR-PA01 and the MDA-MB-231 group subjected to furin negative probe ESOR-PA02 (n=4, P=0.08). Furthermore, the total furin-like activity of the subcutaneous mice tumors was assessed ex-vivo by using a fluorogenic substrate and found to be 3-fold higher than that of LoVo tumors (Figure S2). These data support that the PA oligomerizable probe can be successfully used to detect quantitative differences in furin activity in vivo by PA imaging, indicating its great potential for deep tissue imaging and potential clinical translation.
Further, we carried out experiments to investigate the stability of our probe to blood protease. We incubated the ESOR-PA01 probe in 500 μL blood collected from mice bearing 10 mm in diameter MDA-MB-231 tumors to a final concentration of 6 μM. We assessed the stability of the probe by HPLC and MALDI-TOF MS found no cleavage products (Figure S5 and S6).
4. DISCUSSION
Molecular probes are in increasing demand for visualizing signature biomolecules and bioprocesses of cancer because they provide detection of endogenous molecular target levels/activity and hold great promise for clinical translation. The development of activatable molecular probes for protease activity assessment in living subjects is of particular interest as proteases play key roles in cancer progression and metastasis.
Several protease sensitive activatable probes have been successfully developed for fluorescence imaging. Fluorescence imaging, however, has significant limitations when imaging deep tissue, because of strong scattering of light photons and high tissue autofluorescence background. To address this challenge, we design an enzyme sensitive oligomerizable reactive photoacoustic (ESOR-PA) probe for furin activity detection in living mice. Furin is the central and best characterized member21 of a family of pro-protein convertases (PCs),22 and catalyzes the C-terminal cleavage of the RXXR↓ peptide sequences (where R is arginine and X is any amino acid). A correlation between higher levels of furin and the metastatic potentials of tumors has been already demonstrated.23,24 It has been previously shown that this type of furin oligomerizable probes are readily taken up by cells, probably because they are arginine-rich, and that the furin-triggered oligomerization reaction takes place inside the cells mainly in Golgi bodies where furin is located.15,25 The reactive groups are 2-cyano-6-aminobenzothiazole (CABT) and thiol and amino groups of a cysteine, which become accessible after proteolytic activity of furin. To investigate the potential of these oligomerizable probes for reporting protease activity using photoacoustic imaging, we synthesized a ESOR-PA probe consisting of a short peptide furin substrate, RVRR, linked to the two pro-reactive moieties, and a NIR absorber PA reporter molecule, Atto740. This design extends the application of the protease activity triggered oligomerization imaging platform to imaging of protease activity in deep-tissue tumors in living subjects.
We demonstrate that the ESOR-PA01 probe detects furin activity in vitro, generating a significant increase in PA signal in the presence of furin relative to control experiments. This effect is equally detectable in cultured cells with similar PA signal increase. Processing of ESOR-PA01 probe was significantly decreased after blocking furin activity with synthetic inhibitors, under cell culture conditions, preventing the increase in PA signal. This demonstrates the specific response of the ESOR-PA01 probe to furin-like activity. Moreover, ESOR-PA01 probe noninvasively reports the protease activity in living subjects, as shown by PA imaging of mice bearing subcutaneous furin-overexpressing MDA-MB-231 cells xenografts relative to the control experiments using mice bearing subcutaneous LoVo cells (furin-deficient) tumors. In the negative control group, LoVo-tumor bearing mice, we observed an increase in PA signal at 15 min after probe injection and decrease in PA signal to almost pre-injection levels at 60 min (Figure 4b). This indicates that only a small amount of the probe was trapped at the tumor site, possibly because fast wash-out of the probe and lower levels of furin-like activity in LoVo cells. In contrast, for mice carrying MDA-MB-231 tumors, a significant increase in the PA signal was detected at all time points after ESOR-PA01 probe injection (Figure 4c), suggesting probe accumulation at the tumor site. Mice carrying MDA-MB-231 tumors subjected to the negative control unclevable probe, ESOR-PA02, showed only low levels of PA signal increase similar to the LoVo-tumor bearing mice. We have not assessed the effect of furin inhibitors in animals, this remaining a goal for future studies.
Despite the fact that our ESOR-PA probe for protease activity detection is not an irreversible binding inhibitor (suicidal substrate) for furin, there is a potential for undesirable toxic effects in vivo, given that nanoparticles are formed inside the cells expressing furin. Furin is endogenously expressed at high levels in liver and kidneys and lower levels of furin are detected in spleen, brain, and thymus.26 However, at the working concentrations of ESOR-PA probes for in vivo experiments (25 nmol in 150 μl PBS), we observed no overt signs of toxicity in mice during experiments and up to several weeks after probe injection. Future studies may also benefit from detailed quantitative biodistribution studies with radiolabeled version of the probe. Additionally, we investigated the stability of the ESOR-PA01 probe to blood protease by incubating the probe with blood collected from mice bearing furin overexpressing MDA-MB-231 subcutaneous tumor. By the means of HPLC and MALDI-TOF MS, we detected no degradation products from ESOR-PA01 probe after incubation with blood plasma (Figure S5 and S6).
This furin-sensitive oligomerizable PA imaging probe has potential for interrogating tissues for activity of other specific enzymes by attaching NIR absorbers to specific substrates. For example, the ESOR-PA probes could be used to image and monitor other tumor-associated proteases such as prostate specific antigen (PSA), which manifests protease activity against certain substrates containing a carboxy-terminal arginine residue.27 Moreover, these ESOR-PA probes could be used to evaluate therapy response of protease inhibitors at a molecular level in living subjects and for targeted photodynamic therapy to increase the cytotoxic effect in tumors vs. normal tissue, when appropriate absorbers are attached to the protease substrate.
5. CONCLUSIONS
Employing a straightforward bioorthogonal condensation reaction, we have expended the versatility of ESOR probes-based imaging platform to photoacoustic imaging in cells and in vivo. We demonstrate that the furin-sensitive activatable PA probe has the ability to report furin and furin-like activity in cells and in mice tumor models using PA imaging. The capacity to enhance tumor signals with activatable oligomerizable probes makes PA imaging an attractive modality for protease activity detection and molecular diagnostics for preclinical and potentially clinical applications.
Supplementary Material
Acknowledgments
We thank J. Levi for technical advice in choosing the photoacoustic reporter molecule and S. Bohndiek for technical assistance with in vivo photoacoustic imaging experiments.
Funding Sources
We acknowledge funding support from NCI ICMIC P50CA114747 (SSG), NCI CCNE-T U54 U54CA151459 (SSG), the Canary Foundation (SSG), the Sir Peter Michael Foundation for supporting SRK with postdoctoral fellowship, and an IDEA award (W81XWH-09-1-0057) from Department of Defense Breast Cancer Research Program (JR).
Footnotes
Author Contributions
All authors have given approval to the final version of the manuscript.
The authors declare no competing financial interest.
Supplementary figures, probes synthetic procedures and PA imaging movies are provided in the Supporting Information section. This material is available free of charge via the Internet at http://pubs.acs.org.
References
- 1.Joyce JA, Pollard JW. Nat Rev Cancer. 2009;9:239. doi: 10.1038/nrc2618. [DOI] [PMC free article] [PubMed] [Google Scholar]
- 2.Mason SD, Joyce JA. Trends Cell Biol. 2011;21:228. doi: 10.1016/j.tcb.2010.12.002. [DOI] [PMC free article] [PubMed] [Google Scholar]
- 3.Razgulin A, Ma N, Rao J. Chem Soc Rev. 2011;40:4186. doi: 10.1039/c1cs15035a. [DOI] [PubMed] [Google Scholar]
- 4.Edgington LE, Verdoes M, Bogyo M. Curr Opin Chem Biol. 2011;15:798. doi: 10.1016/j.cbpa.2011.10.012. [DOI] [PMC free article] [PubMed] [Google Scholar]
- 5.Liu JJ, Wang W, Dicker DT, El-Deiry WS. Cancer Biol Ther. 2005;4:885. doi: 10.4161/cbt.4.8.2133. [DOI] [PubMed] [Google Scholar]
- 6.Dragulescu-Andrasi A, Liang G, Rao J. Bioconjug Chem. 2009;20:1660. doi: 10.1021/bc9002508. [DOI] [PMC free article] [PubMed] [Google Scholar]
- 7.Wang LV, Hu S. Science. 2012;335:1458. doi: 10.1126/science.1216210. [DOI] [PMC free article] [PubMed] [Google Scholar]
- 8.Hu S, Wang LV. J Biomed Opt. 2010;15:011101. doi: 10.1117/1.3281673. [DOI] [PMC free article] [PubMed] [Google Scholar]
- 9.Oh JT, Li ML, Zhang HF, Maslov K, Stoica G, Wang LV. J Biomed Opt. 2006;11:34032. doi: 10.1117/1.2210907. [DOI] [PubMed] [Google Scholar]
- 10.Zhang HF, Maslov K, Stoica G, Wang LV. Nat Biotechnol. 2006;24:848. doi: 10.1038/nbt1220. [DOI] [PubMed] [Google Scholar]
- 11.Kothapalli SR, Ma TJ, Vaithilingam S, Oralkan O, Khuri-Yakub BT, Gambhir SS. IEEE Trans Biomed Eng. 2012;59:1199. doi: 10.1109/TBME.2012.2183593. [DOI] [PMC free article] [PubMed] [Google Scholar]
- 12.de la Zerda A, Liu Z, Bodapati S, Teed R, Vaithilingam S, Khuri-Yakub BT, Chen X, Dai H, Gambhir SS. Nano Lett. 2010;10:2168. doi: 10.1021/nl100890d. [DOI] [PMC free article] [PubMed] [Google Scholar]
- 13.Levi J, Kothapalli SR, Ma TJ, Hartman K, Khuri-Yakub BT, Gambhir SS. J Am Chem Soc. 2010;132:11264. doi: 10.1021/ja104000a. [DOI] [PMC free article] [PubMed] [Google Scholar]
- 14.Levi J, Kothapalli SR, Bohndiek S, Yoon JK, Dragulescu-Andrasi A, Nielsen C, Tisma A, Bodapati S, Gowrishankar G, Yan X, Chan C, Starcevic D, Gambhir SS. Clin Cancer Res. 2013;19:1494. doi: 10.1158/1078-0432.CCR-12-3061. [DOI] [PMC free article] [PubMed] [Google Scholar]
- 15.Liang G, Ren H, Rao J. Nat Chem. 2010;2:54. doi: 10.1038/nchem.480. [DOI] [PMC free article] [PubMed] [Google Scholar]
- 16.Coppola JM, Bhojani MS, Ross BD, Rehemtulla A. Neoplasia. 2008;10:363. doi: 10.1593/neo.08166. [DOI] [PMC free article] [PubMed] [Google Scholar]
- 17.de Cicco RL, Bassi DE, Benavides F, Conti CJ, Klein-Szanto AJ. Mol Carcinog. 2007;46:654. doi: 10.1002/mc.20331. [DOI] [PubMed] [Google Scholar]
- 18.de la Zerda A, Zavaleta C, Keren S, Vaithilingam S, Bodapati S, Liu Z, Levi J, Smith BR, Ma TJ, Oralkan O, Cheng Z, Chen X, Dai H, Khuri-Yakub BT, Gambhir SS. Nat Nanotechnol. 2008;3:557. doi: 10.1038/nnano.2008.231. [DOI] [PMC free article] [PubMed] [Google Scholar]
- 19.Kruger R, Reinecke D, Kruger G, Thornton M, Picot P, Morgan T, Stantz K, Mistretta C. Proc. SPIE. Photons Plus Ultrasound: Imaging and Sensing 2009. 2009;7177:71770F. [Google Scholar]
- 20.Loening AM, Gambhir SS. Mol Imaging. 2003;2:131. doi: 10.1162/15353500200303133. [DOI] [PubMed] [Google Scholar]
- 21.Thomas G. Nat Rev Mol Cell Biol. 2002;3:753. doi: 10.1038/nrm934. [DOI] [PMC free article] [PubMed] [Google Scholar]
- 22.Seidah NG, Prat A. Nat Rev Drug Discov. 2012;11:367. doi: 10.1038/nrd3699. [DOI] [PubMed] [Google Scholar]
- 23.Bassi DE, Mahloogi H, Al-Saleem L, Lopez De Cicco R, Ridge JA, Klein-Szanto AJ. Mol Carcinog. 2001;31:224. doi: 10.1002/mc.1057. [DOI] [PubMed] [Google Scholar]
- 24.Bassi DE, Mahloogi H, Lopez De Cicco R, Klein-Szanto A. Am J Pathol. 2003;162:439. doi: 10.1016/s0002-9440(10)63838-2. [DOI] [PMC free article] [PubMed] [Google Scholar]
- 25.Cao CY, Shen YY, Wang JD, Li L, Liang GL. Sci Rep. 2013;3:1024. doi: 10.1038/srep01024. [DOI] [PMC free article] [PubMed] [Google Scholar]
- 26.Schalken JA, Roebroek AJ, Oomen PP, Wagenaar SS, Debruyne FM, Bloemers HP, Van de Ven WJ. J Clin Invest. 1987;80:1545. doi: 10.1172/JCI113240. [DOI] [PMC free article] [PubMed] [Google Scholar]
- 27.Webber MM, Waghray A, Bello D. Clin Cancer Res. 1995;1:1089. [PubMed] [Google Scholar]
Associated Data
This section collects any data citations, data availability statements, or supplementary materials included in this article.