

Abstract
Background
Health Professional Shortage Areas (HPSA) receive extra federal resources, but recent reports suggest that HPSA may not consistently identify areas of need.
Purpose
To assess areas of need based on county-level ischemic heart disease (IHD) and stroke mortality regions.
Methods
Need was defined by lack of awareness, treatment, or control of hypertension, diabetes, or hyperlipidemia. Counties were categorized into race-specific tertiles of IHD and stroke mortality using 1999–2006 CDC data. Multivariable logistic regression was used to model the relationships between IHD and stroke mortality region and each element of need.
Results
Awareness and treatment of cardiovascular (CVD) risk factors were similar for residents in counties across IHD and stroke mortality tertiles, but control tended to be lower in counties with the highest mortality.
Conclusions
High stroke and IHD mortality identify distinct regions from current HPSA designations, and may be an additional criterion for designating areas of need.
Keywords: Control, ischemia, stroke, HPSA
Introduction
Cardiovascular disease (CVD) remains the leading cause of mortality in the U.S. in men and women of every major ethnic group.1 Approximately 13 million individuals have a history of coronary artery disease and 7.2 million have suffered a myocardial infarction.1 Elkins et al. reported that if recent trends in ischemic stroke mortality continue, increases in U.S. stroke deaths will outpace overall population growth, with a doubling in such mortality over the next 30 years.2 While there has been an overall decline in the incidence of these diseases in the last few decades,3–4 the rate of this decline has differed by race, sex and age.4–6 Furthermore, this decline has not occurred in every part of the U.S. or among people in all socioeconomic strata.7–8 Reports indicate that an important reason for these observed disparities may lie in disparities in access to9–10 and the quality of health care.11–12
In an effort to address such disparities, the U.S. Health Resources and Services Administration (HRSA) designates Health Professional Shortage Areas (HPSAs) for special resource allocations.13 An HPSA designation involves a complex process that factors in ratio of providers to patients in the geographic area; underserved population groups that share common cultures or socio-demographic uniqueness (e.g., migrant farmworkers, low-income populations and Alaska Natives); and health care facilities which provide primary medical services to a geographic or population group (e.g., health centers, correctional institutions).14 Many federally funded programs such as the National Health Service Corps (NHSC) Scholarship Programs, NHSC Loan Repayment Program, Exchange Visitor Program, Medicare and Conrad State 30 Program use HPSA designations to allocate their program’s benefits or resources to targeted areas or groups,13 providing an additional incentive for areas or facilities to seek HPSA designation.
Health Professional Shortage Area designation is not permanent, and each year, the Department of Health and Human Services (HHS) is required by law to update and publish a list of newly designated HPSAs and indicate those entities that no longer have the designation.14 Unfortunately, this annual reassessment requirement has not been consistently met.14 Furthermore, published reports express concerns about using HPSA designation as currently construed to deploy scarce resources rationally.15 For example, the HPSA methodology may overstate the need for additional primary care providers. In the past, the HPSA methodology underestimated the number of available primary care physicians already providing services in shortage areas.14 Additionally, the current application process favors those states or agencies that have the skills and experience to complete and submit a HPSA designation request.14 For these reasons, the current approach for designation of HPSAs may not be a sufficient and comprehensive approach for judicious deployment of human and material resources16 if the second goal of Healthy People 2020 is to be achieved, namely, to achieve health equity, eliminate health disparities, and improve health for all groups.17
As part of the process for designating areas of health manpower need, it may be worth exploring the readily available and objective yardstick of county level mortality rates. For example, ischemic heart disease (IHD) and stroke mortality rates are likely to be influenced by county residents’ control of important CVD risk factors such as hypertension, diabetes and hyperlipidemia, which require chronic disease management by the area’s health professionals.
We hypothesized that participants living in areas with higher IHD or stroke mortality would have lower levels of awareness, treatment, and control of hypertension, diabetes, and hyperlipidemia compared to those living in areas with lower IHD or stroke mortality. We contrast these findings with our past work examining these same risk factors by HPSA designation at the county level, which found little evidence of need, as defined by risk factor control, in HPSA vs. non-HPSA areas.18–19
Methods
Study design and participants
The goals and design of the REGARDS study have been described elsewhere.20 Briefly, the REGARDS participants included 30,239 community-dwelling adults aged 45 years and older at baseline. Enrollment began in January 2003 and was completed in October 2007. Individuals were recruited from commercially available lists using a combination of telephone and mail contacts. Of individuals contacted and for whom eligibility could be confirmed, 49% agreed to participate. Using sampling weights, sub-populations were over-sampled, resulting in a cohort that was 42% African American and 55% female. Incentives included test results after an in-home visit and $30. Written informed consent was obtained. Participants are being followed by telephone interview every six months to detect potential study outcomes, which are later confirmed using medical record review procedures. Only baseline data were used in the current study. The Institutional Review Board of the University of Alabama at Birmingham and other participating centers approved the study methods prior to its commencement.
Study instruments and data collection
A computer-assisted telephone interview (CATI) was used to obtain socio-demographic and economic characteristics, past medical history, and measures of quality of life. During an in-home visit performed approximately three to four weeks after the telephone interview, health professionals obtained standardized physical measures such as participant’s weight, height, blood pressure, and a resting electrocardiography (ECG), phlebotomy, and urine collection. During the in-home visit, as well, all prescription and over-the-counter medications were recorded.
Definition of variables
Outcome variables
Hypertension was defined as having a blood pressure ≥140/90 mmHg (≥130/80mmHg if the participant also had diabetes or chronic kidney disease, defined as estimated glomerular filtration rate [eGFR] <60 ml/min/1.73m2),21 report of being told by a doctor or nurse they had hypertension or self-reported history of taking medication for hypertension. Diabetes was defined as a fasting blood sugar ≥126 mg/dL, having been told by a doctor or nurse they had diabetes, or treatment with a diabetes medication. Hyperlipidemia was defined as low-density lipoprotein >130 mg/dL, having been told by a doctor or nurse they had high cholesterol, or treatment with a cholesterol-lowering medication. Awareness about disease was defined as the participant reporting that he/she had been told by a doctor or nurse that they had hypertension, diabetes, or hyperlipidemia, or treatment of these disorders with medications. The proportion who were aware of their condition was the number aware divided by the number who met the disease definition. Treatment was defined as taking medication to treat the respective diseases. The proportion treated was defined as those taking medications divided by those aware of their condition. Control was based on having blood pressure, plasma glucose, and low-density lipoproteins below the cut points defined above. The proportion controlled was defined as the number controlled (by medication) divided by those treated for their condition.
Covariates from REGARDS data
Sociodemographic characteristics included age, sex, race, income, education, and insurance status. Age was categorized into 10-year intervals of 45–54, 55–64, 65–74, 75–84, and 85 years or older; race was self-reported as either African American or European American; educational attainment was categorized as less than high school, high school, some college, and college or more; and annual household income was grouped as less than $25,000, $25,000–$50,000, and more than $50,000. Insurance status was broadly classified as having or not having any type of insurance. We included body mass index (BMI), categorized as below 24.9kg/m2, 25–29.9kg/m2, and 30kg/m2 or above. Health behaviors included physical activity, alcohol intake, and medication adherence. For exercise, participants were asked about frequency of their exercise in a week, with responses categorized into none, one to three per week, and four or more per week. Smoking was categorized as currently smoking, past smoking (but not currently), or never smoking. Alcohol consumption was categorized as currently consuming alcohol or not. Medication adherence was assessed using the validated four-item Morisky scale, with any yes response categorizing the participant as nonadherent.22
Ischemic heart disease and stroke mortality data
The main exposure of interest was the participant’s county of residence by tertile of IHD or stroke mortality (low, medium, or high). Mortality data were taken from the Centers for Disease Control Wonder system, a publicly available resource which provides overall and disease-specific mortality rates at the county level, by age groups and by race. Causes of death are based on death certificates. For this analysis, we used county-level IHD and stroke mortality rates from 1999–2006 for individuals age 45 and over.23–24 Since African American and European American mortality tertile designations were not strongly correlated, each county with a REGARDS participant was categorized into race-specific tertiles of IHD and, separately, stroke mortality (Figure 1).
Figure 1.

Maps showing race-specific Ischemic Heart Disease (Panel A) and stroke (Panel B) mortality tertiles from CDC by county, 1999-2006.
HPSA and urban/rural designation
HPSA designation was based on population-to-Primary Care Physician Ratio, percent of the population with incomes below the poverty level, infant mortality rate or low birth weight rate (whichever score was higher), and travel time or distance to nearest available source of care (whichever scored more highly).25–26 Health Professional Shortage Area status is publically available on the HRSA web site.25 We classified the counties with REGARDS participants into those that were designated as HPSAs, partial HPSAs and non-HPSAs in 2009 (Figure 2). Partial HPSA designation occurs because entities such as hospitals may receive HPSA designation, but the county in which they are situated may not. As in past reports on HPSA status, counties with partial HPSA status were excluded from analysis.27 The rurality of the county was based on criteria set by the U.S. Census Bureau and available through HRSA along with the HPSA designation.28 We defined rural as a county that is 25% or less urban; urban as those that are 75% or more urban; and mixed counties as 25%–75% urban.
Figure 2.
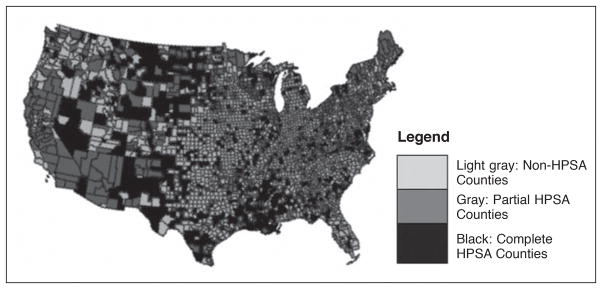
Map showing Health Professional Shortage Areas (HPSA) designation of U.S. counties in 2009.
Statistical analysis
Bivariate analyses were conducted to test the statistical significance of the association between each covariate and each of the outcome measures, as defined above. Multivariable logistic regression analysis was used to investigate the association between county IHD mortality tertile, and, separately, stroke mortality tertile and each element of need (awareness, treatment and control of hypertension, diabetes and hyperlipidemia, as defined above). Variables such as socio-demographic characteristics and health behaviors that were statistically significant at p<.05 on bivariate analysis and those known to be associated with IHD and stroke mortality based on extant literature were incorporated into models.29 Nine separate models were fit for IHD mortality tertiles, and nine additional models were fit for stroke mortality tertiles. Race-stratified tertiles were matched to the race of each patient in these models. Multi-level regression models were also used to account for clustering at the county level. Crude and fully adjusted odds ratios (ORs) and their 95% confidence intervals (CIs) are reported. Spearman’s rank correlation was used to determine the correlation between high IHD/stroke mortality areas and HPSAs. Data were analyzed using SAS software version 9.2 (SAS Institute, Cary, NC).
Results
Although we assessed the association between IHD or stroke mortality and the cardiovascular risk factors, using multi-level models did not show significant variation at the level of the counties. For ease of interpretation, the results of the individual level analyses are shown below.
The characteristics of participants included in the analysis are shown in Table 1. Age and sex distributions in low and high mortality counties were largely similar. There was an overall pattern for a greater proportion of individuals with risk factors in high vs. low mortality counties, but the differences, if present, were modest. There was a tendency for high IHD and stroke mortality counties to have higher proportions of participants living in HPSA areas (17.2% vs. 11.1% and 14.6% vs. 8.3% respectively). The rural-urban difference in mortality risk was strikingly greater for stroke than for IHD (15.2% vs. 30.5%, and 22.2% vs. 25.4% respectively).
Table 1.
Socio-demographic Characteristics of REGARDS Participants Residing in Counties in the High and Low IHD or Stroke Mortality Tertiles.a
| Socio-demographic variables | ALL Counties
|
Low IHD Mortality Tertile Counties
|
High IHD Mortality Tertile Counties
|
ALL Counties
|
Low Stroke Mortality Tertile Counties
|
High Stroke Mortality Tertile Counties
|
||||||
|---|---|---|---|---|---|---|---|---|---|---|---|---|
| N=19,954
|
N=7,273
|
N=4,891
|
N=19,804
|
N=6,285
|
N=5,886
|
|||||||
| No. | % | No. | % | No. | % | No. | % | No. | % | No. | % | |
| Mean age in years ± SD | 64.6 ± 9.4 | 64.7 ± 9.5 | 64.7 ± 9.3 | 64.9 ± 9.4 | 64.2 ± 9.4 | |||||||
| Age group | ||||||||||||
| 45–54 | 2636 | 13.2 | 962 | 13.2 | 594 | 12.2 | 2621 | 13.2 | 758 | 12.1 | 853 | 14.5 |
| 55–64 | 7703 | 38.6 | 2802 | 38.6 | 1946 | 39.8 | 7641 | 38.6 | 2482 | 39.5 | 2272 | 38.6 |
| 65–74 | 6342 | 31.8 | 2259 | 31.1 | 1567 | 32.0 | 6294 | 31.8 | 1976 | 31.4 | 1868 | 31.8 |
| 75–84 | 2917 | 14.6 | 1107 | 15.2 | 697 | 14.3 | 2897 | 14.6 | 946 | 15.1 | 793 | 13.5 |
| 85+ | 348 | 1.7 | 139 | 1.9 | 86 | 1.80 | 343 | 1.7 | 122 | 1.9 | 97 | 1.65 |
| p=.03 | p<.001 | |||||||||||
| Gender | ||||||||||||
| Female | 10905 | 54.6 | 3967 | 54.5 | 2639 | 54.0 | 10814 | 54.6 | 3320 | 52.8 | 3317 | 56.4 |
| Male | 9049 | 45.4 | 3306 | 45.5 | 2252 | 46.0 | 8990 | 45.4 | 2965 | 47.2 | 2569 | 43.7 |
| p=.39 | p=.001 | |||||||||||
| Race | ||||||||||||
| Black | 7167 | 35.9 | 2530 | 34.8 | 1454 | 29.7 | 7110 | 35.9 | 2565 | 40.8 | 2011 | 34.2 |
| White | 12787 | 64.1 | 4743 | 65.2 | 3437 | 70.3 | 12694 | 64.1 | 3720 | 59.2 | 3875 | 65.8 |
| p<.0001 | p<.0001 | |||||||||||
| Education | ||||||||||||
| <High School | 2520 | 12.6 | 829 | 11.4 | 700 | 14.3 | 2495 | 12.6 | 717 | 11.4 | 888 | 15.1 |
| High School | 5209 | 26.1 | 1734 | 23.9 | 1332 | 27.3 | 5148 | 26.0 | 1528 | 24.3 | 1672 | 28.4 |
| Some college | 5354 | 26.9 | 1936 | 26.6 | 1319 | 27.0 | 5325 | 26.9 | 1679 | 26.7 | 1603 | 27.3 |
| ≥College | 6860 | 34.4 | 2770 | 38.1 | 1535 | 31.4 | 6825 | 34.5 | 2358 | 37.5 | 1719 | 29.2 |
| p<.0001 | p<.0001 | |||||||||||
| Annual income | ||||||||||||
| <$25,000 | 5475 | 31.3 | 1892 | 29.6 | 1403 | 32.8 | 5430 | 31.3 | 1558 | 28.1 | 1798 | 35.0 |
| $25,000–$50,000 | 6069 | 34.7 | 2131 | 33.3 | 1538 | 36.0 | 6023 | 34.7 | 1877 | 33.8 | 1814 | 35.3 |
| >$50,000 | 5948 | 34.0 | 2374 | 37.1 | 1333 | 31.2 | 5916 | 34.1 | 2111 | 38.1 | 1527 | 29.7 |
| p<.0001 | p<.0001 | |||||||||||
| BMI | ||||||||||||
| ≤24.9 kg/m2 | 4962 | 25.1 | 1945 | 27.0 | 1240 | 25.5 | 4926 | 25.1 | 1567 | 25.1 | 1432 | 24.5 |
| 25–29.9 kg/m2 | 7300 | 36.9 | 2658 | 36.8 | 1771 | 36.5 | 7248 | 36.9 | 2386 | 38.2 | 2109 | 36.1 |
| ≥30 kg/m2 | 7547 | 38.1 | 2619 | 36.3 | 1844 | 38.0 | 7487 | 38.1 | 2286 | 36.6 | 2302 | 39.4 |
| p<.0001 | p=.02 | |||||||||||
| Current alcohol consumption | ||||||||||||
| Yes | 9930 | 49.8 | 3775 | 51.9 | 2287 | 46.8 | 9862 | 49.8 | 3430 | 54.6 | 2497 | 57.6 |
| No | 10024 | 50.2 | 3498 | 48.1 | 2604 | 53.2 | 9942 | 50.2 | 2855 | 45.4 | 3389 | 42.4 |
| p<.0001 | p<.0001 | |||||||||||
| Tobacco use | ||||||||||||
| Current | 2893 | 14.6 | 1015 | 14.0 | 724 | 14.9 | 2867 | 14.5 | 875 | 14.0 | 912 | 15.6 |
| Never | 9110 | 45.8 | 3372 | 46.6 | 2218 | 45.5 | 9044 | 45.8 | 2873 | 45.9 | 2716 | 46.3 |
| Past | 7878 | 39.6 | 2856 | 39.4 | 1932 | 39.6 | 7821 | 39.6 | 2515 | 40.2 | 2238 | 38.2 |
| p=.44 | p=.02 | |||||||||||
| Frequency of Exercise | ||||||||||||
| None | 6682 | 34.0 | 2378 | 33.1 | 1732 | 36.1 | 6624 | 33.9 | 2099 | 34.0 | 1988 | 34.3 |
| 1–3 times/week | 7020 | 35.7 | 2592 | 36.1 | 1641 | 34.2 | 6968 | 35.8 | 2236 | 36.2 | 2052 | 35.4 |
| 4 or more times/week | 5938 | 30.2 | 2206 | 30.7 | 1425 | 29.7 | 5859 | 30.3 | 1849 | 30.0 | 1759 | 30.3 |
| p=.01 | p=.88 | |||||||||||
| Medication adherence | ||||||||||||
| Yes | 12947 | 64.9 | 4698 | 64.6 | 3183 | 65.1 | 12838 | 64.8 | 3964 | 63.1 | 3949 | 67.1 |
| No | 7007 | 35.1 | 2575 | 35.4 | 1708 | 34.9 | 6966 | 35.2 | 2321 | 36.9 | 1937 | 32.9 |
| p=.81 | p<.0001 | |||||||||||
| Insurance | ||||||||||||
| Yes | 18617 | 93.4 | 6785 | 93.4 | 4558 | 93.2 | 18481 | 93.4 | 5888 | 93.7 | 5457 | 92.8 |
| No | 1320 | 6.6 | 479 | 6.6 | 331 | 6.8 | 1306 | 6.6 | 395 | 6.3 | 422 | 7.2 |
| p=.88 | p=.1 | |||||||||||
| HPSA | ||||||||||||
| Yes | 2531 | 12.7 | 808 | 11.1 | 840 | 17.2 | 2412 | 12.2 | 519 | 8.3 | 858 | 14.6 |
| No | 17423 | 87.3 | 6465 | 88.9 | 4051 | 82.8 | 17392 | 87.2 | 5766 | 91.7 | 5028 | 85.4 |
| p<.0001 | p<.0001 | |||||||||||
| Rurality of countyb | ||||||||||||
| Urban | 13023 | 65.3 | 4855 | 66.8 | 2896 | 59.2 | 12992 | 65.6 | 4835 | 76.9 | 3036 | 51.6 |
| Rural | 4453 | 22.3 | 1615 | 22.2 | 1240 | 25.4 | 4358 | 22.0 | 954 | 15.2 | 1792 | 30.5 |
| Mixed | 2478 | 12.4 | 803 | 11.0 | 755 | 15.4 | 2454 | 12.4 | 496 | 7.9 | 1058 | 17.9 |
| p<.0001 | p<.0001 | |||||||||||
County level mortality tertiles derived from CDC Wonder data from 1999–2006; N = Number of participants in the country; Medication adherence assessed using the validated 4-item Morisky scale; Insurance defined as having or not having any type of insurance;
Rurality of county based on criteria set by U.S. census bureau: Rural = ≤25% urban, Urban = ≥75% urban, Mixed = 25–75% urban; Total number of counties different for IHD and stroke mortality tertiles due to missing values for small counties.
BMI = Body Mass Index
HPSA = Health Professional Shortage Area
Figures in bold are significant.
Figure 1 shows maps of the U.S. with 1,821 counties categorized into IHD and stroke mortality tertiles, by race (Panels A and B, respectively). The counties in the highest IHD mortality tertile form a crescent-like band stretching from the Northeast toward Texas, and hooking up into New Mexico, southern California and southwestern Nevada. The correlation between African American and European American county-level tertile was moderate (Spearman’s r=0.56; p<.0001). For stroke, in European Americans, the highest mortality tertile counties were located in the Southeast, spreading northward into the central Midwest, and scattered into the Northwest. In contrast, the highest stroke mortality tertile counties for African Americans were concentrated almost entirely in the Southeast over what is traditionally considered the Stroke Belt. The correlation between county-level tertile designation between African Americans and European Americans was also moderate (Spearman’s r=0.63; p<.0001). High IHD and high stroke mortality tertile designation demonstrated low correlation (Spearman’s r=0.16, p<.0001) indicating little overlap between these counties. Similarly, the correlation between HPSA designation and IHD and stroke mortality tertiles was low (Figure 2), 0.04 (p=.08) and .01 (p=0.58), respectively, suggesting that HPSA designation and high CVD mortality tertile identified largely distinct counties.
Table 2 presents awareness, treatment, and control of hypertension, diabetes, and hyperlipidemia by high and low mortality tertiles for IHD and stroke. Overall, awareness and treatment were high except for hyperlipidemia, but control was less optimal, ranging from 36–79%. For hypertension, control was similar across tertiles of IHD mortality (58.2% in high mortality counties vs. 57.7% in the mortality counties). However, there was less control in high vs. low IHD mortality counties for diabetes (35.8 vs. 40.9%, respectively) and hyperlipidemia (76.1 vs. 79.2%, respectively). Hypertension control was slightly lower in counties in the highest vs. lowest stroke mortality tertile (57.6 vs. 58.6%, respectively), but was similar for diabetes and cholesterol.
Table 2.
Proportion of Participants with Awareness, Treatment and Control of Hypertension, Diabetes and Hyperlipidemia, by County IHD and Stroke Mortality Tertiles (Medium Tertile Omitted for Clarity)a,b,c,d,e,f
| Cardiovascular risk factors | Outcomes | N | IHD
|
Stroke
|
||||
|---|---|---|---|---|---|---|---|---|
| Overall % | Low mortality tertile (%) | High mortality tertile (%) | Overall (%) | Low mortality tertile (%) | High mortality tertile (%) | |||
| Hypertension (N=12,747) | Awareness | 11,460 | 89.9 | 88.8 | 89.8 | 89.9 | 89.5 | 90.2 |
| Treatment | 10,923 | 95.3 | 95.3 | 95.7 | 95.3 | 95.7 | 95.1 | |
| Control | 6,366 | 58.3 | 57.7 | 58.2 | 58.3 | 58.6 | 57.6 | |
| Diabetes (N=4,887) | Awareness | 4,410 | 90.2 | 89.8 | 89.4 | 90.2 | 89.8 | 90.5 |
| Treatment | 3,577 | 81.1 | 79.8 | 83.3 | 81.1 | 80.1 | 82.0 | |
| Control | 1,411 | 40.4 | 40.9 | 35.8 | 40.3 | 41.4 | 38.4 | |
| Hyperlipidemia (N=14,065) | Awareness | 10,422 | 74.1 | 73.9 | 75.2 | 74.2 | 73.8 | 73.5 |
| Treatment | 6,603 | 63.4 | 62.4 | 63.6 | 63.4 | 62.8 | 63.4 | |
| Control | 5,119 | 77.5 | 79.2 | 76.1 | 77.6 | 77.8 | 77.2 | |
Awareness; Knowledge of the participant about the cardiovascular disease risk factors.
Treatment; Whether the participant is receiving treatment for disease.
Control; An assessment of whether the cardiovascular disease risk factor is under control based on clinically defined cut-points.
Hypertension; Defined as having a blood pressure of 140/90 or greater (130/80 or greater if the participant also had diabetes or chronic kidney disease, defined as estimated glomerular filtration rate [eGFR] <60 ml/min/1.73m), or report of being told by a doctor or nurse they had hypertension.
Diabetes = Defined as a fasting blood sugar >126 mg/dL, having been told by a doctor or nurse they had diabetes, or treatment with a diabetes medication.
Hyperlipidemia = Defined as cholesterol >130mg/dL, having been told by a doctor or nurse they had high cholesterol, or treatment with a cholesterol medication.
IHD = Ischemic Heart Disease
Table 3 presents the crude and adjusted odds ratios and confidence intervals for the highest vs. lowest mortality tertile, for awareness, treatment, and control of each of the three CVD risk factors (hypertension, diabetes, and hyperlipidemia), for both county-level IHD and stroke mortality. We found no statistically significant difference between awareness, treatment, or control of hypertension across counties in the IHD mortality tertiles, but the adjusted odds of control were 12% lower in the highest stroke mortality counties relative to the lowest stroke mortality counties. With respect to diabetes, we observed 26% higher unadjusted odds for treatment in the highest vs. lowest IHD mortality tertiles, but the 21% higher adjusted odds were no longer statistically significant. However, the adjusted odds for control were 21% lower in the counties in the highest vs. lowest IHD tertile, a statistically significant finding. A similar pattern for more treatment, but less control was seen in the highest vs. lowest stroke mortality counties, but this difference was not statistically significant. For participants with hyperlipidemia, awareness and treatment were not significantly associated with either IHD or stroke mortality tertile. However, compared with the lowest mortality counties, the high IHD mortality counties had 17% lower adjusted odds of control, a pattern not seen in the stroke mortality counties.
Table 3.
Odds Ratios and 95% Confidence Intervals for the Association Between Awareness, Treatment and Control of Cardiovascular Disease Risk Factors and Residence in the High Vs. Low Ischemic Heart Disease (IHD) and Stroke Mortality Tertilesa,b,c,e,f
| Outcomes | IHD
|
Stroke
|
||
|---|---|---|---|---|
| High vs. low IHD mortality
|
High vs. low stroke mortality
|
|||
| Crude OR (95% CI) | Adjusted OR (95% CI)a | Crude OR (95% CI) | Adjusted OR (95% CI) | |
| Hypertensiond | ||||
| Awareness (n=11549) | 1.11 (0.96–1.29) | 1.14 (0.97–1.35) | 1.08 (0.94–1.26) | 1.07 (0.90–1.28) |
| Treatment (n=10380) | 1.09 (0.87–1.38) | 1.10 (0.85–1.43) | 0.87 (0.70–1.09) | 0.80 (0.61–1.04) |
| Control (n=9909) | 1.02 (0.93–1.13) | 1.00 (0.89–1.12) | 0.96 (0.87–1.06) | 0.88 (0.78–0.99) g |
| Diabetese | ||||
| Awareness (n=4380) | 0.97 (0.76–1.23) | 1.02 (0.78–1.34) | 1.08 (0.85–1.37) | 0.98 (0.73–1.31) |
| Treatment (n=3975) | 1.26 (1.03–1.54)g | 1.21 (0.96–1.52) | 1.13 (0.93–1.37) | 1.12 (0.88–1.42) |
| Control (n=3217) | 1.08 (0.92–1.26) | 0.79 (0.64–0.96)g | 0.88 (0.74–1.05) | 0.82 (0.64–1.05) |
| Hyperlipidemiaf | ||||
| Awareness (n=12791) | 1.07 (0.97–1.18) | 1.05 (0.94–1.17) | 0.99 (0.90–1.09) | 0.98 (0.87–1.10) |
| Treatment (n=9605) | 1.05 (0.95–1.17) | 1.06 (0.94–1.20) | 1.03 (0.93–1.14) | 1.02 (0.90–1.15) |
| Control (n=6146) | 0.84 (0.72–0.97)g | 0.83 (0.70–0.98) g | 0.97 (0.83–1.12) | 0.95 (0.80–1.14) |
Awareness = knowledge of the participant about the cardiovascular disease risk factors
Treatment = Whether the participant is receiving treatment for disease
Control = An assessment of whether the cardiovascular disease risk factor is under control based on clinically defined cut-points
Hypertension = Defined as having a blood pressure of 140/90 or greater (130/80 or greater if the participant also had diabetes or chronic kidney disease, defined as estimated glomerular filtration rate [eGFR] <60 ml/min/1.73m), or report of being told by a doctor or nurse they had hypertension
Diabetes = Defined as a fasting blood sugar >126 mg/dL, having been told by a doctor or nurse they had diabetes, or treatment with a diabetes medication
Hyperlipidemia: Defined as cholesterol >130mg/dL, having been told by a doctor or nurse they had high cholesterol, or treatment with a cholesterol medication
Denotes statistically significant figures
CI = Confidence Intervals; models adjusted for age, race, gender, education, income, Body Mass Index (BMI), exercise alcohol/tobacco use, medication adherence, and rurality
IHD = Ischemic Heart Disease
OR = Odds Ratio
To facilitate interpretation, the predicted probabilities corresponding to these odds ratios indicate that the control differences in low vs. high IHD mortality counties for diabetes were 40% (95% CI 0.38–0.42) vs. 36% (0.33–0.38) and for hyperlipidemia were 80% (0.79–0.82) vs. 77% (0.75–0.79). Similarly, hypertension control in low vs. high stroke mortality counties were 40% (0.38–0.44) vs. 37% (0.33–0.42).
Discussion
The results of our study suggest that control of two CVD risk factors, namely diabetes and hyperlipidemia, was less likely in counties with high IHD mortality than in counties with low IHD mortality. Similarly, the control of hypertension, a strong risk factor for stroke, was less likely among participants living in counties of high stroke mortality compared with those living in counties of low stroke mortality. Together with our previous reports that HPSA status was inconsistently associated with 1) awareness, treatment, and control of hypertension, diabetes, and high cholesterol; and 2) indicators of quality of CVD care,18–19 these findings suggest that area-level CVD mortality rates may be considered as an additional criterion for designating areas of need for federal resource allocation purposes.
Diabetes mellitus and hyperlipidemia are established risk factors for IHD.30–31 Similarly, the literature is replete with studies that have linked hypertension with stroke.32–34 Our finding that counties with relatively high IHD mortality also have participants with less likelihood of having controlled diabetes and hyperlipidemia is noteworthy, especially considering the variables we used to adjust the analyses. We found little evidence for a difference between high and low IHD mortality counties in terms of awareness and treatment of the aforementioned IHD risk factors, possibly reflecting the effectiveness of national and regional public health campaigns to raise awareness about disease detection. In fact, we observed a trend for more treatment in high vs. low mortality areas for some risk factors. However, controlling risk factors almost always requires regular visits to health care providers and adjustment of medications, raising the possibility that access to optimum health care may be a factor in high CVD mortality regions. This is supported by our observation of no significant differences in characteristics such as insurance and medication adherence which may have explained why control is poor despite similar levels of awareness about the disease and treatment modalities.
One potential contributor to our findings may be the greater proportion of residents in rural areas in high CVD mortality regions. Residents of rural areas have a higher risk of developing diabetes and hypertension, as well as worse control of risk factors.35 The challenges of accessing health care in rural areas have been reported, especially for those counties with a high proportion of minority populations.36–39 Poignantly, these studies suggest that residence in a rural area contributes to limited access to health care as a result of geographic distances as well as low income and education, with reduced frequency of patient-provider contacts, reduced early and correct diagnosis and treatment, ineffectual follow-ups and hence poorer control of the disease.40–43 Specifically, individuals are less likely to have regular checkups for IHD risk factors44 and there may be lower compliance by health care providers to standardized therapies for these diseases.41,45 Notably, despite the greater representation of rural residents, the majority of REGARDS participants in high IHD or stroke counties were nevertheless urban residents, suggesting that rural residence alone is unlikely to be responsible for our findings. In addition, rural residence was included in the multivariable models and did not fully explain our observations.
Our finding that those participants with poor control of hypertension were likely to be living in a county in the high rather than the low stroke mortality tertile is in keeping with the well-known association between hypertension and stroke (e.g., a 20/10 mm Hg increase or decrease in blood pressure is associated with a corresponding two-fold difference in the risk of stroke).46
The low correlation between high IHD and stroke mortality counties is noteworthy given the similarity in the identified risk factors for both diseases. This observation suggests that although there are overlapping risk factors responsible for both IHD events and stroke, there are probably other distinct environmental or social factors which influence mortality from each disease. Although our analysis was at the county level, prior reports at the state level demonstrate a similar lack of correlation between stroke and IHD mortality.47
The mis-match between the counties in the high IHD or stroke mortality tertile and HPSA counties buttresses the concern that current HPSA designation may not consistently be given to areas of need for health care service prioritization. Although steps have been taken by successive government health agencies to bridge the gap in health care access between rural and urban areas and between geographical areas and populations, our finding that areas not designated as HPSAs experienced a higher CVD mortality and also demonstrated worse control of CVD risk factors raises several issues that warrant further exploration. It is possible that HPSA designation has not consistently been provided to counties that warrant it, including many counties with high CVD mortality. By the same token, some areas that may no longer need HPSA designation may continue to have it. Given the known challenges of applying for HPSA designation by departments of health and other health organizations, and delays experienced in updating this status to reflect current health needs of the population, it is possible that the current process of HPSA designation may not be capturing the health services required by many areas or population groups.
It is worth noting that the host of characteristics we had available in our models did not explain the lower odds of control of risk factors we observed in the high mortality areas. While it is possible that residual confounding may play a role, alternative explanations for high IHD and stroke mortality regions should be sought, and are the subject of ongoing investigation in REGARDS.48–49
This study has several potential limitations, the most obvious being its inability to draw causal associations as a result of its cross-sectional design. Second, the use of self-reported data may introduce reporting bias. However, self-reporting of many of the variables used here has been validated.22,50–53 Third, county level IHD and especially stroke mortality estimates may not be stable for all counties because of sparse population density. We note that infant mortality rates, one of the current criteria used for HPSA designation, are even lower than IHD mortality rates and may therefore be less stable. Another limitation of the study design is that the REGARDS population may not be representative of residents in either HPSA or non-HPSA areas, as demonstrated by the high awareness of diabetes and hypertension. It is possible that the control differences we observed in this possibly more health-conscious study population may be less than those that would be observed among more general population. Last, the study was not able to define the mechanisms that led to lower odds of risk factor control in high mortality regions. Future study of access to care and health services utilization may shed light on these important issues.
In summary, we found little evidence of differences in awareness and treatment of hypertension, diabetes or high cholesterol across tertiles of IHD and stroke mortality at the county level. However, we found less control of diabetes and cholesterol in the counties in the highest IHD mortality tertile, and less control of hypertension in the counties in the highest stroke mortality tertile. Because successful control of CVD risk factors requires access to high quality medical care, these findings suggest that additional resources in these areas may be needed if the goals of the Healthy People 202017 objectives are to be achieved. The lack of overlap either between counties in the high IHD and stroke mortality tertile or HPSA counties suggests that county-level CVD mortality rates may be informative in making resource allocation decisions.
Acknowledgments
This research project is supported by a cooperative agreement U01 NS041588 from the National Institute of Neurological Disorders and Stroke, National Institutes of Health, Department of Health and Human Services. The authors thank the investigators, staff, and participants of the REGARDS study for their valuable contributions. A full list of participating REGARDS investigators and institutions can be found at http://www.regardsstudy.org.
Funding source
Support provided by R01 HL80477 from the National Heart, Lung and Blood Institute and by Cooperative Agreement U01 NS041588 from the National Stroke Institute.
Footnotes
We confirm that there are no financial interests or other dual commitments that represent potential conflicts of interest for any of the authors.
Notes
- 1.Rimmerman CM. Coronary heart disease. Cleveland, OH: Cleveland Clinic Foundation; 2000–2011. Available at: http://www.clevelandclinicmeded.com/medicalpubs/diseasemanagement/cardiology/coronary-artery-disease/ [Google Scholar]
- 2.Elkins JS, Johnston SC. Thirty-year projections for deaths from ischemic stroke in the United States. Stroke. 2003 Sep;34(9):2109–12. doi: 10.1161/01.STR.0000085829.60324.DE. [DOI] [PubMed] [Google Scholar]
- 3.Cooper R, Cutler J, Desvigne-Nickens P, et al. Trends and disparities in coronary heart disease, stroke, and other cardiovascular diseases in the United States: findings of the national conference on cardiovascular disease prevention. Circulation. 2000 Dec 19;102(25):3137–47. doi: 10.1161/01.cir.102.25.3137. [DOI] [PubMed] [Google Scholar]
- 4.Rosamond WD, Chambless LE, Folsom AR, et al. Trends in the incidence of myocardial infarction and in mortality due to coronary heart disease, 1987 to 1994. N Engl J Med. 1998 Sep 24;339(13):861–7. doi: 10.1056/NEJM199809243391301. [DOI] [PubMed] [Google Scholar]
- 5.Williams JE, Massing M, Rosamond WD, et al. Racial disparities in CHD mortality from 1968–1992 in the state economic areas surrounding the ARIC study communities. Atherosclerosis Risk in Communities. Ann Epidemiol. 1999 Nov;9(8):472–80. doi: 10.1016/s1047-2797(99)00029-0. [DOI] [PubMed] [Google Scholar]
- 6.Rosamond WD, Folsom AR, Chambless LE, et al. Coronary heart disease trends in four United States communities. The Atherosclerosis Risk in Communities (ARIC) study 1987–1996. Int J Epidemiol. 2001 Oct;30( Suppl 1):S17–22. doi: 10.1093/ije/30.suppl_1.s17. [DOI] [PubMed] [Google Scholar]
- 7.Kaplan GA. Going back to understand the future: socioeconomic position and survival after myocardial infarction. Ann Intern Med. 2006 Jan 17;144(2):137–9. doi: 10.7326/0003-4819-144-2-200601170-00012. [DOI] [PubMed] [Google Scholar]
- 8.Pickle LW, Gillum RF. Geographic variation in cardiovascular disease mortality in U.S. Blacks and Whites. J Natl Med Assoc. 1999 Oct;91(10):545–56. [PMC free article] [PubMed] [Google Scholar]
- 9.Eggers PW. Racial differences in access to kidney transplantation. Health Care Financ Rev. 1995 Winter;17(2):89–103. [PMC free article] [PubMed] [Google Scholar]
- 10.Carlisle DM, Leake BD, Shapiro MF. Racial and ethnic disparities in the use of cardiovascular procedures: associations with type of health insurance. Am J Public Health. 1997 Feb;87(2):263–7. doi: 10.2105/ajph.87.2.263. [DOI] [PMC free article] [PubMed] [Google Scholar]
- 11.Jha AK, Varosy PD, Kanaya AM, et al. Differences in medical care and disease outcomes among Black and White women with heart disease. Circulation. 2003 Sep 2;108(9):1089–94. doi: 10.1161/01.CIR.0000085994.38132.E5. [DOI] [PubMed] [Google Scholar]
- 12.Borzak S, Joseph C, Havstad S, et al. Lower thrombolytic use for African Americans with myocardial infarction: an influence of clinical presentation? Am Heart J. 1999 Feb;137(2):338–45. doi: 10.1053/hj.1999.v137.92523. [DOI] [PubMed] [Google Scholar]
- 13.Health Resources and Services Administration. Shortage designation: health professional shortage areas and medically underserved areas/populations. Rockville, MD: Health Resources and Services Administration; 2010. Available at: http://bhpr.hrsa.gov/shortage/ [Google Scholar]
- 14.United States Government Accountability Office. Health professional shortage areas. (GAO-07-84) Washington, DC: United States Government Accountability Office; 2006. [Google Scholar]
- 15.Kohrs FP, Mainous AGI. The relationship of health professional shortage areas to health status: implications for health manpower policy. Arch Fam Med. 1995 Aug;4(8):681–5. doi: 10.1001/archfami.4.8.681. [DOI] [PubMed] [Google Scholar]
- 16.Ricketts TC, Goldsmith LJ, Holmes GM, et al. Designating places and populations as medically underserved: a proposal for a new approach. J Health Care Poor Underserved. 2007 Aug;18(3):567–89. doi: 10.1353/hpu.2007.0065. [DOI] [PubMed] [Google Scholar]
- 17.Centers for Disease Control and Prevention. Healthy people 2020. Atlanta, GA: Centers for Disease Control and Prevention; 2009. Available at: http://www.cdc.gov/nchs/healthy_people/hp2020.htm. [Google Scholar]
- 18.Brown TM, Parmar G, Durant RW, et al. Health Professional Shortage Areas, insurance status, and cardiovascular disease prevention in the Reasons for Geographic and Racial Differences in Stroke (REGARDS) Study. J Health Care Poor Underserved. 2011 Nov;22(4):1179–89. doi: 10.1353/hpu.2011.0127. [DOI] [PMC free article] [PubMed] [Google Scholar]
- 19.Durant R, Halanych J, Shikany J, et al. The relationship between awareness, treatment, and control of hypertension, diabetes and hyperlipidemia and an area measure of access to primary care. Presented at: American Heart Association Quality of Care and Outcomes Research (AHA-QCOR) in Cardiovascular Disease and Stroke; 2010; Washington (DC). 2010. [Google Scholar]
- 20.Howard VJ, Cushman M, Pulley L, et al. The reasons for geographic and racial differences in stroke study: objectives and design. Neuroepidemiology. 2005;25(3):135–43. doi: 10.1159/000086678. [DOI] [PubMed] [Google Scholar]
- 21.McClellan WM, Abramson J, Newsome B, et al. Physical and psychological burden of chronic kidney disease among older adults. Am J Nephrol. 2010;31(4):309–17. doi: 10.1159/000285113. [DOI] [PMC free article] [PubMed] [Google Scholar]
- 22.Morisky DE, Green LW, Levine DM. Concurrent and predictive validity of a self-reported measure of medication adherence. Medical Care. 1986 Jan;24(1):67–74. doi: 10.1097/00005650-198601000-00007. [DOI] [PubMed] [Google Scholar]
- 23.National Centers for Health Statistics at the Centers for Disease Control and Prevention. CDC Wonder Compressed Mortality File 1999–2006. Atlanta, GA: Centers for Disease Control and Prevention; 2009. [Google Scholar]
- 24.National Centers for Health Statistics at the Centers for Disease Control and Prevention. CDC Wonder Compressed Mortality File 1999–2005. Atlanta, GA: Centers for Disease Control and Prevention; 2008. [Google Scholar]
- 25.Health Resources and Services Administration. Primary medical care Health Professional Shortage Areas (HPSAs) designation criteria. Rockville, MD: Health Resources and Services Administration; 2011. Available at: http://bhpr.hrsa.gov/shortage/hpsas/designationcriteria/primarycarehpsacriteria.html. [Google Scholar]
- 26.Department of Health and Human Services, Health Resource and Services Administration. Criteria for determining priorities among health professional shortage areas. 10432531-2. Vol. 68. Rockville, MD: Office of the Federal Register, National Archives and Records Administration; 2003. Available at: http://edocket.access.gpo.gov/2003/pdf/03-13478.pdf. [Google Scholar]
- 27.Liu JJ. Health professional shortage and health status and health care access. J Health Care Poor Underserved. 2007 Aug;18(3):590–8. doi: 10.1353/hpu.2007.0062. [DOI] [PubMed] [Google Scholar]
- 28.U.S. Census Bureau, Geography Division. Census 2000 urban and rural classification. Washington, DC: U.S. Census Bureau; 2010. Available at: http://www.census.gov/geo/www/ua/ua_2k.html. [Google Scholar]
- 29.Hosmer D, Lemeshow S. Applied logistic regression (Wiley series in probability and statistics) New York, NY: John Wiley and Sons; 2000. [Google Scholar]
- 30.Hafner SM. Coronary heart disease in patients with diabetes. N Engl J Med. 2000 Apr 6;342(14):1040–2. doi: 10.1056/NEJM200004063421408. [DOI] [PubMed] [Google Scholar]
- 31.Koren MJ, Hunninghake DB. Clinical outcomes in managed-care patients with coronary heart disease treated aggressively in lipid-lowering disease management clinics: the alliance study. J Am Coll Cardiol. 2004 Nov 2;44(9):1772–9. doi: 10.1016/j.jacc.2004.07.053. [DOI] [PubMed] [Google Scholar]
- 32.Leoo T, Lindgren A, Petersson J, et al. Risk factors and treatment at recurrent stroke onset: results from the Recurrent Stroke Quality and Epidemiology (RESQUE) Study. Cerebrovasc Dis. 2008;25(3):254–60. doi: 10.1159/000113864. [DOI] [PMC free article] [PubMed] [Google Scholar]
- 33.Ahmed N, Wahlgren N, Brainin M, et al. Relationship of blood pressure, antihypertensive therapy, and outcome in ischemic stroke treated with intravenous thrombolysis: retrospective analysis from Safe Implementation of Thrombolysis in Stroke–International Stroke Thrombolysis Register (SITS-ISTR) Stroke. 2009 Jul;40(7):2442–9. doi: 10.1161/STROKEAHA.109.548602. [DOI] [PubMed] [Google Scholar]
- 34.Ntaios G, Bath P, Michel P. Blood pressure treatment in acute ischemic stroke: a review of studies and recommendations. Curr Opin Neurol. 2010 Feb;23(1):46–52. doi: 10.1097/WCO.0b013e3283355694. [DOI] [PubMed] [Google Scholar]
- 35.Mainous AG, 3rd, King DE, Garr DR, et al. Race, rural residence, and control of diabetes and hypertension. Ann Fam Med. 2004 Nov-Dec;2(6):563–8. doi: 10.1370/afm.119. [DOI] [PMC free article] [PubMed] [Google Scholar]
- 36.Connor A, Layne L, Thomisee K. Providing care for migrant farm worker families in their unique sociocultural context and environment. J Transcult Nurs. 2010 Apr;21(2):159–66. doi: 10.1177/1043659609357631. [DOI] [PubMed] [Google Scholar]
- 37.Roy SR, McGinty EE, Hayes SC, et al. Regional and racial disparities in asthma hospitalizations in Mississippi. J Allergy Clin Immunol. 2010 Mar;125(3):636–42. doi: 10.1016/j.jaci.2009.11.046. [DOI] [PubMed] [Google Scholar]
- 38.Chan L, Wang H, Terdiman J, et al. Disparities in outpatient and home health service utilization following stroke: results of a 9-year cohort study in Northern California. PMR. 2009 Nov;1(11):997–1003. doi: 10.1016/j.pmrj.2009.09.019. [DOI] [PMC free article] [PubMed] [Google Scholar]
- 39.Koopman RJ, Mainous AG, 3rd, Geesey ME. Rural residence and Hispanic ethnicity: doubly disadvantaged for diabetes? J Rural Health. 2006 Winter;22(1):63–8. doi: 10.1111/j.1748-0361.2006.00009.x. [DOI] [PubMed] [Google Scholar]
- 40.LaVeist TA, Arthur M, Morgan A. The cardiac access longitudinal study. A study of access to invasive cardiology among African American and White patients. J Am Coll Cardiol. 2003 Apr 2;41(7):1159–66. doi: 10.1016/s0735-1097(03)00042-1. [DOI] [PubMed] [Google Scholar]
- 41.Zoorob R, Mainous AI. Practice patterns of rural family physicians with the American Diabetes Association standards of care. J Comm Health Affairs. 1996 Jun;21(3):175–82. doi: 10.1007/BF01557997. [DOI] [PubMed] [Google Scholar]
- 42.Dansky KH, Dirani R. The use of health care services by people with diabetes in rural areas. J Rural Health. 1998 Spring;14(2):129–37. doi: 10.1111/j.1748-0361.1998.tb00614.x. [DOI] [PubMed] [Google Scholar]
- 43.Ayanian JZ, Weissman JS, Schneider EC, et al. Unmet health needs of uninsured adults in the United States. JAMA. 2000 Oct 25;284(16):2061–9. doi: 10.1001/jama.284.16.2061. [DOI] [PubMed] [Google Scholar]
- 44.Alkadry MG, Wilson C, Nicholson D. Stroke awareness among rural residents: the case of West Virginia. Soc Work Health Care. 2005;42(2):73–92. doi: 10.1300/J010v42n02_05. [DOI] [PubMed] [Google Scholar]
- 45.Coon P, Zulkowski K. Adherence to American Diabetes Association standards of care by rural health care providers. Diabetes Care. 2002 Dec;25(12):2224–9. doi: 10.2337/diacare.25.12.2224. [DOI] [PubMed] [Google Scholar]
- 46.Lewington S, Clarke R, Qizilbash N, et al. Age-specific relevance of usual blood pressure to vascular mortality: a meta-analysis of individual data for one million adults in 61 prospective studies. Lancet. 2002 Dec 14;360(9349):1903–13. doi: 10.1016/s0140-6736(02)11911-8. [DOI] [PubMed] [Google Scholar]
- 47.Howard G, Cushman M, Prineas RJ, et al. Advancing the hypothesis that geographic variations in risk factors contribute relatively little to observed geographic variations in heart disease and stroke mortality. Preventive Medicine. 2009 Aug-Sep;49(2–3):129–32. doi: 10.1016/j.ypmed.2009.03.004. [DOI] [PMC free article] [PubMed] [Google Scholar]
- 48.Meschia JF, Merrill P, Soliman EZ, et al. Racial disparities in awareness and treatment of atrial fibrillation. The Reasons for Geographic and Racial Differences in Stroke (REGARDS) Study. Stroke. 2010 Apr;41(4):581–7. doi: 10.1161/STROKEAHA.109.573907. [DOI] [PMC free article] [PubMed] [Google Scholar]
- 49.You Z, Cushman M, Jenny NS, et al. Tooth loss, systemic inflammation, and prevalent stroke among participants in the Reasons for Geographic and Racial Difference in Stroke (REGARDS) Study. Atherosclerosis. 2009 Apr;203(2):615–9. doi: 10.1016/j.atherosclerosis.2008.07.037. [DOI] [PMC free article] [PubMed] [Google Scholar]
- 50.Bourgeois FT, Porter SC, Valim C, et al. The value of patient self-report for disease surveillance. J Am Med Inform Assoc. 2007 Nov-Dec;14(6):765–71. doi: 10.1197/jamia.M2134. [DOI] [PMC free article] [PubMed] [Google Scholar]
- 51.Caraballo RS, Giovino GA, Pechacek TF, et al. Factors associated with discrepancies between self-reports on cigarette smoking and measured serum cotinine levels among persons aged 17 years or older: Third National Health and Nutrition Examination Survey, 1988–1994. Am J Epidemiol. 2001 Apr 15;153(8):807–14. doi: 10.1093/aje/153.8.807. [DOI] [PubMed] [Google Scholar]
- 52.Zeller A, Ramseier E, Teagtmeyer A, et al. Patients’ self-reported adherence to cardiovascular medication using electronic monitors as comparators. Hypertension Research. 2008 Nov;31(11):2037–43. doi: 10.1291/hypres.31.2037. [DOI] [PubMed] [Google Scholar]
- 53.Myers T. Corroboration of self-reported alcohol consumption—a comparison of the accounts of a group of male prisoners and those of their wives/cohabitees. Alcohol Alcsm. 1983;18(1):67–74. [Google Scholar]