

Abstract
Purpose
To evaluate in vivo imaging parameters for summarizing brain involvement in HIV infection.
Materials and Methods
A multiparametric neuroimaging protocol was implemented at 1.5 Tesla in 10 HIV+ and 24 controls. Various summary parameters were calculated based on Diffusion Tensor Imaging (DTI), Magnetization Transfer imaging (MT) and automated brain volumetry. The magnitude of the difference, as well as the between-group discrimination, was determined for each measure. Bivariate correlations were computed and redundancy among imaging parameters was examined by principal factor analysis.
Results
Significant or nearly significant differences were found for most measures. Large Cohen’s D effect sizes were indicated for mean diffusivity (MD), fractional anisotropy (FA), magnetization transfer ratio (MTR) and gray matter volume fraction (GM). Between-group discrimination was excellent for FA and MTR and acceptable for MD. Correlations among all imaging parameters could be explained by three factors, possibly reflecting general atrophy, neuronal loss, and alterations.
Conclusion
This investigation supports the utility of summary measurements of brain involvement in HIV infection. The findings also support assumptions concerning the enhanced sensitivity of DTI and MT to atrophic as well as alterations in the brain. These findings are broadly generalizable to brain imaging studies of physiological and pathological processes.
Keywords: HIV, neuroAIDS, DTI, MT, Brain Volumetry
INTRODUCTION
Individuals infected with HIV are at considerable risk of brain injury and cognitive deterioration, and these neurological complications have significant impact on survival (Sevigny et al., 2007). Ongoing injury to the brain, however, may be clinically silent for indefinite periods and damage may be irreversible by the time symptoms present. Quantitative imaging strategies such as Diffusion Tensor Imaging (DTI), Magnetization Transfer Imaging (MT) and brain segmentation have been used in efforts to clarify the nature of the injury to the brain and to determine factors associated with increased risk. For example, aggregate microstructural brain alterations can be derived with Diffusion Tensor Imaging (DTI), which exploits the random translational movements of water molecules to probe tissue at a level approximating cellular dimensions (Basser et al., 1996). DTI measurements differ in HIV+ and control subjects (Chen et al., 2009; Filippi et al., 2001; Gongvatana et al., 2009; Pfefferbaum et al., 2007, 2009; Pomara et al., 2001; Ragin et al., 2004, 2005; Stbbins et al., 2007; Thurnher et al., 2005; Wu et al., 2006) and these measures correlate with cognitive deficits (Gongvatana et al., 2009; Ragin et al., 2004, 2005; Wu et al., 2006). Magnetization transfer (MT) imaging has been used to quantify pathologic changes in macromolecules due to tissue injury and destruction (van Buchem et al., 1999). MT measures differ in HIV+ from control subjects and correlate with cognitive impairment (Ge et al., 2003; Ragin et al., 2004; Wu et al., 2008). Automated brain segmentation algorithms can be used to derive volume fractions of gray matter, white matter and cerebrospinal fluid within the individual cranial cavity, as well as parenchymal and ventricular volumes relative to normative population brain size (Smith et al., 2002, 2004; Zhang et al., 2001). The volumetric measurements derived with these strategies have been determined to be robust and accurate in simulation studies against known tissue volumes (Smith et al., 2002, 2004; Zhang et al., 2001). Volumetric strategies have been used to investigate brain injury in HIV infection e.g. (Thompson et al., 2005, 2006).
The summary measurements that can be derived with quantitative imaging strategies represent promising tools for identifying factors associated with HIV neurological outcome and for evaluating interventions aimed at preservation of the brain and cognitive function. It is not clear, however, which summary measure is the most sensitive to HIV induced neuropathological changes and the relationship between the different parameters is not well understood. This is problematic for reconciling findings based on different quantitative MR parameters and for designing clinical studies. This investigation specifically focuses on which of several available quantitative MR sequences is most sensitive in discriminating HIV and control subjects for informing studies of neurological outcome.
A multiparametric imaging protocol was implemented that included DTI (Basser et al., 1996), MT (Wolff and Balaban, 1994), as well as anatomic imaging. The DTI data were used to calculate whole brain fractional anisotropy (FA) and mean diffusivity (MD). The MT data were used to derive the magnetization transfer ratio (MTR). Segmentation strategies were used to determine volume fractions of white matter (WM), gray matter (GM), and cerebrospinal fluid (CSF), as well as normalized brain parenchyma volume (NBPV) and normalized ventricular volume (NVV) based on the anatomic images. These measurements were compared in HIV+ and control subjects. Patterns of relationships between the summary measurements and with important clinical status markers were also examined.
MATERIALS AND METHODS
Subjects
This study included 10 well-characterized subjects who were seropositive as confirmed by ELISA and Western blot (age: 52.7±6.6; 8 males, 2 females; education: 15.5±2.6 years) and 24 healthy control subjects (age: 48.5±9.8; 16 males, 8 females; education: 16.4±2.9 years). Groups were not significantly different in age or education. All HIV+ subjects were in advanced infection (meeting criteria for AIDS) and were on antiretroviral regimens. Absolute CD4+ cell counts ranged from 50 to 777/mm3. Plasma HIV RNA ranged from undetectable to 55,300 copies/mL. Control subjects were healthy volunteers, without history of neurologic illness. While CD4+ cell counts can be obtained for normal control subjects, plasma HIV RNA is a measure of viral replication in blood, and not detected in HIV negative subjects. Study exclusion criteria included history of neurological disorder, stroke, head trauma, opportunistic CNS infection, psychosis or MR contraindication. The study was approved by the institutional review board and all subjects provided written informed consent.
MRI and image processing
MR examinations were performed on a 1.5T twinspeed unit (GE, Milwaukee, USA) with high performance gradients using a quadrature birdcage headcoil for RF transmission and signal reception. T2- and proton-density-weighted images were acquired using dual spin echo sequences, with repetition time of TR=3300 msec, echo times of TE=20 msec and 90 msec. Other parameters were as follows: FA: 90°, matrix size: 256×256, FOV: 24×18 cm, NEX=2, slice thickness/gap: 3.5/0, 42 contiguous slices covering whole brain. DTI was performed with an echo planar sequence and bandwidth of ±125kHz. A b=0 reference image and six diffusion-weighted images with a b-value of 1000sec/mm2 were acquired at each slice location (FOV: 24cm, matrix size: 128×128, TR/NEX: 6200/4). MT images were obtained with a fast gradient echo (TR=1000ms/flip angle= 20 degree, FOV = 24cm, matrix size: 256×256)) sequence repeated with (Ms) and without (Mo) an off-resonant saturation pulse (frequency=1200 HZ/duration= 16 msec). The entire brain was imaged using 22 contiguous 7-mm axial sections for both DTI and MT.
Image processing
Quantitative image analysis was performed off-line. DTI measurements were calculated using customized image-processing routines written in MATLAB (Mathworks, Natick, MA). The technical details and reliability of customized routine were presented previously (Ragin et al., 2004; Wu et al., 2006). The background noise was first segmented from tissue by applying an automated thresholding technique to the diffusion-weighted images. This also removed voxels containing predominantly CSF which have low intensity on diffusion-weighted images. Extracranial structures were then excluded by segmentation algorithms based on thresholding. Manual editing was applied to refine the skull stripping process. The eigenvalues (λ1, λ2, λ3) of the diffusion tensor D were calculated for each remaining brain voxel. Mean diffusivity (MD) and fractional anisotropy (FA) were derived according to standard equations (Basser et al., 1996).
Mean values of MD (in units of 10−3 mm2/s) and of FA (which is dimensionless, ranging from 0 to 1) were then calculated for the whole brain histograms (i.e. across all nonmasked voxels). Similarly, MTR maps were constructed based on data with and without the saturation pulse (van Buchem et al., 1999) and whole brain MTR histograms of the intracranial brain tissue were constructed offline using custom software. CSF was segmented from brain parenchyma using the MT image.
Automated image analysis algorithms developed at Oxford University were used to determine the volumetric measurements (Smith et al., 2002; Zhang et al., 2001). Fully Automated Segmentation Tool (FAST) was used to calculate volumes of GM, WM and CSF, which were then divided by the total volume of the intracranial cavity to calculate the volume fractions. We derived two measures from SienaX, the normalization process differs for FAST, based on FMRIB (Analysis Group, FMRIB, Oxford, UK), when extracting identical tissue types, such as the GM, WM and CSF, FAST is more accurate than SienaX. SienaX was used to determine NBPV and NVV relative to normative population values.
Statistical Analysis
The primary variables for analysis included MD, FA, and MTR determined for whole brain as defined above. Other quantitative MR measurements included volume fractions of GM, WM, CSF, NBPV and NVV derived using segmentation strategies. For all variables, distributional assumptions were evaluated prior to analysis using Shapiro-Wilk test. Differences between groups were determined using parametric two-sample Student’s t-test. Cohen’s D effect size was computed as the mean difference between HIV and control divided by the common standard deviation. Area under ROC (Receiver Operating Characteristic) curve (AUC) was also computed to assess the imaging parameters for differentiating between HIV and control groups, using logistic regression. Relationships between variables of interest were determined using Pearson’s correlations (r) or Spearman’s rank correlations (rs) given whether bivariate normality assumption was fulfilled, and p values were false discovery rate (FDR) adjusted. Principal factor analysis was conducted with all eight imaging parameters to determine whether the variations could be explained by a few underlying ‘factors’, or a group of measures of these imaging parameters move up or down together. For the factor analysis, squared multiple correlations were used for prior communality estimates and factor loadings were rotated using varimax. To assess goodness of fit of the common factor model, residual correlations and Kaiser’s measure of sampling adequacy (MSA) were used. Multiple logistic regression models were constructed in order to evaluate whether the discrimination between HIV and control groups improved when common factors were included as predictors in the model, by reporting AUC. Correlations of quantitative whole-brain MR measures with markers of systemic disease progression including CD4+ cell count, or plasma HIV RNA, were assessed by computing Pearson’s correlation coefficients.
All statistical tests were two tailed and p<0.05 was considered statistically significant. All analyses were executed with SAS 9.2 (Ca NC). ry,
RESULTS
Descriptive statistics for the imaging measurements and group comparisons are presented in Table 1. For both HIV and control groups, the assumption of normality was satisfied for all imaging parameters.
Table 1.
Imaging Parameters Comparison between HIV and Control
| N | Mean | SD | p value | ES (95% CI) | AUC | ||
|---|---|---|---|---|---|---|---|
| DTI | |||||||
| MD | HIV | 10 | 1.01 | 0.07 | 0.026 | 0.82 (0.80–0.85) | 0.73 |
| Control | 24 | 0.95 | 0.06 | ||||
| FA | HIV | 10 | 0.24 | 0.01 | 0.007 | 0.98 (0.97–0.98) | 0.80 |
| Control | 24 | 0.25 | 0.01 | ||||
|
| |||||||
| MT | |||||||
| MTR | HIV | 10 | 0.47 | 0.01 | 0.006 | 1.04 (1.03–1.04) | 0.80 |
| Control | 18 | 0.48 | 0.01 | ||||
|
| |||||||
| Segmentation | |||||||
| GM | HIV | 10 | 0.39 | 0.03 | 0.025 | 0.83 (0.82–0.84) | 0.60 |
| Control | 24 | 0.41 | 0.02 | ||||
| WM | HIV | 10 | 0.30 | 0.02 | 0.075 | 0.67 (0.66–0.67) | 0.59 |
| Control | 24 | 0.31 | 0.01 | ||||
| CSF | HIV | 10 | 0.19 | 0.03 | 0.136 | 0.56 (0.56–0.57) | 0.56 |
| Control | 24 | 0.18 | 0.02 | ||||
| NBPV | HIV | 10 | 0.79 | 0.03 | 0.045 | 0.75 (0.73–0.76) | 0.59 |
| Control | 24 | 0.82 | 0.04 | ||||
| NVV | HIV | 10 | 0.04 | 0.01 | 0.107 | 0.61 (0.60–0.61) | 0.58 |
| Control | 24 | 0.03 | 0.01 | ||||
SD: standard deviation; ES: Cohen’s D effect size=mean difference/common standard deviation; CI: confidence interval; AUC: area under the ROC (Receiver Operating Characteristic) curve;
DTI: Diffusion Tensor Imaging; MT: Magnetization Transfer Imaging; FA: fractional anisotropy; MD: mean diffusivity; GM: gray matter; WM: white matter; CSF: cerebrospinal fluid; NBPV: norm brain parenchymal volume; NVV: norm ventricular volume.
Initially the quantitative imaging measures were compared in HIV and control groups. For the DTI parameters, mean FA measures were significantly reduced in the HIV subjects compared to controls (0.24 vs. 0.26, p=0.007). For MD, the mean was significantly increased in the HIV subjects (1.01 vs. 0.95, p=0.026). MTR measures were significantly reduced in the HIV subjects (0.47 vs. 0.48, p=0.006). GM was significantly reduced in the HIV subjects (0.39 vs. 0.41, p=0.025), WM and CSF did not differ in the HIV and control groups. NBPV was significantly reduced in the HIV subjects (0.79 vs. 0.82, p=0.045), NVV did not differ in the two groups.
Table 1 presents descriptive statistics and mean differences between groups, Large effect sizes (i.e. greater than 0.8) (Cohen, 1988) were indicated for MD, FA, MTR and GM. Examination of AUC, indicated discrimination between groups was excellent for MTR (0.80) and acceptable (greater than 0.7) for both MD and for FA (Hosmer and Lemeshow, 2000).
Numerous significant correlations were identified between the studied parameters (Table 2). Specifically, MD was significantly correlated with all other MR measurements.
Table 2.
Pearson’s Correlation Matrix between Imaging Parameters
| MD | FA | MTR | GM | WM | CSF | NBPV | |
|---|---|---|---|---|---|---|---|
| FA | −0.39 | ||||||
| p value | 0.034 | ||||||
| n | 34 | ||||||
|
| |||||||
| MTR | −0.50 | 0.46 | |||||
| p value | 0.019 | 0.033 | |||||
| n | 25 | 25 | |||||
|
| |||||||
| GM | −0.75 | 0.20 | 0.53 | ||||
| p value | <.001 | 0.299 | 0.013 | ||||
| n | 33 | 33 | 25 | ||||
|
| |||||||
| WM | −0.53 | 0.50 | 0.32 | 0.22 | |||
| p value | 0.005 | 0.006 | 0.172 | 0.270 | |||
| n | 33 | 33 | 25 | 34 | |||
|
| |||||||
| CSF | 0.85 | −0.18 | −0.28 | −0.80 | −0.59 | ||
| p value | <.001 | 0.339 | 0.235 | <.001 | 0.001 | ||
| n | 33 | 33 | 25 | 34 | 34 | ||
|
| |||||||
| NBPV | −0.76 | 0.21 | 0.13 | 0.52 | 0.50 | −0.74 | |
| p value | <.001 | 0.285 | 0.551 | 0.005 | 0.006 | <.001 | |
| n | 33 | 33 | 25 | 34 | 34 | 34 | |
|
| |||||||
| NVV | 0.69 | −0.16 | −0.11 | −0.49 | −0.42 | 0.65 | −0.70 |
| p value | <.001 | 0.411 | 0.610 | 0.006 | 0.023 | <.001 | <.001 |
| n | 33 | 33 | 25 | 34 | 34 | 34 | 34 |
FA: fractional anisotropy; MD: mean diffusivity; GM: gray matter; WM: white matter; CSF: cerebrospinal fluid; NBPV: norm brain parenchymal volume; NVV: norm ventricular volume.
Principal factor analysis indicated that variation between the eight imaging parameters was retained within three factors (Table 3). Variables loading on the first factor (accounting for 72.5% of the common variance) included MD, WM, CSF, NBPV and NVV. Only a single imaging parameter, GM, loaded on the second factor (15.6% of the common variance). FA and MTR loaded on the third factor (14.0% of the common variance). Residual correlations were low (0.005–0.08); Kaiser’s MSA was 0.70. AUC from the logistic regression on FA and MTR was 0.84, and AUC from the logistic regression on MD, WM, CSF, NBPV and NVV was 0.80.
Table 3.
Factor loadings (Varimax) for Imaging Parameters
| Factor 1 | Factor 2 | Factor 3 | Communalities | |
|---|---|---|---|---|
| MD | 0.65 | −0.57 | −0.41 | 0.91 |
| FA | −0.24 | 0.11 | 0.68 | 0.53 |
| MTR | 0.03 | 0.45 | 0.64 | 0.62 |
| GM | −0.28 | 0.88 | 0.15 | 0.88 |
| WM | −0.63 | −0.14 | 0.59 | 0.77 |
| CSF | 0.79 | −0.49 | −0.11 | 0.88 |
| NBPV | −0.78 | 0.16 | 0.14 | 0.66 |
| NVV | 0.68 | −0.16 | −0.13 | 0.51 |
|
| ||||
| Proportion of total variance | 0.73 | 0.16 | 0.14 | 1.02 |
FA: fractional anisotropy; MD: mean diffusivity; GM: gray matter; WM: white matter; CSF: cerebrospinal fluid; NBPV: normalized brain parenchymal volume; NVV: normalized ventricular volume.
None of the quantitative whole-brain MR measures were significantly correlated with markers of systemic disease progression including CD4+ cell count, or plasma HIV RNA.
DISCUSSION
The noninvasive measurements that can be derived in vivo with different quantitative neuroimaging strategies reflect empirical biophysical characteristics of the interrogated tissue. The meaning of these measurements with respect to brain injury, however, is necessarily based on inference. Quantitative strategies are predicated on different underlying physics rationales and endogenous contrast mechanisms. The acquisition sequences and image processing methodologies also differ. Summary measurements may reflect changes occurring at different levels in the brain. Segmentation strategies, for example, yield volumetric measurements reflecting gross structural changes based on voxel-wise signal intensity classification. DTI indices reflect microstructural changes based on molecular diffusion behavior, whereas MTR is based on the relative macromolecular magnetization transfer. While it is generally feasible and advantageous to acquire information from multiple imaging sequences in an individual neuroradiological examination, the relative sensitivity and the degree of relationship between these summary measures is not well understood.
In this evaluation of summary brain status measurements, significant (MD, FA, MTR, GM, NBPV) or nearly significant (WM and NVV) differences between HIV and control subjects were found for all measures except for CSF. These findings are consistent with other studies indicating that quantitative imaging measures discriminate HIV and control groups (Chen et al., 2009; Filippi et al., 2001; Gongvatana et al., 2009; Pfefferbaum et al., 2007, 2009; Pomara et al., 2001; Ragin et al., 2004, 2005; Stbbins et al., 2007; Thurnher et al., 2005; Wu et al., 2006). When the magnitude of the between-group difference was examined, large effect sizes (>0.8) (Cohen, 1988) were noted for the microstructural (MD, FA) and macromolecular (MTR) measurements, as well as for GM volume fraction. Other volumetric measurements generally demonstrated medium effect sizes ranging from .56 for CSF to .75 for NBPV.
The measures were also examined in an ROC analysis to compare the diagnostic accuracy. The area under the curve (AUC) of the plotted 1-specificity against sensitivity characterizes the intrinsic accuracy for classifying subjects as HIV+ or control. Excellent discrimination between HIV and control subjects for FA and for MTR (AUC ≥0.8) and acceptable discrimination for MD (AUC ≥0.7) (Hosmer and Lemeshow, 2000) were indicated. Lower AUC values were noted for the volumetric measures.
Bivariate correlations were calculated in the entire study sample to determine the relationship between the summary measures. This analysis indicated correlations between the microstructural (MD and FA) and the macromolecular MTR measures. Further examination of relationships between the microstructural, macromolecular and volumetric measures indicated that FA was correlated only with white matter and MTR was correlated only with GM volume fraction. MD, however, was correlated with all studied imaging parameters.
Factor analysis was used to characterize redundancy among the imaging measures and to examine the premise that the parameters reflect a smaller number of latent biological factors. While bivariate Pearson’s correlation reflects the marginal correlations, factor analysis groups associated variables into a common factor independent of other factors. Low (0.005–0.08) residual correlations and 0.70 Kaiser’s MSA obtained from our factor analysis suggested good determination of common factors. Variation among imaging parameters could be explained by three factors, possibly reflecting general atrophy (WM, CSF, NBPV, NVV and MD), neuronal loss (GM), and alterations in tissue integrity (FA and MTR). The latter factor, which grouped FA and MTR suggesting they were more associated with each other than with other imaging summary measures, parallels the effect size and AUC analyses in which excellent discrimination for both FA and MTR were indicated. One possibility is that whereas segmentation/volumetric measurements reflect irreversible tissue loss, FA and MTR are sensitive to, as well as atrophic alterations. Because MD reflects changes occurring both in gray and white matter, this measurement may be more aligned with general atrophy. Notably, GM volume fraction loaded onto a single factor. Of the imaging measurements, this may be the most specific for neuronal loss.
The lack of relationship between the imaging summary measures and clinical status markers, including CD4+ cell count, or plasma HIV RNA, is not surprising. Markers of systemic disease progression in HIV infection may not correspond to ongoing changes in viral reservoirs and anatomic sanctuaries such as the brain and the bone marrow (McArthur et al., 2005).
The DTI measurements considered here, which were based on the standard 6 directions (Escolar et al., 2009; Chen et al., 2006), may be less sensitive than those based on higher number of diffusion directions and with higher spatial resolution. However, for the whole brain measurements, slice thickness-related partial volume effects should be minimal relative to more localized region-of-interest approaches.
In summary, this investigation evaluated parameters derived with DTI (MD and FA), MT (MTR) and volumetry (GM, WM, CSF, NBPV and NVV), as brain status measurements in HIV+ and control subjects. FA and MTR appeared to be the most sensitive to cumulative brain injury in HIV infection. While the latter measure has not been used extensively in HIV infection (Wu et al., 2008), in this study MTR compared favorably to FA as a summary brain measure. Other factors than the sensitivity of the measurements may also need to be weighed in planning MR protocols, particularly for multicenter and longitudinal clinical studies. DTI and MT sequences require considerably longer acquisition time, careful parameter specification and implementation and more extensive post-processing; whereas volumetric measurements can be generated with automated image analysis tools. The relatively small sample precluded evaluation of factor scores or combinations of parameters. In addition, it is important to appreciate that HIV infection is a long-term chronic process and subjects in this investigation were in advanced stages (AIDS). Further studies are necessary to evaluate combinations of parameters and to determine whether localized, rather than summary, measurements enhance the sensitivity to subtle, ongoing changes in the brain in early, asymptomatic periods of infection. A more comprehensive understanding of the information conferred by quantitative MR parameters will inform the design and interpretation of multiparametric imaging studies.
Figure 1.
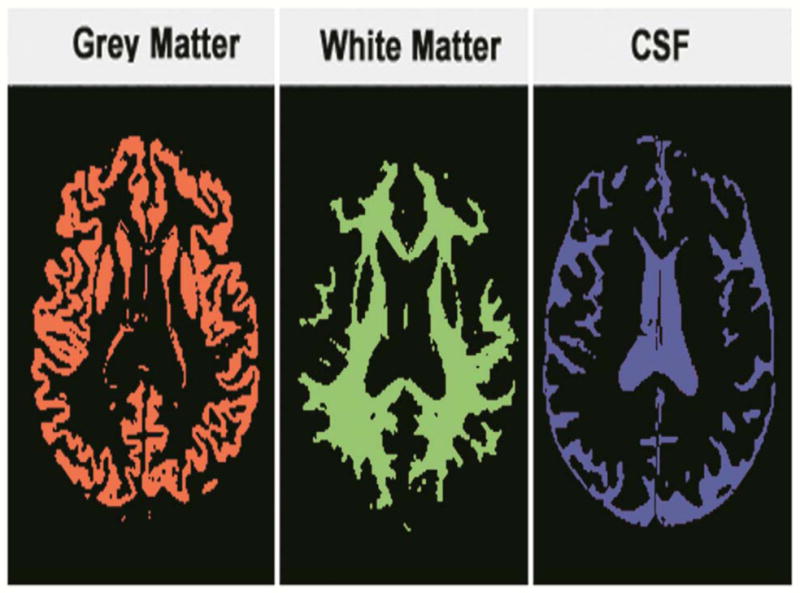
Brain segmentation results for grey matter, white matter and CSF, for deriving the volume fractions
Acknowledgments
The authors thank Linda Reisberg, Pippa Storey, Rachel Scheidegger, Christine O’Brien and the NEAD consortium.
Funding: This work was supported by National Institutes of Health [grant numbers MH66705, MH080636, NS004807(JCM) and NS049465 (JCM)].
Footnotes
Conflicts of Interest: None.
The authors had full access to all the study data and final responsibility for the decision to submit for publication.
Publisher's Disclaimer: This is a PDF file of an unedited manuscript that has been accepted for publication. As a service to our customers we are providing this early version of the manuscript. The manuscript will undergo copyediting, typesetting, and review of the resulting proof before it is published in its final citable form. Please note that during the production process errors may be discovered which could affect the content, and all legal disclaimers that apply to the journal pertain.
References
- Basser PJ, Pierpaoli C. Microstructural and physiological features of tissues elucidated by quantitative-diffusion-tensor MRI. J Magn Reson B. 1996;111(3):209–219. doi: 10.1006/jmrb.1996.0086. [DOI] [PubMed] [Google Scholar]
- Chen B, Guo H, Song AW. Correction for direction-dependent distortions in diffusion tensor imaging using matched magnetic field maps. Neuroimage. 2006 Mar;30(1):121–9. doi: 10.1016/j.neuroimage.2005.09.008. [DOI] [PubMed] [Google Scholar]
- Chen Y, An H, Zhu H, Smith JK, Hall C, Bullitt E, Shen D, Lin W. White matter abnormalities revealed by diffusion tensor imaging in non-demented and demented HIV+ patients. Neuroimage. 2009;47(4):1154–1162. doi: 10.1016/j.neuroimage.2009.04.030. [DOI] [PMC free article] [PubMed] [Google Scholar]
- Cohen J. Statistical Power Analysis for the Behavioral Sciences. Hillsdale, NJ: Erlbaum; 1988. pp. 24–27. [Google Scholar]
- Escolar ML, Poe MD, Smith JK, Gilmore JH, Kurtzberg J, Lin W, Styner M. Diffusion tensor imaging detects abnormalities in the corticospinal tracts of neonates with infantile Krabbe disease. AJNR Am J Neuroradiol. 2009 May;30(5):1017–21. doi: 10.3174/ajnr.A1476. [DOI] [PMC free article] [PubMed] [Google Scholar]
- Ge Y, Kolson DL, Babb JS, Mannon LJ, Grossman RI. Whole brain imaging of HIV-infected patients: quantitative analysis of magnetization transfer ratio histogram and fractional brain volume. AJNR Am J Neuroradiol. 2003;24(1):82–87. [PMC free article] [PubMed] [Google Scholar]
- Gongvatana A, Schweinsburg BC, Taylor MJ, Theilmann RJ, Letendre SL, Alhassoon OM, Jacobus J, Woods SP, Jernigan TL, Ellis RJ, Frank LR, Grant I. White matter tract injury and cognitive impairment in human immunodeficiency virus-infected individuals. J Neurovirol. 2009;15(2):187–195. doi: 10.1080/13550280902769756. [DOI] [PMC free article] [PubMed] [Google Scholar]
- Filippi CG, Ulug AM, Ryan E, Ferrando SJ, van Gorp W. Diffusion tensor imaging of patients with HIV and normal-appearing white matter on MR images of the brain. AJNR Am J Neuroradiol. 2001;22(2):277–283. [PMC free article] [PubMed] [Google Scholar]
- Hosmer D, Lemeshow S. Applied Logistic Regression. Hoboken NJ: John Wiley & Sons, Inc; 2000. p. 192. [Google Scholar]
- McArthur JC, Brew BJ, Nath A. Neurological complications of HIV infection. Lancet Neurol. 2005;4(9):543–555. doi: 10.1016/S1474-4422(05)70165-4. [DOI] [PubMed] [Google Scholar]
- Pfefferbaum A, Rosenbloom MJ, Adalsteinsson E, Sullivan EV. Diffusion tensor imaging with quantitative fibre tracking in HIV infection and alcoholism comorbidity: synergistic white matter damage. Brain. 2007;130(Pt 1):48–64. doi: 10.1093/brain/awl242. [DOI] [PubMed] [Google Scholar]
- Pfefferbaum A, Rosenbloom MJ, Rohlfing T, Kemper CA, Deresinski S, Sullivan EV. Frontostriatal fiber bundle compromise in HIV infection without dementia. AIDS. 2009;23(15):1977–1985. doi: 10.1097/QAD.0b013e32832e77fe. [DOI] [PMC free article] [PubMed] [Google Scholar]
- Pomara N, Crandall DT, Choi SJ, Johnson G, Lim KO. White matter abnormalities in HIV-1 infection: a diffusion tensor imaging study. Psychiatry Res. 2001;106(1):15–24. doi: 10.1016/s0925-4927(00)00082-2. [DOI] [PubMed] [Google Scholar]
- Ragin AB, Storey P, Cohen BA, Edelman RR, Epstein LG. Disease burden in HIV-associated cognitive impairment: a study of whole-brain imaging measures. Neurology. 2004;63(12):2293–2297. doi: 10.1212/01.wnl.0000147477.44791.bd. [DOI] [PMC free article] [PubMed] [Google Scholar]
- Ragin AB, Wu Y, Storey P, Cohen BA, Edelman RR, Epstein LG. Diffusion tensor imaging of subcortical brain injury in patients infected with human immunodeficiency virus. J Neurovirol. 2005;11(3):292–298. doi: 10.1080/13550280590953799. [DOI] [PMC free article] [PubMed] [Google Scholar]
- Sevigny JJ, Albert SM, McDermott MP, Schifitto G, McArthur JC, Sacktor N, Conant K, Selnes OA, Stern Y, McClernon DR, Palumbo D, Kieburtz K, Riggs G, Cohen B, Marder K, Epstein LG. An evaluation of neurocognitive status and markers of immune activation as predictors of time to death in advanced HIV infection. Arch Neurol. 2007;64(1):97–102. doi: 10.1001/archneur.64.1.97. [DOI] [PubMed] [Google Scholar]
- Smith SM, Zhang Y, Jenkinson M, Chen J, Matthews PM, Federico A, De Stefano N. Accurate, robust, and automated longitudinal and cross-sectional brain change analysis. Neuroimage. 2002;17(1):479–489. doi: 10.1006/nimg.2002.1040. [DOI] [PubMed] [Google Scholar]
- Smith SM. Overview of fMRI analysis. Br J Radiol 77 Spec No. 2004;2:S167–175. doi: 10.1259/bjr/33553595. [DOI] [PubMed] [Google Scholar]
- Stebbins GT, Smith CA, Bartt RE, Kessler HA, Adeyemi OM, Martin E, Cox JL, Bammer R, Moseley ME. HIV-associated alterations in normal-appearing white matter: a voxel-wise diffusion tensor imaging study. J Acquir Immune Defic Syndr. 2007;46(5):564–573. doi: 10.1097/qai.0b013e318159d807. [DOI] [PubMed] [Google Scholar]
- Thompson PM, Dutton RA, Hayashi KM, Toga AW, Lopez OL, Aizenstein HJ, Becker JT. Thinning of the cerebral cortex visualized in HIV/AIDS reflects CD4+ T lymphocyte decline. Proceedings of the National Academy of Sciences of the United States of America. 2005;102(43):15647–15652. doi: 10.1073/pnas.0502548102. [DOI] [PMC free article] [PubMed] [Google Scholar]
- Thompson PM, Dutton RA, Hayashi KM, Lu A, Lee SE, Lee JY, Lopez OL, Aizenstein HJ, Toga AW, Becker JT. 3D mapping of ventricular and corpus callosum abnormalities in HIV/AIDS. Neuroimage. 2006;31(1):12–23. doi: 10.1016/j.neuroimage.2005.11.043. [DOI] [PubMed] [Google Scholar]
- Thurnher MM, Castillo M, Stadler A, Rieger A, Schmid B, Sundgren PC. Diffusion-tensor MR imaging of the brain in human immunodeficiency virus-positive patients. AJNR Am J Neuroradiol. 2005;26(9):2275–2281. [PMC free article] [PubMed] [Google Scholar]
- van Buchem MA, McGowan JC, Grossman RI. Magnetization transfer histogram methodology: its clinical and neuropsychological correlates. Neurology. 1999;53(5 Suppl 3):S23–28. [PubMed] [Google Scholar]
- Wolff SD, Balaban RS. Magnetization transfer imaging: practical aspects and clinical applications. Radiology. 1994;192(3):593–599. doi: 10.1148/radiology.192.3.8058919. [DOI] [PubMed] [Google Scholar]
- Wu Y, Storey P, Cohen BA, Epstein LG, Edelman RR, Ragin AB. Diffusion alterations in corpus callosum of patients with HIV. AJNR Am J Neuroradiol. 2006;27(3):656–660. [PMC free article] [PubMed] [Google Scholar]
- Wu Y, Storey P, Carrillo A, Saglamer C, Cohen BA, Epstein LG, Edelman RR, Ragin AB. Whole brain and localized magnetization transfer measurements are associated with cognitive impairment in patients infected with human immunodeficiency virus. AJNR Am J Neuroradiol. 2008;29(1):140–145. doi: 10.3174/ajnr.A0740. [DOI] [PMC free article] [PubMed] [Google Scholar]
- Zhang Y, Brady M, Smith S. Segmentation of brain MR images through a hidden Markov random field model and the expectation-maximization algorithm. IEEE Transactions on Medical Imaging. 2001;20(1):45–57. doi: 10.1109/42.906424. [DOI] [PubMed] [Google Scholar]