

Abstract
Accurate simulation of complex lipid bilayers has long been a goal in condensed phase molecular dynamics (MD). Structure and function of membrane-bound proteins are highly dependent on the lipid bilayer environment and are challenging to study through experimental methods. Within Amber, there has been limited focus on lipid simulations, although some success has been seen with the use of the General Amber Force Field (GAFF). However, to date there are no dedicated Amber lipid force fields. In this paper we describe a new charge derivation strategy for lipids consistent with the Amber RESP approach, and a new atom and residue naming and type convention. In the first instance, we have combined this approach with GAFF parameters. The result is LIPID11, a flexible, modular framework for the simulation of lipids that is fully compatible with the existing Amber force fields. The charge derivation procedure, capping strategy and nomenclature for LIPID11, along with preliminary simulation results and a discussion of the planned long-term parameter development are presented here. Our findings suggest that Lipid11 is a modular framework feasible for phospholipids and a flexible starting point for the development of a comprehensive, Amber-compatible lipid force field.
Keywords: Computer modeling, Molecular dynamics, Force field, Lipid bilayer, Membranes
INTRODUCTION
Biological processes in the human body are dependent on highly specific molecular interactions. The vast majority of the interactions take place in compartments within the cell, and an understanding of the behavior of the membranes that compartmentalize and enclose the cell is therefore critical for rationalizing these processes. Biological membranes are complex structures formed mostly by lipids and proteins. For this reason lipid bilayers have received a lot of attention both computationally and experimentally for many years.1–5 The vital role of cell membranes is underlined by the estimation that over half of all proteins interact with membranes, either transiently or permanently.6 Further, G protein-coupled receptors embedded in the membrane account for 50–60% of present day drug targets, and membrane proteins as a whole make up around 70%.7 Even so, only about 350 unique resolved structures are currently represented in membrane protein databases8–9 compared to approximately 76,000 searchable entries for experimentally derived protein structures in the Protein Data Bank.10 This reflects the difficulties in studying membrane-associated proteins experimentally, making them prime targets for computer simulation.
While there has been considerable effort over many decades to develop and refine protein and nucleic acid force fields for molecular dynamics (MD) simulation, the focus on lipid force fields has been less intense. Traditional protein and nucleic acid force fields11–13 are modular in nature, typically using amino acids and nucleotides as their building blocks. Lipid force fields, though, have traditionally focused on templating specific lipids rather than attempting a modular approach. Extensive work by a number of groups has resulted in a diverse set of lipid force fields. Of the major published force fields for lipid simulation the most widely used all-atom variants are the Charmm force fields,14–17 the latest of which can reproduce a range of lipid bilayer experimental properties to good agreement using the tensionless isothermal-isobaric NPT ensemble.17 For united-atom simulations of lipid bilayers Gromos or OPLS-based force fields18–21 are commonly applied and have also been used successfully.
Given the wide use of the Amber protein and nucleic acid force fields and the ubiquity of lipids, it is somewhat surprising that there have been only limited efforts to develop Amber-compatible lipid force fields. In this paper, we describe a modular framework for lipids termed LIPID11, which was released with Amber 12.22–23 This is the first time a dedicated lipid parameter set has been included as part of the Amber distribution, and it is designed to be fully compatible with the existing Amber force fields. Previously, simulations of lipids in Amber have focused on use of the General Amber Force Field (GAFF)24 to simulate specific membrane lipids. This approach has shown promise in simulations of a range of phospholipid bilayers25–30 and recent work31 has refined these parameters to support simulation in the tensionless NPT ensemble. The goal of the LIPID11 framework is to incorporate what has been learnt from the use of GAFF for lipids and provide a flexible base from which more extensive parameter refinement can be attempted while simplifying the way in which pure lipids and lipid-protein mixtures can be set up, simulated and analyzed within the Amber software.
Lipid Bilayer Simulations
The last decade and a half has seen continuous improvements in the field of MD simulations of lipid bilayers. A recurring issue in membrane simulations and in the early stages of lipid force field developments has been the collapse of the bilayer models into gel-like states above phase transition temperatures while running under constant pressure conditions.20–21,25–26,32–36 In parallel with optimization of the lipid parameters, a means of overcoming this challenge has traditionally been to apply other ensembles than NPT when validating the force fields and simulations against experiment. The x-y cross-sectional area of the membrane was kept constant (NPAT) in the validation and subsequent use of the earlier all-atom Charmm force fields for lipids (C22, C27 and C27r). 14–16,37–39 Hénin and co-workers40 applied the same NPAT ensemble for the C27-UA hybrid force field, in which united-atom acyl chains replaced their all-atom counterparts in POPC. Glycam06, on the other hand, was extended to lipids simulated at fixed volume,41 an approach also used in other recent membrane simulation projects.27,42–43 Both ensembles ensure that the area occupied by each lipid complies with the corresponding experimental value throughout the simulation. The introduction of a surface tension term γ provided the possibility to expand the bilayers to the experimentally determined area per lipid while at the same time allowing for their in-plane area to fluctuate. 44–46 Surface tension is given by the expression
The constant surface tension adds an additional constraint to the normal and tangential pressure components of regular molecular dynamics pressure coupling schemes.46 Since its introduction, the resulting ensemble, referred to as NPγT, has been widely used to satisfactorily model fluid phase phospholipid membranes.25–26,28,34
Gromos-based united-atom force fields have produced fluid bilayers that agree well with experimentally derived structural data even in simulations performed at constant pressure without inclusion of a surface tension term.18,20–21,47 Due to the implicit treatment of aliphatic hydrogens, these force fields also offer the advantage of reduced simulation time, but some argue that full atomic detail is necessary to accurately represent membrane-associated interactions.33,36 However, recent progress has been made in optimizing all-atom parameters for the tension-free NPT ensemble. Both the new Charmm C36 force field17 and modifications to the older C2733 and C27r36 have successfully reproduced the properties of phospholipid membranes in the liquid crystalline state. In addition, a force field has recently been developed by Jämbeck and Lyubartsev for fully saturated phospholipids in the tensionless ensemble.48
The LIPID11 Framework
Given the range of possible combinations of fatty acid tails and head groups encountered in glycerophospholipids of biological interest, we have developed a charge model, atom typing and naming convention designed to be pluggable and flexible in nature in which phospholipids can be built out of simple residue-like building blocks corresponding to head groups and tails. This framework is compatible with the other Amber force fields and the initial version, LIPID11, was released as part of the AmberTools 12.0 package. Commonly used Amber force fields include the ff94, ff99SB, and ff12SB amino acid and nucleic acid force fields,11,49–51 Glycam carbohydrate force force field,52–54 and GAFF general organic force field.24 A listing of the current force fields is available with the Amber software package.22–23
Per the success of others in applying the GAFF force field for lipid simulation25–30 we have, in the first instance, based LIPID11 on GAFF parameters, but with an independent nomenclature for the different residues, atoms and atom types. It uses a modular approach to charge fitting, along with residue capping analogous to the approach used for the amino acids in the protein force fields.55–56 The underlying rationale is multi-faceted. The majority of lipids of biological interest are phospholipids which have the same general structure, consisting of a phosphate-containing polar head group and two long-chain fatty acids esterified to a glycerol backbone. Thus a phospholipid can be regarded as a structure made up of a few basic building blocks, as is the case in proteins, nucleic acids and carbohydrates. Indeed, the aliphatic tails of phospholipids have routinely been parameterized independently of the head groups, where properties of liquid alkanes and alkenes have comprised the target data.14–15,18,20 Similarly, small model molecules are typically used for parameterizing fragments of the head group.17,20 Several studies, employing different force fields, have shown that parameters for aliphatic tails are transferable between various phosphatidylcholine lipids and between the sn-1 and sn-2 tail positions.17,20,36 Transferability between phosphatidylcholine (PC) and phosphatidylethanolamine (PE) lipids has also been demonstrated.17 Conversely, the same head group parameters were used with success in the simulation of different PC lipids.17,20,36 Furthermore, Klauda et al.17 reported that the hydrocarbon chains of dipalmitoyl-phosphatidylcholine (DPPC) were affected minimally in simulations after modifications to torsional parameters in the head group. All these observations suggest that phospholipids can be split into ‘modules’ for separate parameterization and that the resulting head group and tail residues can be combined and reassembled as required before simulation. We have exploited this along with our development of a charge derivation scheme that is compatible with the modular nature of phospholipids. The design of our approach is such that it can be easily extended to include additional head groups and tails.
It is our ultimate intention to utilize this framework to simplify the simulation of lipids in Amber and to form the basis by which, in collaboration with other groups, the parameters for lipid simulation in Amber can be refined.
METHODS
In developing LIPID11 our goal has been to produce a versatile framework for phospholipid force field development that is fundamentally modular in nature. The tools for constructing MD topology and coordinate files for Amber (xLEaP and tLEaP23) are designed around building blocks consisting of amino acid and nucleotide residues. This framework has performed well for protein and DNA/RNA simulations and has also been applied to carbohydrates.52 The code traverses a PDB file and automatically links the tail atom of one residue to the head of the next. TER cards control the termination of the polypeptide chain. This strategy, coupled with the capped RESP charge fitting procedure55–56 of the original Amber force field parameterizations, has allowed the topology sets of these force fields to be reduced to individual residues. The structure of phospholipids and other types of membrane lipids clearly lend themselves to a similar approach although it is necessary to carefully consider conventions for atom typing, charge derivation procedure and the linkage points of individual heads and tails. We describe a compatible approach to the modularization of lipids, along with justification for each step in the sections that follow.
1. Atom types and parameters
Our initial aims have been to develop the underlying modular framework rather than attempting to embark on a comprehensive reparameterization of lipids. For this reason and given the fact that others have had success using the General Amber Force Field (GAFF)24 for lipid simulation,25–30 we chose to base the initial LIPID11 framework parameter set (excluding the charges) on GAFF. While lipid simulations utilizing GAFF have typically required an applied surface tension to give satisfactory agreements with experiment, GAFF was considered to be a promising starting point for the development of a dedicated phospholipid force field in Amber. Indeed, Gould et al has recently shown31 that a simple reparameterization of the Lennard-Jones terms coupled with an automated refinement of key dihedral parameters in the lipid tails can negate the need for an applied surface tension. While GAFF parameters were used for the majority of groups (Table 1), it was determined that the Glycam force field52 was more appropriate for the inositol ring of the phosphatidylinositol head group, considering that it is a carbohydrate (Table 2). Electrostatic and van der Waals interactions are scaled by 2.0 and 1.2 (respectively) in GAFF and the standard Amber protein force fields. In Glycam, 1–4 interactions are not scaled. Accordingly, 1–4 interactions for inositol are scaled by 1.0 while the parameters adapted from GAFF have standard 1–4 scaling for the lipid parameter set. While we have initially employed GAFF van der Waals and bonding parameters we have designed the atom typing assignments of the framework such that future revisions can individually optimize specific parameters without affecting the original GAFF force field. The atom type nomenclature we have developed along with the descriptions of each type are presented in Tables 1 and 2. To differentiate LIPID11 framework atom types, and thus parameters, from the other Amber force fields, the atom type names consist of a lower case and an upper case character. GAFF, on the other hand, uses all lower case while Glycam and the other Amber force fields use all upper case. The first, lower case letter corresponds to the element the atom type represents, whilst the second character was chosen arbitrarily.
Table 1.
LIPID11 naming for atom types originating from GAFF (General Amber Force Field).
| GAFF | LIPID11 | Description |
|---|---|---|
| c3 | cA | sp3 carbon |
| c2 | cB | aliphatic sp2 carbon |
| c | cC | carbonyl sp2 carbon |
| o | oC | carbonyl sp2 oxygen in ester group (i.e. C=O) |
| os | oS | sp3 oxygen in ester group |
| o | oO | sp2 oxygen in carboxyl group (i.e. COO−) |
| o | oP | sp2 oxygen with one connected atom (phosphorus) in phosphate group |
| os | oT | sp3 oxygen in phosphate group |
| oh | oH | sp3 oxygen in hydroxyl group |
| n4 | nA | sp3 nitrogen with four connected atoms |
| p5 | pA | phosphorus with four connected atoms, such as in PO42− |
| hc | hA | hydrogen bonded to aliphatic carbon without electron-withdrawing group |
| h1 | hE | hydrogen bonded to aliphatic carbon with one electron-withdrawing group |
| hx | hX | hydrogen bonded to carbon next to positively charged group |
| ha | hB | hydrogen bonded to aromatic carbon |
| hn | hN | hydrogen bonded to nitrogen |
| ho | hO | hydrogen in hydroxyl group |
Table 2.
LIPID11 naming for atom types originating from Glycam force field.
| Glycam | LIPID11 | Description |
|---|---|---|
| CG | cR | sp3 carbon – in inositol ring |
| CP | cP | sp3 carbon bonded to an oxygen bonded to a phosphorus – in inositol ring |
| OH | oR | oxygen in hydroxyl group – in inositol ring |
| HO | hR | hydrogen in hydroxyl group – in inositol ring |
| H1 | hS | hydrogen bonded to aliphatic carbon with one electron-withdrawing group – in inositol ring |
For future flexibility in parameter refinement it was deemed necessary to further differentiate between some of the LIPID11 atom types and those of GAFF. When default GAFF atom types are used in a phospholipid, the same atom type (o) is assigned to ester carbonyl oxygens, phosphodiester sp2 oxygens and to any carboxyl oxygens present (Table 1). Similarly, the sp3 oxygens of both the phosphate group and the ester linkages are characterized by the oS atom type. In each of the two examples given, the oxygens in the divergent chemical groups might not be equivalent with regards to force field parameters. Thus, these oxygen types have been assigned unique atom types to ultimately allow for different dihedral parameters of the phosphodiester group and the ester linkages connecting the long acyl chains to the glycerol backbone. Such splitting of atom types enables future independent modification of the valence (bond, angle and dihedral) as well as Lennard-Jones parameters for the different chemical environments.
2. Charges
A prerequisite for treating the head groups and tails of the phospholipids as separate identities is that the nature of the head group residue does not affect the charge density of the tail residues and vice versa. In order to evaluate the potential for modularizing lipids into separate heads and tails we initially computed charges for four different phospholipids following the established Amber RESP charge derivation procedure.55–56 The purpose was to establish that modularity was reasonable and at the same time determine reasonable locations to split phospholipids into one head group residue and two tail residues. In the following section, we elaborate upon the modular charge derivation scheme and capping strategy. This approach formed the basis for the consistent derivation of charges defined for the LIPID11 framework and presented in full in the Supporting Information.
All charges were derived using R.E.D. version 3.57 The geometry of each molecule was optimized and the molecular electrostatic potential calculated using Gaussian03.58 The Amber RESP procedure55–56 was then applied in a two-stage charge fitting in which the hyberbolic restraints were 0.0005 and 0.001. Consistent with GAFF parameterization24 and the majority of the Amber protein and nucleic acid force fields, the ab initio calculations were performed at the HF/6-31G* level of theory. Six different orientations were used for each structure.
A. Preliminary charge derivations
Four different phospholipids were subjected to preliminary charge derivations. The head groups of choice were zwitterionic phosphatidylcholine (PC) and negatively charged phosphatidylserine (PS). The sn-2 substituent was varied between the saturated palmitoyl chain and unsaturated oleoyl, while the sn-1 acyl chain was palmitoyl in all four phospholipids (Figure 1). This gave rise to dipalmitoyl-phosphatidylcholine (DPPC), palmitoyl-oleoyl-phosphatidylcholine (POPC), dipalmitoyl-phosphatidylserine (DPPS) and palmitoyl-oleoyl-phosphatidylserine (POPS). The basis behind this was that comparisons of the generated charges, described in detail in the Results section below, would disclose whether a module-based charge derivation approach was reasonable.
Figure 1.
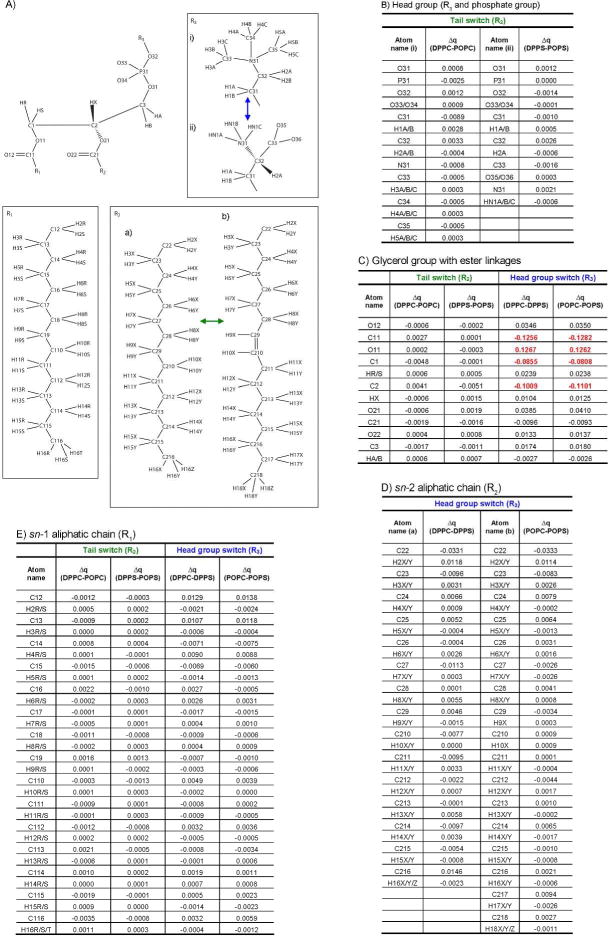
Comparisons of results from preliminary charge calculations on phospholipids. The different combinations of substituents in Panel A give rise to the four phospholipids used; DPPC, POPC, DPPS and POPS. Note that the naming in the sn-2 (R2) hydrocarbon tails is specific to this analysis and different from the LIPID11 standard. Panel B, C, D and E show charge differences (Δq) between pairs of phospholipids for the atoms in the phosphatidyl-alcohol moiety, the glycerol group, the sn-2 chain and the sn-1 chain, respectively. Charge differences above 0.05 are highlighted in red text.
B. Capping strategy
Based on the results obtained from calculations on the four phospholipids in the previous paragraph and Figure 1 it was evident that the ester groups linking the glycerol backbone to the fatty acid tails had to be considered part of the head group residues in the charge derivations. Methyl groups were added to cap the resulting residues. The ester linkage had to be incorporated into the capping group of the tail residues as well due to the influence of the polar oxygens on adjacent charges in the acyl chains. Capping of the tail residues resulted in fatty acid methyl esters (Figure 2, Panel B).
Figure 2.
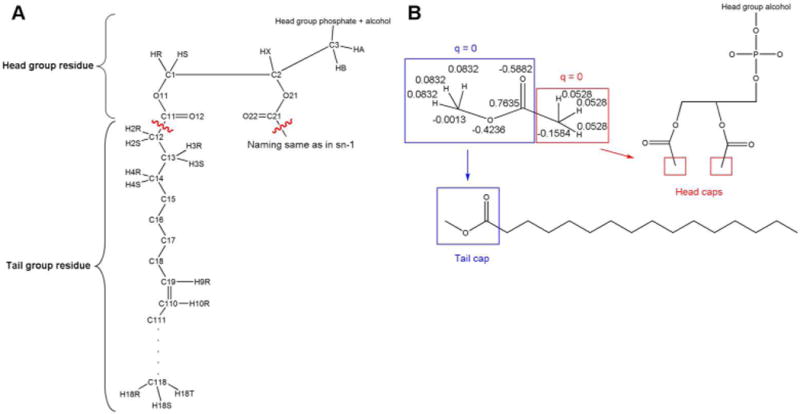
Modular splitting of the phospholipids and subsequent capping strategy. Panel A: Simplified representation of a phospholipid with accompanying LIPID11 nomenclature for the acyl chains and glycerol group. The wavy, red lines indicate the cutting points for the splitting of phospholipids into LIPID11 head group and tail residues, based on the results from Figure 1. Panel B: Capping strategy applied for the charge derivation of all head group and tail residues in LIPID11. Fusion of the two chosen types of capping groups gives methyl acetate, which was subjected to a charge calculation where the net charge of each of the capping groups was constrained to zero. The resulting charges were used as constraints in the capping groups of all the residues (except cholesterol).
The next step was to compute charges for the two prospective capping groups. This was done in a method analogous to the way such capping (using acetyl and N-methylamide groups) is done for proteins. Bonded together, these groups constitute methyl acetate. Charge derivation of methyl acetate was carried out with the net charge of each of the capping groups constrained to zero. The resulting point charges were applied as constraints in the subsequent charge calculations for all head group and tail residues. In addition, the tail residues were constrained to be neutral and the head group residues to have the correct net charge. This was necessary in order to obtain integer values for the overall charges of the different phospholipids. A simplified representation of the capping strategy is given in Figure 2, Panel B, and the complete charges for all the residues comprising the initial LIPID11 framework are presented in the Supporting Information.
3. LIPID11 nomenclature. Residue naming
Residues currently included in the LIPID11 framework are listed in Table 3. All major phospholipid head groups found in biological membranes are included. Two of them are represented by two residues each and deserve special attention. Although not particularly abundant in biological membranes, phosphatidic acid is essential for cell viability. Contrary to most other phospholipids, it has a second pKa value within the physiological pH range,59 implying that two different ionization states of the head group can exist simultaneously at physiological pH. As a consequence, both the PHO4− and the PO42− forms have been incorporated into the LIPID11 framework. Phosphatidylglycerol (PG) is a chiral head group, but only the S enantiomer occurs in nature.60 Nevertheless, both enantiomers are included in the LIPID11 framework because racemic mixtures are commonly used for studies on synthetic PG and because both configurations might occur in cardiolipin.60
Table 3.
LIPID11 residue names.
| Description | LIPID11 Residue Name | |
|---|---|---|
| Acyl chain | Palmitoyl (16:0) | PA |
| Stearoyl (18:0) | ST | |
| Oleoyl (18:1 n-9) | OL | |
| Linoleoyl (18:2 n-6) | LEO | |
| Linolenoyl (18:3 n-3) | LEN | |
| Arachidonoyl (20:4 n-6) | AR | |
| Docosahexanoyl (22:6 n-3) | DHA | |
| Head group | Phosphatidylcholine | PC |
| Phosphatidylethanolamine | PE | |
| Phosphatidylserine | PS | |
| Phosphatidic acid (PHO4−) | PH− | |
| Phosphatidic acid (PO42−) | P2− | |
| R-phosphatidylglycerol | PGR | |
| S-phosphatidylglycerol | PGS | |
| Phosphatidylinositol | PI | |
| Other | Cholesterol | CHL |
Summary of available acyl chain, head group, and other residues and their residue names in LIPID11.
The fatty acids in Table 3 were chosen based on abundance in mammalian cells. Cholesterol is also represented because it is an integral component of cell membranes, as reflected by a molar cholesterol/phospholipid ratio of 1 in the plasma membrane of mammals.61 It is worth pointing out that the list of residues should not be viewed as conclusive. By virtue of the module-based approach, the framework could easily be extended to include residues not currently supported.
Atom naming
Currently, there is no specific convention for lipid naming within the Protein Data Bank62 as there is for proteins. We therefore define our own atom naming convention that is compatible with our modular approach and explain the atom naming and underlying reasoning here. Scripts are provided with Amber 12 to automate the conversion of other commonly used naming conventions, such as the one used by the Charmm Membrane Builder.63 The first letter in LIPID11 atom names is the chemical symbol of the atom. The numbering of the atoms is explained below.
A. Phospholipids
For the phospholipids, the basis of the nomenclature is the stereospecificity of the glycerol group. The carbon atoms of the glycerol group are named in accordance with the IUPAC stereospecific numbering convention for glycerol derivatives,64 C1 being the sn-1 carbon, C2 the sn-2 carbon and C3 the sn-3 carbon. The head group is a substituent on the sn-3 carbon, as is the case in eukaryotes65 and the heavy atoms in it are numbered accordingly (Figure 3). The first digit in the atom name indicates whether a given heavy atom belongs to a tail (sn-1 or sn-2) or the head group (sn-3) The nomenclature used by the Charmm Membrane Builder distinguishes the sn-1 and sn-2 tails by naming them separately. Here though to minimize the size of the topology files and to support the modular framework which implies interchange of the sn-1 and sn-2 tails, we used the same atom names for both the sn-1 and sn-2 residues of a phospholipid. Thus the atoms of every tail residue are named as if they belong to the sn-1 acyl chain (Figure 2, Panel A). This is compatible with the Amber xLEaP and tLEaP building tools since within the LIPID11 framework the two chains are considered to be in separate residues.
Figure 3.
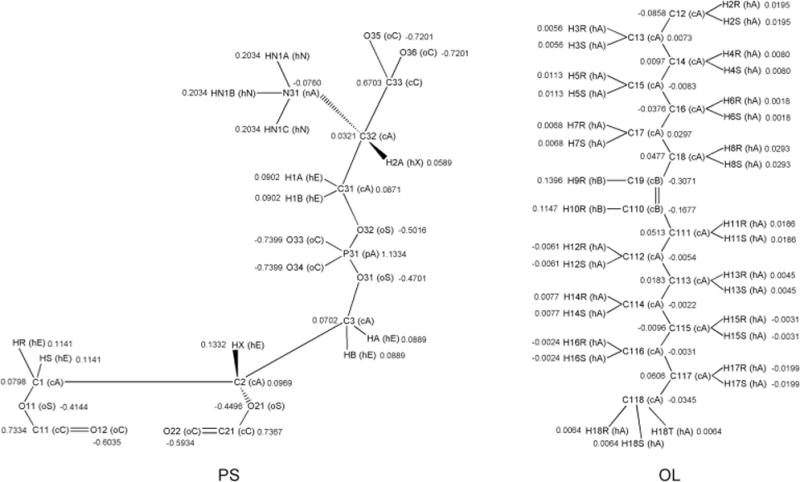
Schematic representations of residues from LIPID11, with residue name, atom names, atom type names (enclosed in parentheses) and atomic point charges. The drawings complement Table 1, 2, and 3 and exemplify the LIPID11 phospholipid nomenclature described in the text. Similar drawings of the other residues are found in the Supplementary Material. The naming convention was developed with IUPAC recommendations in mind. Left: The head group residue PS for assembly of phosphatidylserine lipids. Right: The tail residue OL built into a phospholipid will constitute the aliphatic part of an oleoyl acyl chain. Note that the double bond hydrogens in LIPID11 follow the same naming convention as the rest of the acyl chain hydrogens. Be aware that ‘head group residues’ in this paper refer to modular components in the force field and not to phospholipid head groups in the traditional sense. The same is true for residue names, some of which are similar to commonly used abbreviations for phospholipid head groups, e.g. PS, PI, PC and PE.
Hydrogens are numbered using the last digit(s) in the name of the heavy atom they belong to. If a hydrogen is bonded to nitrogen or oxygen, the letter ‘N’ or ’O’ is also included in its atom name. The last letter of the name depends on whether the hydrogen belongs to the head group (A, B, C) or one of the tail residues (R, S, T). See Figure 3 and the Supporting Information for the complete naming convention.
B. Inositol ring
The carbon atoms of the inositol ring in phosphatidylinositol are numbered according to the IUPAC recommendations for cyclitol numbering.66 The carbon bonded to the phosphate group is considered to be number one and is therefore named C31. When the inositol ring is represented as a chair conformation with C31 at the bottom left, the carbons are numbered counter-clockwise from C31 to C36 (Supporting Information Figure 1). Oxygens in the hydroxyl substituents (O35 to O39) are also numbered in counter-clockwise fashion. Otherwise, naming follows the same principle as in the other head group residues.
C. Cholesterol
Cholesterol is a steroid. Consequently, the atom names for the cholesterol carbons (C1 to C27) comply with the IUPAC rules for numbering steroids (Supporting Information Figure 2).67 Hydrogens are given the number of the carbon to which they are bonded. In addition, a last digit in the atom name (1, 2 or 3) distinguishes the hydrogens bonded to the same carbon atom. The hydroxyl oxygen and hydrogen are named O1 and HO1, respectively.
4. LIPID11 PDB coordinate file format
A direct consequence of the module-based approach is that a phospholipid molecule in the LIPID11 framework is made up of three residues (Figure 2, Panel A). Head group and tail residues are linked together by the LEaP program,23 based on the information in a PDB file containing the simulation system. The way in which the ‘linker atoms’ are defined impose a certain top-to-bottom residue order for each phospholipid that has to be complied with: sn-1 tail, head group, sn-2 tail, followed by a TER card. If, in addition, every phospholipid has a unique residue number and follows the LIPID11 naming convention for residues (Table 3), atom types (Table 1 and 2) and atoms (Figures 2 and 3 and the Supporting Information), LEaP will be able to build the lipid bilayer and make topology and coordinate files of the system. A specific number for each residue is not required in the PDB file, as the program will assign a new residue number whenever a change in residue name is encountered.
One accessible option for building lipid membrane PDB structures is the Charmm GUI.63,68 We have developed a script, available with AmberTools 12.0, called charmmlipid2amber.x that automatically converts a membrane PDB built with the Charmm Membrane Builder to LIPID11 format.
5 Preliminary Testing
The initial goal of the work described here was to design a sufficiently flexible framework, including a modular charge derivation scheme, compatible with the Amber force fields and simulation software, enabling simulation of lipids and lipid membranes in Amber with limited effort. Our ultimate goal is to develop a comprehensive modular lipid force field for Amber although this long term objective is beyond the scope of this paper. In the initial iteration we used GAFF parameters, but with our RESP-compatible modular charge scheme. Previous lipid simulations using GAFF and constant pressure conditions have resulted in the formation of incorrect gel phases without an applied surface tension. We therefore implemented this functionality within Amber 12 and utilize it here. Refinement of the Lennard-Jones and dihedral parameters to allow for simulations in the tensionless NPT ensemble is currently underway and is reported elsewhere,31 and will be incorporated within our lipid framework in the future.
To evaluate our framework, and in particular the modular charge scheme, in the context of using GAFF lipid parameters, we ran a number of simulations of phospolipid bilayers including DOPC (dioleoyl-phosphatidylcholine), POPE (palmitoyl-oleoyl-phosphatidylethanolamine), and POPC (palmitoyl-oleoyl-phosphatidylcholine). Initial structures of POPC and POPE were obtained from the Charmm GUI,63 and the DOPC starting structure was the equilibrated bilayer from a simulation study by Siu et al, accessible from the lipidbook website.26,69 Structures were generated with TIP3P water:lipid ratios (nw) corresponding to fully hydrated lipid bilayers (Table 4). The LIPID11 framework using GAFF parameters was used for all simulations within the GPU accelerated version70 of the Amber 12 MD software package.23
Table 4.
Lipid bilayer molecular dynamics simulation properties.
Simulations were run using an orthorhombic solvent box with periodic boundary conditions. The temperature was controlled with a Langevin thermostat71 using a coupling constant of 1.0 ps−1. Production runs were conducted with the NPγT ensemble with semiisotropic pressure coupling to an external bath with a relaxation time of 1.0 ps. The SHAKE algorithm72 constrained the covalent bonds involving hydrogen atoms, allowing for a 2.0 fs timestep. An 8.0 Å cutoff truncated the van der Waals interactions. Electrostatic interactions were summed by the particle mesh Ewald method73–74 using a fourth-order B-spline interpolation, a grid spacing of 1 Å and a direct sum tolerance of 10−5.
Lipid bilayer structures were minimized for 10000 steps without positional restraints. The structures were subsequently heated from 0 K to 100 K over 50 ps in the NVT ensemble and then heated from 100 K to the production temperature over 1 ns in the NPT ensemble. The lipids were harmonically restrained using a force constant of 10 kcal/mol·Å2 during both heating steps. The simulation temperature was chosen to be higher than the lipid phase transition temperature in each case so that the equilibrated structure should be in the liquid crystalline state. Each system was simulated at multiple surface tensions in order to determine the tension required to obtain areas per lipid in agreement with experiment. This information provides a guide for the next stage of this work which is to refine the parameters within our framework such that the restraint of the surface tension is not required. An overview of conditions for the phospholipid bilayer simulations including number of lipids, final simulation time, temperature, surface tension, water:lipid ratio (nw) and the experimentally derived water:lipid ratio is provided in Table 4.
6. Analysis of preliminary simulations
Structural properties of the lipid bilayers were derived from the equilibrated portion of the relevant trajectories. In order to calculate electron density profiles and deuterium order parameters the MD trajectories were analyzed with modifications to the ptraj program written by Hannes Loeffler, as an expansion of the AmberTools software package.23 Quantitative comparisons were made between the MD simulations with LIPID11 and experimental measurements of lipid bilayer structural properties.
A. Area per lipid
Area per lipid is a measurement that can be inferred from experiments as well as calculated from MD trajectories. The area per lipid was calculated by dividing the x-y cross-sectional area of the orthorhombic periodic cell (i.e. the lateral area of the bilayer) by the number of lipids per monolayer.
B. Electron density profiles and membrane thickness
Electron density profiles of lipid membranes visualize the structure of the membrane along the axis normal to the bilayer. Electron density profiles were computed by dividing the z dimension of the system into equally sized slices of 0.1 Å and calculating the number of atoms per slice weighted by the partial electronic charge of each atom. The profile was averaged over the time frame of analysis and normalized to a unit cube by dividing by the average cross-sectional area. Experimental electron density profiles may be derived using X-ray scattering. 75–76 Experimental results are comparable to the electron density profiles calculated from MD trajectories. Furthermore, it is possible to calculate bilayer thickness by measuring the distance between the maxima of the electron density profiles, often denoted DHH.
C. Deuterium order parameters
An important property of lipid bilayer structure is the inherent disorder in the acyl chains, which can be measured through H NMR or 1H–13C NMR experiments.77–80 Specifically, deuterium order parameters (SCD) of the acyl chains are commonly used to quantify the degree of order in the hydrophobic interior of lipid membranes. From the MD trajectories, the ensemble (and time) averaged order parameters were calculated using θ, which refers to the angle between the C-H vector of an acyl chain carbon atom and the bilayer normal
The higher the SCD values, the higher the degree of order and the more rigid, stretched out and less flexible the acyl chains are. Low values imply that the hydrocarbon chains are disordered and flexible, as is the case in fluid phase bilayers.
RESULTS/DISCUSSION
1. Preliminary charge derivations
Panel A in Figure 1 shows a graphical representation with atom naming of the four phospholipids applied in the preliminary charge derivations, namely DPPC, POPC, DPPS and POPS. Note that the nomenclature in the sn-2 hydrocarbon chains (the R2 substituents) differs from the standard defined within the LIPID11 framework, where both tail residues have sn-1 naming. Presented in tabular form, and denoted by Δq, are differences in calculated charges between pairs of phospholipids for the atoms in the head group alcohol and phosphate (Panel B), the glycerol group and ester linkages (Panel C) and the sn-1 and sn-2 aliphatic tails (Panels E and D, respectively).
Charge calculations on the four phospholipids depicted in Figure 1 were performed in order to rationalize the module-based approach. Changing the sn-2 substituent from a saturated to an unsaturated chain had minimal effect on the charge densities in both phosphatidylserine, phosphatidylcholine and the glycerol group (Panels B and C). It is shown in Panel E that the sn-2 tail substitution and the change of head group both led to negligible charge differences in the sn-1 hydrocarbon chain. Also, the switch between head group alcohols affected the charges in the aliphatic portion of the sn-2 fatty acids only to a minor degree, as shown in Panel D. However, more pronounced differences were observed in the glycerol group and in one of the ester linkages (Panel C), most notably for atoms C1, O11, C11 and C2, upon going from the zwitterionic to the anionic head group. Differences in calculated point charges greater than 0.05 are highlighted in the tables. It is clear that only these four atoms show marked changes upon interchanging head groups and/or sn-2 tails. The implication of this is that a module based charge scheme is feasible provided that the glycerol group and the ester linkages are considered part of the head group residues and that all head group and tail residues are capped appropriately prior to charge derivation.
2. Preliminary simulations
To test that the modular charge approach yields acceptable structural behaviour within the limitations of the underlying GAFF parameters, we performed simulations of the three phospholipid bilayer systems listed in Table 4. These were run under a range of different surface tensions in order to find interim values that can be used to satisfactorily reproduce the experimentally determined areas per lipid. This allows the LIPID11 framework to be used for initial lipid bilayer simulations while we continue our work to refine the underlying GAFF parameters themselves to avoid the need for inclusion of a constant surface tension term. The change in the area per lipid over time for each simulation is presented in the three panels of Figure 4. Simulations were halted if the deviation from the experimental area was large. The trajectory closest to the experimental value for each bilayer (solid black lines and additional blue line for POPC) was extended to 100 ns and subsequently analyzed to obtain electron density profiles (Figure 5) and acyl chain deuterium order parameters (Figure 6). To allow for sufficient equilibration, only the last 40 ns were used for analysis and comparisons with experiment. Table 5 reports the average areas per lipid, membrane thicknesses (DHH) calculated as the distance between the phosphate peaks of the electron density profiles in Figure 5, as well as the accompanying experimental data.
Figure 4.
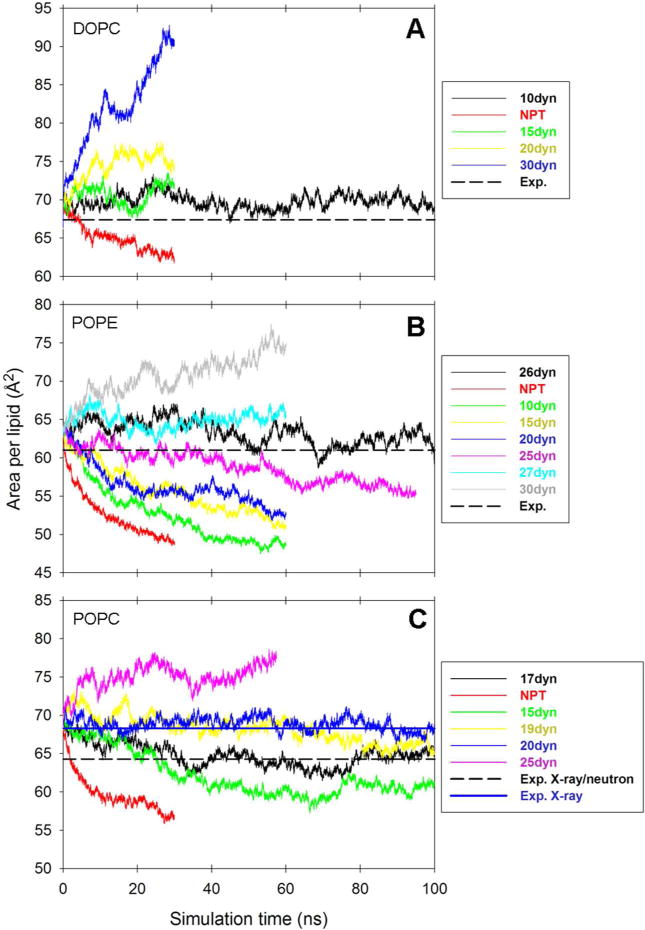
Area per lipid versus simulation time for lipid bilayer. All surface tension values are reported as dynes/cm per layer (abbreviated “dyn” in the legends). NPT indicates no surface tension. (a) DOPC area per lipid. For experimental value see Kučerka et al.69 (b) POPE area per lipid. For experimental value see Rappolt et al.76 (c) POPC area per lipid. For experimental values see Kučerka et al70 and Kučerka et al.77
Figure 5.
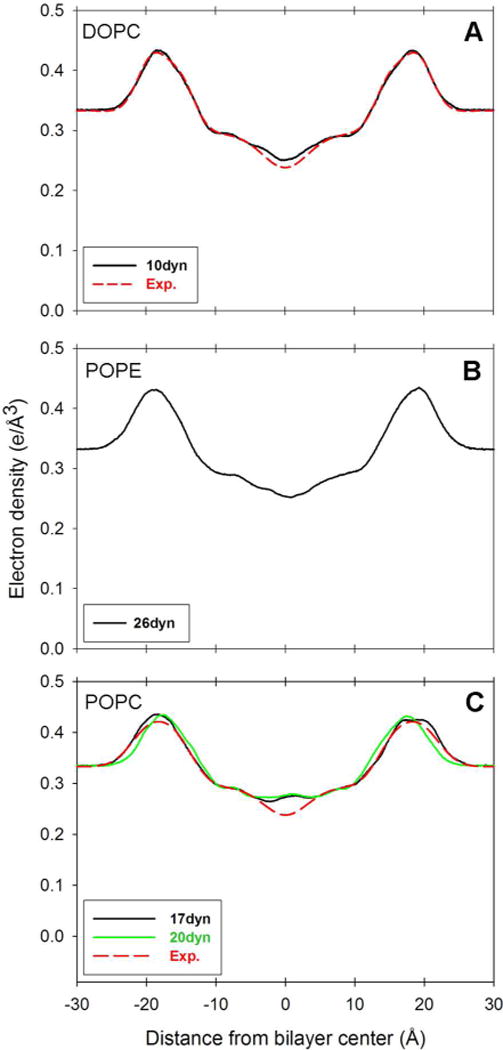
Electron density profile for lipid bilayer. Distance from bilayer center is along the axis normal to the bilayer surface. All surface tension values are reported as dynes/cm per layer (abbreviated “dyn” in the legends). (a) DOPC electron density profile. For experimental density profile see Kučerka et al.69 (b) POPE electron density profile. (c) POPC electron density profiles for 17 and 20 dynes/cm per layer. For experimental density profile see Kučerka et al.70 Bilayer thickness (DHH) values are obtained from the peak to peak distance in the electron density profile.
Figure 6.
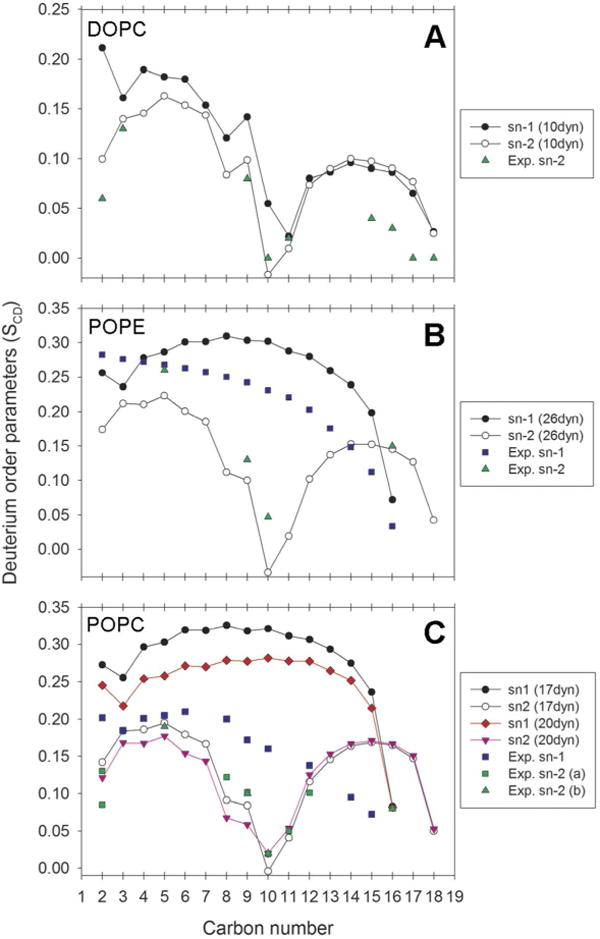
Deuterium order parameters for the sn-1 and sn-2 chains of phospholipids. Surface tension values are reported as dynes/cm per layer (abbreviated “dyn” in the legends). (a) DOPC order parameters. For experimental sn-2 parameters see Warchawski et al.74 (b) POPE order parameters. For experimental sn-1 order parameters see Lafleur et al.73 For experimental sn-2 parameters see Perly et al.72 (c) POPC order parameters. For experimental sn-1 order parameters see Seelig et al.71 For experimental sn-2 order parameters see Seelig et al71 and Perly et al.72
Table 5.
Lipid bilayer molecular dynamics area per lipid and thickness.
A. DOPC bilayer
The DOPC bilayer, when simulated with an applied surface tension of 10 dynes/cm per monolayer, converges to an area per lipid of 69.95 ± 0.75 Å2 (Table 5 and Figure 4, Panel A), close to the recent experimental value of 67.4 ± 1.0 Å2.75 Figure 5, Panel A shows that the electron density profile for DOPC is in reasonable agreement with experiment, and consequently the bilayer thickness (DHH) is also in agreement (Table 5). The experimental area per lipid, electron density profile and thickness were all derived from the simultaneous analysis of X-ray and neutron scattering data (the SDP model) recorded at 303 K.75 Deuterium order parameters for the sn-2 oleoyl acyl chain of DOPC (Figure 6, Panel A) show reasonable agreement with the profile obtained from 1H−13C solid-state NMR.80
The overestimations observed in the order parameters (Figure 6, Panel A) for carbon number 2 and for the carbons closest to the terminal methyl group might, at least in part, be accounted for by the temperature difference. With the experiment run at 310 K and the simulation at 300 K, one would expect a higher degree of disorder in the experiment relative to simulation. Although similar differences have been observed in simulations that utilized the GAFF parameters previously.26 The characteristic dip related to the double bond is reproduced in the middle part of both acyl chains. However, it is located on carbon number 11 of the sn-1 palmitoyl chain as opposed to carbon 10, as in the sn-2 oleoyl chain and as suggested experimentally77,80 The sn-1 and sn-2 chains have similar profiles with the exception of differences for carbon number 2, which has been documented experimentally.77,81 In summary, our SCD profiles for DOPC are in agreement with previously published results using GAFF and surface tension in Gromacs,26 The DOPC system from the same publication was used in a subsequent study of the interactions of the membrane with alkali cations and halide anions.30 Our results appear reasonable within the expected limitations of the GAFF force field and suggest that in this case the charge model is acceptable. It is likely that with careful reparameterization of the Lennard-Jones and dihedral terms our modular framework can be improved to provide predictive results without requiring the artificial constant surface tension term.
B. POPE bilayer
To reproduce the experimental area per lipid,82 the POPE lipid bilayer requires a large surface tension of 26 dynes/cm per monolayer (Figure 4, Panel B). The need for such a large surface tension is disconcerting. However, it is of comparable magnitude to values that have been used in previous work with lipid bilayers using GAFF.25–26 To our knowledge, there exists no absolute experimental electron density profile for POPE. Even so, the profile from the simulation (Figure 5, Panel B) compares favorably to a relative density profile82 in terms of shape and separation between the phosphate maxima, which subsequently gives a reasonable bilayer thickness in Table 5. Order parameters for the sn-2 oleoyl chain (Figure 6, Panel B) are in agreement with 2H NMR spectroscopy data at 303 K,78 as are the sn-1 order parameters in the beginning and end of the palmitoyl chain.79 Most of the sn-1 SCD values are higher than the experimental data, which is further elaborated upon in the discussion of POPC below.
C. POPC bilayer
POPC gives an area per lipid close to experiment76 with an applied surface tension of 17 dynes/cm per monolayer (Table 5 and Figure 4, Panel C). The same surface tension results in electron densities that are in agreement with the experimental density profile (Figure 5, Panel C).76 The bilayer thickness (DHH) is also close to the thickness derived from experiment (Table 5). Nevertheless, the densities in the middle of the membrane are elevated compared to the experimental profile. This should be viewed in conjunction with the SCD profiles in Figure 6, Panel C. Whilst the order parameters compare well to the experimental profiles at 300 K77 and 303 K78 in most parts of the sn-2 oleoyl chain, the carbons along the sn-1 palmitoyl chain are highly ordered. It appears that a preference for trans configurations along the sn-1 acyl chains and accompanying rigidity to some degree allow a few of the saturated chains from opposite leaflets to intercalate between each other, resulting in increased densities in the center of the bilayer as observed in Figure 5, Panel C.
For POPC there are competing experimental values for the area per lipid.76,83 We thus also considered deuterium order parameters and electron density profiles from a second POPC simulation at 20 dynes/cm per monolayer (Figure 4, Panel C). It can be seen from Figure 6, Panel C that the deuterium order parameters for the sn-1 palmitoyl carbons are considerably lower in the 20 dynes/cm simulation than in the 17 dynes/cm case. These results suggest that relatively small fluctuations in surface tension may have a significant effect on the saturated palmitoyl deuterium order parameters. This underscores the need for our framework’s flexibility to accommodate our long term goal of a complete reparameterization of the GAFF lipid parameters to avoid the need for artificial surface tension.
CONCLUSIONS
In this paper, we have presented a flexible framework for the MD simulation of lipids within the Amber software package. The first version of this framework, consisting of point charges based on a modular approach to RESP charge derivation in lipids coupled with GAFF atom parameters has been released as part of Amber 12 and is shown here to perform reasonably well for simulation of pure lipid bilayers assuming an appropriate surface tension is applied. The atom typing, naming convention, charge derivation and build procedure have been designed to be as modular as reasonably possible while remaining fully compatible with the traditional Amber approach, including preserving cross compatibility with all other Amber force fields. The LIPID11 framework is designed around the concept of treating phospholipids in an analogous way to protein residues. The simple approach to interchanging tails and head groups along with a transferable charge derivation scheme opens the door to the ultimate goal of having a comprehensive lipid force field for the simulation of complex lipid mixtures.
The LIPID11 framework substantially improves the user friendliness of the Amber software with regards to setting up and running lipid MD simulations. At the same time flexibility has been included in order to allow for future optimization of the underlying parameters. The initial choice of GAFF parameters is not without issues. However, ongoing work is showing success in the refinement of such parameters,31 and a subsequent revision of the LIPID11 framework will likely remove the need for constant surface tension and, it is hoped, substantially improve the fidelity of lipid simulations based on the Amber force field.
Supplementary Material
Acknowledgments
This work was funded in part by the NSF through XSEDE Supercomputer resources at the San Diego Supercomputer Center (TG-MCB090110) and by NSF (NSF1047875, NSF1148276 and NSF1148358) and University of California (UC Lab 09-LR-06-117792) grants to R.C.W. The Norwegian Research Council is acknowledged for CPU resources granted through the Norwegian Metacenter for Computational Science (NOTUR). The Meltzer Foundation is acknowledged for providing travel grants to Åge A Skjevik. The NIH Molecular Biophysics Training Grant (T32 GM008326) is acknowledged for funding for Benjamin D. Madej. The authors would also like to acknowledge Dr. Ian R. Gould and Ms Sarah Rosen of Imperial College London and Aurora Martinez and Holm Holmsen at University of Bergen for helpful discussion and suggested analysis.
Footnotes
Supporting Information. Figures of each of the sixteen LIPID11 framework residues, including residue names, atom names, atom type names, and atomic point charges. This material is available free of charge via the Internet at http://pubs.acs.org.
References
- 1.Ash WL, Zlomislic MR, Oloo EO, Tieleman DP. Biochim Biophys Acta, Biomembr. 2004;1666(1–2):158–189. doi: 10.1016/j.bbamem.2004.04.012. [DOI] [PubMed] [Google Scholar]
- 2.Feller SE. Curr Opin Colloid Interface Sci. 2000;5(3–4):217–223. [Google Scholar]
- 3.Roux B, Woolf TB. In: Biological membranes: a molecular perspective from computation and experiment. Merz KM, Roux B, editors. Birkhäuser Boston; 1996. [Google Scholar]
- 4.Saiz L, Bandyopadhyay S, Klein ML. Biosci Rep. 2002;22(2):151–173. doi: 10.1023/a:1020130420869. [DOI] [PubMed] [Google Scholar]
- 5.Tieleman DP, Marrink SJ, Berendsen HJC. Biochim Biophys Acta, Rev Biomembr. 1997;1331(3):235–270. doi: 10.1016/s0304-4157(97)00008-7. [DOI] [PubMed] [Google Scholar]
- 6.Lomize A, Pogozheva I, Lomize M, Mosberg H. BMC Struct Biol. 2007;7(1):44. doi: 10.1186/1472-6807-7-44. [DOI] [PMC free article] [PubMed] [Google Scholar]
- 7.Lundstrom KH, Chiu ML. G Protein-Coupled Receptors in Drug Discovery. Taylor & Francis; 2005. [Google Scholar]
- 8.Membrane Proteins of Known 3D Structure. http://blanco.biomol.uci.edu/mpstruc/listAll/list (accessed Aug 2, 2011).
- 9.Membrane Protein Data Bank. http://www.mpdb.tcd.ie/ (accessed Aug 2, 2011).
- 10.Yearly Growth of Protein Structures. http://www.rcsb.org/pdb/statistics/contentGrowthChart.do?content=molType-protein&seqid=100 (accessed Aug 2, 2011).
- 11.Cornell WD, Cieplak P, Bayly CI, Gould IR, Merz KM, Ferguson DM, Spellmeyer DC, Fox T, Caldwell JW, Kollman PA. J Am Chem Soc. 1995;117(19):5179–5197. [Google Scholar]
- 12.Foloppe N, MacKerell JAD. J Comput Chem. 2000;21(2):86–104. [Google Scholar]
- 13.MacKerell AD, Bashford D, Bellott, Dunbrack RL, Evanseck JD, Field MJ, Fischer S, Gao J, Guo H, Ha S, et al. J Phys Chem B. 1998;102(18):3586–3616. doi: 10.1021/jp973084f. [DOI] [PubMed] [Google Scholar]
- 14.Feller SE, MacKerell AD. J Phys Chem B. 2000;104(31):7510–7515. [Google Scholar]
- 15.Feller SE, Yin D, Pastor RW, MacKerell AD., Jr Biophys J. 1997;73(5):2269–2279. doi: 10.1016/S0006-3495(97)78259-6. [DOI] [PMC free article] [PubMed] [Google Scholar]
- 16.Klauda JB, Brooks BR, MacKerell AD, Venable RM, Pastor RW. J Phys Chem B. 2005;109(11):5300–5311. doi: 10.1021/jp0468096. [DOI] [PubMed] [Google Scholar]
- 17.Klauda JB, Venable RM, Freites JA, O’Connor JW, Tobias DJ, Mondragon-Ramirez C, Vorobyov I, MacKerell AD, Pastor RW. J Phys Chem B. 2010;114(23):7830–7843. doi: 10.1021/jp101759q. [DOI] [PMC free article] [PubMed] [Google Scholar]
- 18.Berger O, Edholm O, Jähnig F. Biophys J. 1997;72(5):2002–2013. doi: 10.1016/S0006-3495(97)78845-3. [DOI] [PMC free article] [PubMed] [Google Scholar]
- 19.Chandrasekhar I, Kastenholz M, Lins RD, Oostenbrink C, Schuler LD, Tieleman DP, van Gunsteren WF. Eur Biophys J. 2003;32(1):67–77. doi: 10.1007/s00249-002-0269-4. [DOI] [PubMed] [Google Scholar]
- 20.Chiu SW, Pandit SA, Scott HL, Jakobsson E. J Phys Chem B. 2009;113(9):2748–2763. doi: 10.1021/jp807056c. [DOI] [PubMed] [Google Scholar]
- 21.Poger D, Van Gunsteren WF, Mark AE. J Comput Chem. 2010;31(6):1117–1125. doi: 10.1002/jcc.21396. [DOI] [PubMed] [Google Scholar]
- 22.Case DA, Cheatham TE, Darden T, Gohlke H, Luo R, Merz KM, Onufriev A, Simmerling C, Wang B, Woods RJ. J Comput Chem. 2005;26(16):1668–1688. doi: 10.1002/jcc.20290. [DOI] [PMC free article] [PubMed] [Google Scholar]
- 23.Case DA, Darden TA, Cheatham TE, I, Simmerling CL, Wang J, Duke RE, Luo R, Walker RC, Zhang W, Merz KM, et al. University of California, San Francisco. 2012. [Google Scholar]
- 24.Wang J, Wolf RM, Caldwell JW, Kollman PA, Case DA. J Comput Chem. 2004;25(9):1157–1174. doi: 10.1002/jcc.20035. [DOI] [PubMed] [Google Scholar]
- 25.Jójárt B, Martinek TA. J Comput Chem. 2007;28(12):2051–2058. doi: 10.1002/jcc.20748. [DOI] [PubMed] [Google Scholar]
- 26.Siu SWI, Vacha R, Jungwirth P, Bockmann RA. J Chem Phys. 2008;128(12) doi: 10.1063/1.2897760. [DOI] [PubMed] [Google Scholar]
- 27.Skjevik ÅA, Haug BE, Lygre H, Teigen K. Biophys Chem. 2011;154(1):18–25. doi: 10.1016/j.bpc.2010.12.002. [DOI] [PubMed] [Google Scholar]
- 28.Vácha R, Jurkiewicz P, Petrov M, Berkowitz ML, Böckmann RA, Barucha-Kraszewska J, Hof M, Jungwirth P. J Phys Chem B. 2010;114(29):9504–9509. doi: 10.1021/jp102389k. [DOI] [PubMed] [Google Scholar]
- 29.Rosso L, Gould IR. J Comput Chem. 2008;29(1):24–37. doi: 10.1002/jcc.20675. [DOI] [PubMed] [Google Scholar]
- 30.Vácha R, Siu SWI, Petrov M, Böckmann RA, Barucha-Kraszewska J, Jurkiewicz P, Hof M, Berkowitz ML, Jungwirth P. J Phys Chem A. 2009;113(26):7235–7243. doi: 10.1021/jp809974e. [DOI] [PubMed] [Google Scholar]
- 31.Dickson CJ, Rosso L, Betz RM, Walker RC, Gould IR. Soft Matter. 2012 [Google Scholar]
- 32.Benz RW, Castro-Román F, Tobias DJ, White SH. Biophys J. 2005;88(2):805–817. doi: 10.1529/biophysj.104.046821. [DOI] [PMC free article] [PubMed] [Google Scholar]
- 33.Högberg CJ, Nikitin AM, Lyubartsev AP. J Comput Chem. 2008;29(14):2359–2369. doi: 10.1002/jcc.20974. [DOI] [PubMed] [Google Scholar]
- 34.Jensen MØ, Mouritsen OG, Peters GH. Biophys J. 2004;86(6):3556–3575. doi: 10.1529/biophysj.103.029140. [DOI] [PMC free article] [PubMed] [Google Scholar]
- 35.Sonne J, Jensen MØ, Hansen FY, Hemmingsen L, Peters GH. Biophys J. 2007;92(12):4157–4167. doi: 10.1529/biophysj.106.087130. [DOI] [PMC free article] [PubMed] [Google Scholar]
- 36.Taylor J, Whiteford NE, Bradley G, Watson GW. Biochim Biophys Acta, Biomembr. 2009;1788(3):638–649. doi: 10.1016/j.bbamem.2008.10.013. [DOI] [PubMed] [Google Scholar]
- 37.Carrillo-Tripp M, Feller SE. Biochemistry. 2005;44(30):10164–10169. doi: 10.1021/bi050822e. [DOI] [PubMed] [Google Scholar]
- 38.Klauda JB, Kučerka N, Brooks BR, Pastor RW, Nagle JF. Biophys J. 2006;90(8):2796–2807. doi: 10.1529/biophysj.105.075697. [DOI] [PMC free article] [PubMed] [Google Scholar]
- 39.Lee J, Im W. J Am Chem Soc. 2008;130(20):6456–6462. doi: 10.1021/ja711239h. [DOI] [PubMed] [Google Scholar]
- 40.Hénin Jr, Shinoda W, Klein ML. J Phys Chem B. 2008;112(23):7008–7015. doi: 10.1021/jp800687p. [DOI] [PMC free article] [PubMed] [Google Scholar]
- 41.Tessier MB, DeMarco ML, Yongye AB, Woods RJ. Mol Simul. 2008;34(4):349–364. doi: 10.1080/08927020701710890. [DOI] [PMC free article] [PubMed] [Google Scholar]
- 42.Gentilcore A, Michaud-Agrawal N, Crozier P, Stevens M, Woolf T. J Membr Biol. 2010;235(1):1–15. doi: 10.1007/s00232-010-9249-2. [DOI] [PubMed] [Google Scholar]
- 43.Mondal S, Mukhopadhyay C. Chem Phys Lett. 2007;439:1–3. 166–170. [Google Scholar]
- 44.Chiu SW, Clark M, Balaji V, Subramaniam S, Scott HL, Jakobsson E. Biophys J. 1995;69(4):1230–1245. doi: 10.1016/S0006-3495(95)80005-6. [DOI] [PMC free article] [PubMed] [Google Scholar]
- 45.Feller SE, Zhang Y, Pastor RW, Brooks BR. J Chem Phys. 1995;103(11):4613–4621. [Google Scholar]
- 46.Zhang Y, Feller SE, Brooks BR, Pastor RW. J Chem Phys. 1995;103(23):10252–10266. [Google Scholar]
- 47.Griepernau B, Leis S, Schneider MF, Sikor M, Steppich D, Böckmann RA. Biochim Biophys Acta, Biomembr. 2007;1768(11):2899–2913. doi: 10.1016/j.bbamem.2007.08.002. [DOI] [PubMed] [Google Scholar]
- 48.Jämbeck JPM, Lyubartsev AP. J Phys Chem B. 2012;116(10):3164–3179. doi: 10.1021/jp212503e. [DOI] [PMC free article] [PubMed] [Google Scholar]
- 49.Ponder JW, Case DA. Force Fields for Protein Simulations. In: Valerie D, editor. Adv Protein Chem. Vol. 66. Academic Press; 2003. pp. 27–85. [DOI] [PubMed] [Google Scholar]
- 50.Hornak V, Abel R, Okur A, Strockbine B, Roitberg A, Simmerling C. Proteins: Struct, Funct, Bioinf. 2006;65(3):712–725. doi: 10.1002/prot.21123. [DOI] [PMC free article] [PubMed] [Google Scholar]
- 51.Cheatham TE, Young MA. Biopolymers. 2000;56(4):232–256. doi: 10.1002/1097-0282(2000)56:4<232::AID-BIP10037>3.0.CO;2-H. [DOI] [PubMed] [Google Scholar]
- 52.Kirschner KN, Yongye AB, Tschampel SM, González-Outeiriño J, Daniels CR, Foley BL, Woods RJ. J Comput Chem. 2008;29(4):622–655. doi: 10.1002/jcc.20820. [DOI] [PMC free article] [PubMed] [Google Scholar]
- 53.Kirschner KN, Woods RJ. Proc Natl Acad Sci. 2001;98(19):10541–10545. doi: 10.1073/pnas.191362798. [DOI] [PMC free article] [PubMed] [Google Scholar]
- 54.Woods RJ, Dwek RA, Edge CJ, Fraser-Reid B. J Phys Chem. 1995;99(11):3832–3846. [Google Scholar]
- 55.Bayly CI, Cieplak P, Cornell W, Kollman PA. J Phys Chem. 1993;97(40):10269–10280. [Google Scholar]
- 56.Cieplak P, Cornell WD, Bayly C, Kollman PA. J Comput Chem. 1995;16(11):1357–1377. [Google Scholar]
- 57.Dupradeau FY, Pigache A, Zaffran T, Savineau C, Lelong R, Grivel N, Lelong D, Rosanski W, Cieplak P. PCCP. 2010;12(28):7821–7839. doi: 10.1039/c0cp00111b. [DOI] [PMC free article] [PubMed] [Google Scholar]
- 58.Frisch MJ, Trucks GW, Schlegel HB, Scuseria GE, Rob MA, Cheeseman JR, Montgomery JA, Jr, Vreven T, Kudin KN, Burant JC, et al. Gaussian 03. 2003. Gaussian: [Google Scholar]
- 59.Kooijman EE, Burger KNJ. Biochim Biophys Acta, Mol Cell Biol Lipids. 2009;1791(9):881–888. doi: 10.1016/j.bbalip.2009.04.001. [DOI] [PubMed] [Google Scholar]
- 60.Eklund KK, Virtanen JA, Vuori K, Patrikainen J, Kinnunen PKJ. Biochemistry. 1987;26(24):7542–7545. doi: 10.1021/bi00398a002. [DOI] [PubMed] [Google Scholar]
- 61.van Meer G, Voelker DR, Feigenson GW. Nature Reviews Molecular Cell Biology. 2008;9(2):112–124. doi: 10.1038/nrm2330. [DOI] [PMC free article] [PubMed] [Google Scholar]
- 62.Personal communication with RCSB PDB.
- 63.Jo S, Lim JB, Klauda JB, Im W. Biophys J. 2009;97(1):50–58. doi: 10.1016/j.bpj.2009.04.013. [DOI] [PMC free article] [PubMed] [Google Scholar]
- 64.Recommendations Lip-1 and Lip-2. http://www.chem.qmul.ac.uk/iupac/lipid/lip1n2.html (accessed Aug 2, 2011).
- 65.Vance DE, Vance JE. Biochemistry Of Lipids, Lipoproteins And Membranes. Elsevier; 2008. [Google Scholar]
- 66.Numbering of atoms in myo-inositol. http://www.chem.qmul.ac.uk/iupac/cyclitol/myo.html (accessed Aug 2, 2011).
- 67.The Nomenclature of Steroids: 3S-1. http://www.chem.qmul.ac.uk/iupac/steroid/3S01.html (accessed Aug 2, 2011).
- 68.Jo S, Kim T, Im W. PLoS ONE. 2007;2(9):e880. doi: 10.1371/journal.pone.0000880. [DOI] [PMC free article] [PubMed] [Google Scholar]
- 69.Domański J, Stansfeld P, Sansom M, Beckstein O. J Membr Biol. 2010;236(3):255–258. doi: 10.1007/s00232-010-9296-8. [DOI] [PubMed] [Google Scholar]
- 70.Götz AW, Williamson MJ, Xu D, Poole D, Le Grand S, Walker RC. J Chem Theory Comput. 2012;8(5):1542–1555. doi: 10.1021/ct200909j. [DOI] [PMC free article] [PubMed] [Google Scholar]
- 71.Loncharich RJ, Brooks BR, Pastor RW. Biopolymers. 1992;32(5):523–535. doi: 10.1002/bip.360320508. [DOI] [PubMed] [Google Scholar]
- 72.Ryckaert JP, Ciccotti G, Berendsen HJC. J Comput Phys. 1977;23(3):327–341. [Google Scholar]
- 73.Darden T, York D, Pedersen L. J Chem Phys. 1993;98(12):10089–10092. [Google Scholar]
- 74.Essmann U, Perera L, Berkowitz ML, Darden T, Lee H, Pedersen LG. J Chem Phys. 1995;103(19):8577–8593. [Google Scholar]
- 75.Kučerka N, Nagle JF, Sachs JN, Feller SE, Pencer J, Jackson A, Katsaras J. Biophys J. 2008;95(5):2356–2367. doi: 10.1529/biophysj.108.132662. [DOI] [PMC free article] [PubMed] [Google Scholar]
- 76.Kučerka N, Nieh MP, Katsaras J. Biochim Biophys Acta, Biomembr. 2011;1808(11):2761–2771. doi: 10.1016/j.bbamem.2011.07.022. [DOI] [PubMed] [Google Scholar]
- 77.Seelig J, Waespe-Sarcevic N. Biochemistry. 1978;17(16):3310–3315. doi: 10.1021/bi00609a021. [DOI] [PubMed] [Google Scholar]
- 78.Perly B, Smith ICP, Jarrell HC. Biochemistry. 1985;24(4):1055–1063. doi: 10.1021/bi00325a038. [DOI] [PubMed] [Google Scholar]
- 79.Lafleur M, Cullis PR, Fine B, Bloom M. Biochemistry. 1990;29(36):8325–8333. doi: 10.1021/bi00488a018. [DOI] [PubMed] [Google Scholar]
- 80.Warschawski D, Devaux P. Eur Biophys J. 2005;34(8):987–996. doi: 10.1007/s00249-005-0482-z. [DOI] [PubMed] [Google Scholar]
- 81.Seelig A, Seelig J. Biochim Biophys Acta, Biomembr. 1975;406(1):1–5. doi: 10.1016/0005-2736(75)90037-1. [DOI] [PubMed] [Google Scholar]
- 82.Rappolt M, Hickel A, Bringezu F, Lohner K. Biophys J. 2003;84(5):3111–3122. doi: 10.1016/S0006-3495(03)70036-8. [DOI] [PMC free article] [PubMed] [Google Scholar]
- 83.Kučerka N, Tristram-Nagle S, Nagle J. J Membr Biol. 2006;208(3):193–202. doi: 10.1007/s00232-005-7006-8. [DOI] [PubMed] [Google Scholar]
Associated Data
This section collects any data citations, data availability statements, or supplementary materials included in this article.