

Abstract
Purpose.
The optic nerve is part of the central nervous system, and interruption of this pathway due to ischemia typically results in optic atrophy and loss of retinal ganglion cells. In this study, we assessed in vivo retinal changes following murine anterior ischemic optic neuropathy (AION) by using spectral-domain optical coherence tomography (SD-OCT) and compared these anatomic measurements to that of histology.
Methods.
We induced ischemia at the optic disc via laser-activated photochemical thrombosis, performed serial SD-OCT and manual segmentation of the retinal layers to measure the ganglion cell complex (GCC) and total retinal thickness, and correlated these measurements with that of histology.
Results.
There was impaired perfusion and leakage at the optic disc on fluorescein angiography immediately after AION and severe swelling and distortion of the peripapillary retina on day-1. We used SD-OCT to quantify the changes in retinal thickness following experimental AION, which revealed significant thickening of the GCC on day-1 after ischemia followed by gradual thinning that plateaued by week-3. Thickness of the peripapillary sensory retina was also increased on day-1 and thinned chronically. This pattern of acute retinal swelling and chronic thinning on SD-OCT correlated well with changes seen in histology and corresponded to loss of retinal ganglion layer cells after ischemia.
Conclusions.
This was a serial SD-OCT quantification of acute and chronic changes following experimental AION, which revealed changes in the GCC similar to that of human AION, but over a time frame of weeks rather than months.
Keywords: AION, animal model, SD-OCT, retinal ganglion cell, optic neuropathy
SD-OCT imaging in experimental murine AION revealed the spectrum of anatomic changes following ischemia with initial swelling and gradual thinning out to 3-4 weeks. SD-OCT findings were corroborated by histologic analysis and correlated with gradual loss of retinal ganglion cells over several weeks.
Introduction
At the human optic nerve head, 1.2 million axons1,2 converge as they take a 90° turn to form the optic nerve, which connect the retinal ganglion cells (RGCs) from the eye with the visual areas of the brain. Optic nerve diseases, including anterior ischemic optic neuropathy (AION), the most common acute optic neuropathy in those older than 50 years,3,4 and glaucoma, the most common chronic optic neuropathy in the world, result from axonal damage at the optic nerve head and subsequent retrograde degeneration of the RGCs. Different risk factors for optic neuropathies at the optic nerve head include optic disc anatomy, blood supply, intraocular and intracranial pressure-related phenomena, and changes as a result of aging.5,6
Acute events following AION have been studied in rodent and monkey animal models using laser-induced photochemical thrombosis of the optic nerve head.7–11 One day after AION induction, the optic nerve head is swollen owing to ischemia, edema, and inflammation. Apoptosis of the optic nerve oligodendrocytes occurs within 6 days, followed by demyelination and optic atrophy.10–12 RGC apoptosis occurs through activation of the caspase pathway, and RGC loss and axonal thinning are most evident 2 to 3 weeks after ischemia, shown by stereologic histologic methods, transmission electron microscopy, and scanning laser polarimetry.9,11,13–15
In addition to traditional morphometric measures, in vivo imaging modalities such as optical coherence tomography (OCT), which uses light interferometry to visualize retinal layers and anatomic changes, have revolutionized the animal and clinical studies of the eye.16–18 The high-resolution spectral-domain optical coherence tomography (SD-OCT), also known as the Fourier domain–OCT, can capture microstructures in the rodent retina at up to 100 times the speed of the older time-domain OCT. OCT has been used to approximate optic nerve anatomy by measuring the thickness of the axons of the RGCs, which reside in the retinal nerve fiber layer.19–22 In animal studies, OCT has increasingly been used to track anatomic changes of retinal and optic nerve diseases,18,23–26 including Leber's congenital amaurosis, retinal dystrophies,27–29 optic nerve crush,30,31 N-methyl-D-aspartate (NMDA)-induced retinal ganglion cell loss,32 optic neuritis,33 ischemic optic neuropathy,34,35 and different models of glaucoma.5,36 In some studies, OCT images are quantitatively or qualitatively comparable to histologic sections at same time points.27–29,32,33,35,37 In patients with AION, OCT measurements show that there is acute swelling of the retinal nerve fiber layer and thinning of the retinal nerve fiber layer within 3 to 6 months, which correlate with visual field losses in both magnitude and location.38–47 Recently, software improvement has made possible the quantification of the thickness of the macular ganglion cell complex (GCC). This measurement has been used clinically to approximate the loss of the RGCs in patients with optic neuropathies.21,48–50
Serial OCT measurements in patients are inconvenient, so there are few serial OCT studies of patients with AION.40,41,43 In this study, we used OCT to visualize the progression of experimental murine AION and compare our findings with that of standard histologic methods and those of other optic neuropathies.
Methods
Animals
All animal care and experiments were performed in accordance with the ARVO Statement for the Use of Animals in Ophthalmic and Vision Research and with approval from the Stanford University Administrative Panel on Laboratory Animal Care. Adult wild-type C57BL/6 mice (Charles River, Wilmington, MA) were housed in cages at constant temperature, with a 12:12 hour light/dark cycle, with food and water available ad libitum. All procedures were performed under sedation, achieved with intramuscular injection of ketamine 50 to 100 mg/kg (Hospira, Inc., Lake Forest, IL), xylazine 2 to 5 mg/kg (Bedford Laboratories, Bedford, OH), and buprenorphine 0.05 mg/kg (Bedford Laboratories). The pupils of anesthetized mice were dilated with 1% tropicamide (Alcon Laboratories, Inc., Fort Worth, TX) and 2.5% phenylephrine hydrochloride (Akorn, Inc., Lake Forest, IL). Both eyes of all mice were tracked before experiment (baseline) and for up to 6 weeks after ischemia.
Experimental Murine AION
We induced murine AION, achieved by photochemical thrombosis, using a frequency doubled 532-nm Nd:YAG laser (PASCAL; OptiMedica, Inc., Santa Clara, CA) as a source of focused, low-intensity light. Rose bengal (1.25 mM in PBS, 2–3 μL/g body weight) was injected via tail vein, and the optic nerve head was exposed to laser light (400-μm diameter, 50 mW, 1-second duration, 15 spots), which resulted in visible whitening of the optic nerve head.8,10,11 For each animal, one eye was lasered, and the contralateral eye served as control. We have performed this injury model in hundreds of mice.
Fluorescein Angiography
After intravenous injection with fluorescein sodium (250 mg/mL; Altaire Pharmaceuticals, Inc., Aquebogue, NY), we imaged the retinal vessels by using confocal scanning laser ophthalmoscope at 488 nm (Spectralis HRA+OCT instrument; Heidelberg Engineering, GmbH, Heidelberg, Germany). A 55-diopter Digital High Mag lens (Volk Optical, Inc., Mentor, OH) was mounted in front of the camera unit. Sequences of ART Composite Images were obtained at 30° field of view centered on the optic disc and averaged every 9 frames.
Spectral-Domain OCT
Serial SD-OCT scans were performed on 35 mice by using Spectralis HRA+OCT instrument (Heidelberg Engineering, GmbH). Circular scan (12°, also known as the retinal nerve fiber layer or “RNFL” scan) consisted of 1536 A-scans centered at the optic disc with scan rate 19 Hz and average 16 frames per B-scan). At least three scans were performed for each eye at each time point, and the best image for each eye with the clearest layer distinction was analyzed under masked condition. Images were manually segmented on the Spectralis to measure the thickness of the ganglion cell complex, a common clinical marker tracking disease progression in glaucoma.32,51 In this study, the GCC was defined as the combined thickness of the nerve fiber layer, ganglion cell layer, and the inner plexiform layer. Total retinal thickness of the sensory retina was also manually segmented and included the nerve fiber layer to the photoreceptor layer. Outer retinal thickness was calculated as the difference between total retinal thickness of the sensory retina and the GCC. Images were graded for quality of scan, and only images with high signal strength index and excellent image quality throughout the circular scan were segmented. For both GCC and total retinal thickness, we used the G or global measurement of thickness, which was the average of the thickness of all quadrants. The number of images analyzed was N = 14 to 33 (mean, N = 22) for GCC and 13 to 35 (average, 23) for total retinal thickness. The variation of N was due to elimination of suboptimal OCT images from analysis or loss due to euthanization for histologic analysis.
Histology
Following intracardiac perfusion (4% paraformaldehyde in PBS for fixation), the globe and the optic nerve at baseline, day-1, week-2, and week-4 after AION were dissected and prepared for 1-μm Epon-embedded sections and stained with toluidine blue. A total of 35 eyes were analyzed. We performed structural and quantitative analysis of photographs of the peripapillary retina (identified by proximity to the optic disc) taken under masked conditions by using a ×10 objective using light microscopy (Eclipse E1000M; Nikon, Tokyo, Japan) equipped with a camera (Infinity1; Lumenera Corp., Ottawa, Ontario) and corresponding software. We manually measured the thickness of each side of the peripapillary retina at 500 to 600 μm from the optic disc to obtain the thickness of the GCC and the total retinal thicknesses of the sensory retina, using ImageJ (United States National Institutes of Health, Bethesda, MD). The same retinal sections in the posterior pole were used to quantify the number of cells in the RGC layer, which was performed under masked condition. We manually counted the number of cell bodies in the ganglion cell layer per high-power field in the posterior pole adjacent to the optic disc.8,10 Of note, the ganglion cell layer contains cell bodies of both RGCs and displaced amacrine cells.
Statistical Analysis
Statistical significance was determined by using Wilcoxon rank sum test (Prism 6; GraphPad Software, Inc., La Jolla, CA), paired Student's t-test for intragroup analysis, or unpaired Student's t-test for intergroup analysis (Excel; Microsoft Office, Redmond, WA). The Wilcoxon rank sum test and the Student's t-test showed similar P values throughout. The level of significance was set at P < 0.05.
Results
Optic Disc Swelling 1 Day After Ischemia
Immediately after experimental AION, there was visible narrowing of the peripapillary vessels and whitening of the optic disc. Fluorescein angiography within 30 minutes after AION showed prominent staining of the optic disc due to leakage of fluorescein (Fig. 1A), similar to the findings of fluorescein angiography in human AION.52,53 There was also sometimes a delay in retinal perfusion, which resolved quickly and was not seen at day-1 (not shown). The disc edema correlated with swelling of the optic disc seen on histology on day-1, which showed elevation of the optic nerve head and lateral displacement and wrinkling of the peripapillary retina (Fig. 1B), similar to what has been reported in experimental AION8,10,11 and human AION.3,53
Figure 1.

Acute changes at the optic nerve head after ischemia. (A) Representative fundus images of fluorescein angiography in control (left) and AION eye (right) immediately after ischemia. (B) Representative horizontal 1-μm Epon retinal sections through the optic nerve head of control (left) and AION (right) eye 1 day after ischemia showed swelling of the optic nerve head (*), which led to elevation, lateral expansion, and wrinkling of the peripapillary retina. The sections were counterstained with toluidine blue.
SD-OCT Measured Swelling of the GCC and Gradual Thinning Over Weeks
We used SD-OCT as an in vivo, noninvasive imaging method to monitor the retinal anatomic changes following experimental AION. Since nerve fiber layer thickness could not be reliably quantified in the mouse, especially after experimental AION, we measured the GCC, which we defined in this study as the retinal nerve fiber layer, ganglion cell layer, and the inner plexiform layer (Fig. 2 and see Methods).32 One day after AION, there was a 31% increase in GCC thickness (AION baseline: 76.9 ± 0.5 μm, N = 33; AION day-1: 100.4 ± 1.9 μm, N = 14; P < 0.0001) (Figs. 3A, 3B). This increase was significant comparing AION and control eyes on day-1 (AION day-1: 100.4 ± 1.9 μm, N = 14; control day-1: 77.2 ± 0.4 μm, N = 30, P < 0.0001). This optic disc swelling at day-1 was not seen within 5 minutes following induction of ischemia (data not shown) and was similar to what has been observed in experimental and human AION.3,10
Figure 2.
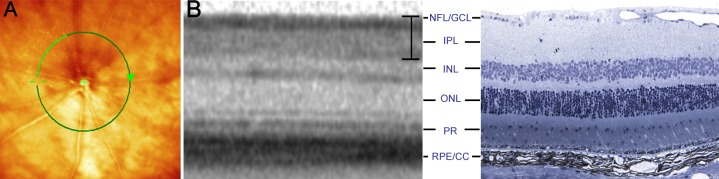
We used SD-OCT to perform in vivo, serial measurements of retinal thickness changes. (A) Fundus photograph with superimposed 12° circular scan (green line) centered on the optic disc. (B) Comparison of location matched, representative SD-OCT (left) and histology (right) images in normal mouse retina. The bracket on the SD-OCT picture denotes the GCC. Histology sections were stained with toluidine blue. CC, choriocapillaris; GCL, ganglion cell layer; INL, inner nuclear layer; IPL, inner plexiform layer; NFL, nerve fiber layer; ONL, outer nuclear layer; PR, photoreceptor layer; RPE, retinal pigment epithelium.
Figure 3.

Serial SD-OCT measurements revealed significant retinal swelling on day-1 following AION and gradual thinning over weeks. (A) Representative SD-OCT images at baseline, day-1, week-2, and week-4 after AION. (B) Line graph of GCC thickness over time showed that, compared with control eyes, there was a significant increase in GCC in AION eyes on day-1 (AION: N = 14, control: N = 30, P < 0.0001). There was gradual GCC thinning in the AION group after day-1 with no difference at week-1 (AION: N = 16, control: N = 20, P = 0.4) and relative plateau by week-3 (AION: N = 16, control: N = 20, P < 0.0001). Mean N = 22 (range, 14–33 for all time points. **P < 0.0001. (C) Line graph of total retinal thickness over time showed similar trends as that of GCC, with 30% swelling on day-1 (AION: N = 23, control: N = 27, P < 0.0001). There was rapid thinning by day-4 (AION: N = 13, control: N = 17, P = 0.007) and little change from day-4 to week-6. Mean N = 19 (range, 13–26) for all data points. **P < 0.0001. (D) Correlation of SD-OCT total retinal thickness and GCC thickness at different time points (R2 = 0.63). There was increased swelling at day-1 in both GCC and total retinal thickness (dashed box). (E) Line graph of normalized GCC and total retinal thickness at different time points showed there was swelling at day-1 in both and different amount and speed of thinning over weeks.
The swelling on day-1 after AION decreased gradually over days and resulted in thinning over weeks. Comparing GCC thickness, there was some persistent swelling at day-4 in AION eyes (AION day-4: 79.7 ± 0.8 μm, N = 26; 103% of baseline or 107% of control at day-4; P < 0.003 for both) and no difference at week-1 (control week-1: N = 20; AION week-1: N = 16; P > 0.4 compared to baseline and control). At week-2, the GCC in AION eyes was thinner (AION week-2: 71.4 ± 0.8 μm or 94% of control, N = 20; P < 0.0001). By week-3, the GCC thickness in AION eyes reached a plateau (AION week-3: 67.6 ± 1.0 μm or 89% of control, P < 0.0001), and relatively little change was observed over weeks after week-3.
Total Retinal Thickness Also Showed Acute Swelling and Chronic Atrophy
At day-1, we also observed thickening and blurring of the sensory retina (measured from retinal nerve fiber layer to photoreceptor layer) on circular scan of SD-OCT (Figs. 3A–C). At day-1 following ischemia, there was 30% increase in total retinal thickness compared to baseline (AION day-1: 263.8 ± 4.4 μm, baseline: 203.5 ± 2.3 μm, P < 0.0001) and control eyes (control day-1: 202.9 ± 1.9 μm, P < 0.0001). Like GCC, this thickening decreased gradually and resulted in atrophy over weeks. At day-4, there was a significant 6% decrease in total retinal thickness in the AION eyes compared with control eyes (AION day-4: 188.3 ± 2.9 μm or 94% of control, P = 0.007). This thinning stabilized from day-4 to week-6, with significant thinning of 91% to 95% in AION eyes compared with control eyes (P < 0.005 for all data points after day-4).
Correlation Between GCC and Total Retinal Measurements
Overall, there was good correlation between GCC and total retinal thickness at different time points (Fig. 3D, R2 = 0.63). Looking at normalized data, GCC and total retinal thickness swelled similarly at day-1 (Fig. 3E). The swelling in GCC then thinned gradually and reached a plateau by week-3, while the total retinal thickness reached plateau thinning by day-4. At week-3, there was slightly more atrophy of the GCC compared with that of total retinal thickness by 3.2% (Fig. 3E).
Although the GCC and total retinal thickness measurements behaved similarly over time, this similarity was not driven solely by changes in the GCC, which comprised less than half of the total retinal thickness. There were also independent changes in the outer retinal layers, calculated as the difference between the total retinal thickness and GCC. Outer retinal thicknesses also showed swelling on day-1 (increase by 41 μm, P < 0.0001) in the AION group compared with that of the control eyes and thinning on all subsequent time points (day-4: decrease by 20 μm, P < 0.0001; week-1: 11 μm, P = 0.008; week-2: 10 μm, P = 0.04; week-3: 9 μm, P = 0.06; week-4: 7 μm, P = 0.01; week-6: 7 μm, P = 0.001).
SD-OCT Retinal Thickness Measurements Correlated With Histology
To validate changes we saw on SD-OCT, we performed histologic measurements of GCC and total retinal thickness on horizontal Epon retinal sections at the optic disc (Figs. 4A, 4B). Similar to SD-OCT, retinal histology revealed significant increase in GCC thickness on day-1 after ischemia (AION day-1: 81.7 ± 0.8 μm, N = 44, 106% of control eyes: 77.1 ± 1.0 μm, N = 61; P = 0.001) and postischemia thinning at 2 (AION week-2: 69.1 ± 1.5 μm, N = 30, 90% of control, P < 0.0001) and 4 weeks (AION week-4: 71.0 ± 1.2 μm, N = 20, 92% of control, P = 0.003).
Figure 4.

Histologic changes in GCC and total retinal thickness after AION. (A) Representative 1-μm Epon sections counterstained with toluidine blue at baseline, day-1, week-2, and week-4 after AION. In the AION group, there was relative swelling at day-1 and thinning by week-2. (B) Bar graph of GCC thickness on histologic sections over time showed increased thickness on day-1 after AION, compared to baseline (baseline: 77.1 ± 1.0 μm, N = 61; AION day-1: 81.7 ± 0.8 μm, N = 44; P = 0.001) and thinning after AION at week-2 (69.1 ± 1.5 μm, N = 30; P < 0.0001) and week-4 (71.0 ± 1.2 μm, N = 20; P = 0.003). (C) A bar graph of total retinal thickness on histology revealed swelling on day-1 (baseline: 227.6 ± 2.5 μm, N = 61; AION day-1: 268.6 ± 3.9 μm, N = 44; P = 0.001) but no significant thinning at week-2 (224.1 ± 1.6 μm, N = 30, P = 0.3) and week-4 (231.9 ± 2.9 μm, N = 20, P = 0.4). (D) The number of cells in the ganglion cell layer (GCL), representing both RGCs and amacrine cells, decreased over time, with 18% fewer RGC layer cells on day-1 following AION, 39% at week-2, and 49% at week-4 (baseline N: 61, day-1: 44, week-2: 30, week-4: 20).**P < 0.001.
On histologic sections from 1-day postischemia, total retinal thickness also increased in the AION eyes (268.6 ± 3.9 μm or 18% increase compared with control eyes: 227.6 ± 2.5 μm, P = 0.001), similar to the SD-OCT result. Review of the peripapillary retina revealed this thickening was due to swelling, lateral displacement, and waviness of the retina (Figs. 1B, 4C). At week-2 and week-4, the swelling, lateral displacement, and retinal waviness resolved. By week-2, there was no difference between total retinal thickness of control and AION eyes (control: 227.6 ± 2.5 μm, N = 61; AION week-2: 224.1 ± 1.6 μm, N = 30, P = 0.3; AION week-4: 231.9 ± 2.9 μm, N = 20, P = 0.4). This relative lack of total retinal thinning in histologic preparations of chronic AION eyes was different from the slight thinning measured by SD-OCT, which may be related to differences between in vivo and in vitro measurements, changes in tissues during histologic preparation, or tissue changes that may have altered OCT measurements but not histology.
Since AION leads to retrograde degeneration of RGCs, we also quantified the number of RGC layer cells over time (baseline N = 61, day-1 N = 44, week-2 N = 30, 4-week N = 20). Compared with baseline, there was a gradual and significant decrease in the number of ganglion cell layer cells over 4 weeks (Fig. 4), similar to previous AION studies.10,11,14 There was a gradual decrease in the number of ganglion cell layer cells over time (decrease by 18.0% on day-1, N = 44; decrease by 39.6% at week-2, N = 30; and decrease by 49.3% at week-4, N = 20; P < 0.001 for all time points). At 1 month after AION, the loss of RGCs correlated well with thinning of the GCC as seen on SD-OCT (R2 = 0.74), showing that SD-OCT matched histology in demonstrating the chronicity of events following ischemic damage.
Discussion
SD-OCT imaging in experimental AION revealed the entire spectrum of anatomic changes following AION with significant swelling on day-1 and gradual thinning over weeks that plateaued at 3 weeks. These SD-OCT measurements were corroborated by histology and correlated with gradual loss of RGCs over several weeks in this and previous studies of experimental AION.10,11,35 Histologic analysis also provided further details on cellular changes associated with ischemia,10,11 including wrinkling of the retina due to swelling, which significantly impacted the retinal thickness measurements by SD-OCT.
This pattern of acute swelling and chronic atrophy in murine AION is consistent with those reported for human nonarteritic AION, although human studies often only assess acute or chronic AION but not both. In three studies looking at retinal nerve fiber layer changes after acute human AION, there is a 96% to 160% increase in retinal nerve fiber layer thickness in a total of 55 patients.40,41,54 In chronic AION, which is typically defined as 5 to 6 months after AION, there is a 32% to 53% thinning of the retinal nerve fiber layer, compared with normal controls or the normal fellow eyes.39,40,44,46,55 Three OCT studies have performed serial measurements with data for both acute and chronic human AION. In one study of 27 patients, there is a 93% thickening of the retinal nerve fiber layer in acute AION, compared with the fellow eye, with normalization of difference at 1.5 months and further thinning to 39% at 3 months, 42% at 6 months, and 44% at 12 months.41 In two studies of 16 eyes from the same group, there is a 97% swelling acutely, normalization around 6 weeks,43 and 34% thinning chronically.40 Although the temporal pattern of murine AION is similar to that of the human, the amount of acute thickening and chronic thinning are relatively more dramatic in human AION. In human AION, the time course is also more protracted, with gradual thinning occurring over months rather than the weeks seen in murine AION. Finally, human AION often shows sectoral pattern of nerve fiber layer and GCC changes, which correlate with the altitudinal visual field defect.20,39,46 This was not seen in this murine model of AION because this model involved global optic disc ischemia, and there are species differences in blood supply to the optic nerve head.56 Although human histologic data are relatively lacking in AION, thinning of retinal nerve fiber layer in human AION correlates well in structure–function comparisons of impaired visual acuity and loss of visual field measurements.39,41,44–46
In humans and rodent studies, SD-OCT measurement of retinal layers is an approximation of the actual RGC axon loss since the retinal nerve fiber layer contains glia and blood vessels, which may undergo concomitant changes related to ischemia. This retinal thickening in acute AION is likely due to ischemia-induced stasis of axoplasmic flow, which leads to increased water content within axons, accumulation of intracellular organelles, disruption in microtubules, and postischemia inflammation, rather than from swelling of the retinal ganglion cell axons alone.15,43 Consistent with this idea, there was swelling of the entire retinal layer in the peripapillary area in our study, which may be related to neighboring effects of optic nerve head ischemia on all surrounding tissue combined with wrinkling of the retina, which occurs following different causes of optic disc edema. Primate models of AION induce optic disc edema from ischemia, and this swelling increases initially and persists for 2 to 3 weeks,57 suggesting that the edema results in compression of initially spared axons, causing secondary axonal defects. Tissue edema and hemorrhage are seen for up to 1 week post ischemia, consistent with reperfusion injury. Increased SD-OCT thickness can also be partly due to early and persistent inflammatory response, increased glial activation, and recruitment of macrophages to the ischemic optic nerve from day 3 to day 35 postinjury.58,59 Chronically, thinning on SD-OCT measurements correlated better with histology and loss of RGC layer neurons, although thickness measurement alone does not tell the whole story. In patient eyes with no light perception from various optic neuropathies for at least 1 year, the retinal nerve fiber layer thinning is only approximately 50%.60
Comparison of SD-OCT studies of ischemic versus nonischemic experimental optic neuropathies reveals some interesting similarities and differences in the pattern of retinal changes. After optic nerve crush, SD-OCT reveals an initial swelling of the total retinal layers similar to what we observed after ischemia, although this swelling normalized rapidly by day-5.30 This transient swelling may be produced by an initial inflammatory process that resolves as the injury heals, although it may also be from extrusion of the optic nerve head anteriorly during the mechanical crush. SD-OCT study of experimental optic neuritis revealed no swelling on day-1, indicating that inflammation in the more posterior optic nerve does not necessarily cause nerve fiber layer swelling.33 Following NMDA-induced excitotoxic RGC death, SD-OCT measures a 10% swelling of the GCC at day-1, which can be attributed to inflammation.61 At the same time point, 90% of RGCs are undergoing apoptosis,32 so SD-OCT measurement of retinal thickness also does not correspond to RGC loss and optic nerve thinning in the acute phase of NMDA-induced optic neuropathy.
Similar to our study, others have shown that OCT correlates with histologic measurements of the RGC loss and optic atrophy in chronic optic neuropathy. On day-14 after NMDA-induced optic neuropathy, there was thinning of SD-OCT, which correlates with 80% RGC loss.32 At different time points following experimental optic neuritis and optic nerve crush, decreased retinal nerve fiber layer thickness correlates with histologic thinning and presence of inflammation.31,33 Other studies examining OCT versus histology thickness measurements for different retinal layers find good correlation between the two methods in wild-type mice and various models of retinal dystrophies.27–29,62 These findings suggest that SD-OCT can accurately distinguish retinal layers and measure layer thicknesses comparable to histologic methods in both healthy and chronic optic nerve and retinal conditions.
OCT imaging of retinal anatomy has certain advantages, compared with the traditional histologic studies, because OCT allows noninvasive examination of the same animals at different time points to assess morphologic changes in the retina during progression of diseases.29,63 The process in histology of fixing, freezing, sectioning, and staining, among others, can be potential sources of error, and animals must be euthanized for analysis.64 Usage of the SD-OCT can therefore minimize sources of error due to tissue handling, reduce the number of experimental animals needed for a study, which confers both ethical and financial benefits, and allow in vivo monitoring of the same animals over time.
While our OCT study of murine AION highlights the importance of the SD-OCT as a tool to track morphologic changes in experimental optic neuropathies, animal OCT studies have some inherent limitations and should complement rather than replace traditional histologic and functional measures at this time. In our study, a significant percentage of RGCs were already lost before the beginning of significant retinal thinning at week-2. This discrepancy between the SD-OCT data and RGC number during the evolving phase of disease results from the relatively low resolution of SD-OCT technology for changes related to optic neuropathies. Currently, SD-OCT has difficulty quantifying anatomic changes specific to RGCs in mice because the retinal nerve fiber layer does not possess sufficient signal contrast to be distinctly separated from its neighboring layers, especially following experimental optic neuropathy. SD-OCT is also relatively insensitive to changes from a small number of retinal neurons in general. Finally, the relative lack of commercially available software for manual segmentation means data analysis is labor-intensive and potentially subject to greater variability introduced by the operator. We are hopeful that continued development of the OCT technology means these obstacles will be overcome in the near future.
Acknowledgments
Supported by the Career Award in Biomedical Sciences from the Burroughs Wellcome Foundation, Weston Havens Foundation, Center for Biomedical Imaging at Stanford, and the Medical Scholars Program and the Vice Provost Undergraduate Education Grant from Stanford University.
Disclosure: J.K. Ho, None; M.P. Stanford, None; M.A. Shariati, None; R. Dalal, None; Y.J. Liao, None
References
- 1. Jonas JB, Muller-Bergh JA, Schlotzer-Schrehardt UM, Naumann GO. Histomorphometry of the human optic nerve. Invest Ophthalmol Vis Sci. 1990; 31: 736–744 [PubMed] [Google Scholar]
- 2. Mikelberg FS, Drance SM, Schulzer M, Yidegiligne HM, Weis MM. The normal human optic nerve: axon count and axon diameter distribution. Ophthalmology. 1989; 96: 1325–1328 [DOI] [PubMed] [Google Scholar]
- 3. Hayreh SS. Anterior ischaemic optic neuropathy, I: terminology and pathogenesis. Br J Ophthalmol. 1974; 58: 955–963 [DOI] [PMC free article] [PubMed] [Google Scholar]
- 4. Levin LA, Louhab A. Apoptosis of retinal ganglion cells in anterior ischemic optic neuropathy. Arch Ophthalmol. 1996; 114: 488–491 [DOI] [PubMed] [Google Scholar]
- 5. Burgoyne CF. A biomechanical paradigm for axonal insult within the optic nerve head in aging and glaucoma. Exp Eye Res. 2011; 93: 120–132 [DOI] [PMC free article] [PubMed] [Google Scholar]
- 6. Calkins DJ. Critical pathogenic events underlying progression of neurodegeneration in glaucoma. Prog Retin Eye Res. 2012; 31: 702–719 [DOI] [PMC free article] [PubMed] [Google Scholar]
- 7. Bernstein J, Garcia GH, Guevara JL, Mitchell GW. Progress report: the prevalence of required medical school instruction in musculoskeletal medicine at decade's end. Clin Orthop Relat Res. 2011; 469: 895–897 [DOI] [PMC free article] [PubMed] [Google Scholar]
- 8. Pangratz-Fuehrer S, Kaur K, Ousman SS, Steinman L, Liao YJ. Functional rescue of experimental ischemic optic neuropathy with alphaB-crystallin. Eye (Lond). 2011; 25: 809–817 [DOI] [PMC free article] [PubMed] [Google Scholar]
- 9. Danylkova NO, Pomeranz HD, Alcala SR, McLoon LK. Histological and morphometric evaluation of transient retinal and optic nerve ischemia in rat. Brain Res. 2006; 1096: 20–29 [DOI] [PubMed] [Google Scholar]
- 10. Bernstein SL, Guo Y, Kelman SE, Flower RW, Johnson MA. Functional and cellular responses in a novel rodent model of anterior ischemic optic neuropathy. Invest Ophthalmol Vis Sci. 2003; 44: 4153–4162 [DOI] [PubMed] [Google Scholar]
- 11. Goldenberg-Cohen N, Guo Y, Margolis F, Cohen Y, Miller NR, Bernstein SL. Oligodendrocyte dysfunction after induction of experimental anterior optic nerve ischemia. Invest Ophthalmol Vis Sci. 2005; 46: 2716–2725 [DOI] [PubMed] [Google Scholar]
- 12. Danylkova NO, Alcala SR, Pomeranz HD, McLoon LK. Neuroprotective effects of brimonidine treatment in a rodent model of ischemic optic neuropathy. Exp Eye Res. 2007; 84: 293–301 [DOI] [PubMed] [Google Scholar]
- 13. Bernstein SL, Guo Y, Slater BJ, Puche A, Kelman SE. Neuron stress and loss following rodent anterior ischemic optic neuropathy in double-reporter transgenic mice. Invest Ophthalmol Vis Sci. 2007; 48: 2304–2310 [DOI] [PubMed] [Google Scholar]
- 14. Slater BJ, Mehrabian Z, Guo Y, Hunter A, Bernstein SL. Rodent anterior ischemic optic neuropathy (rAION) induces regional retinal ganglion cell apoptosis with a unique temporal pattern. Invest Ophthalmol Vis Sci. 2008; 49: 3671–3676 [DOI] [PMC free article] [PubMed] [Google Scholar]
- 15. Kupersmith MJ, Kardon R, Durbin M, Horne M, Shulman J. Scanning laser polarimetry reveals status of RNFL integrity in eyes with optic nerve head swelling by OCT. Invest Ophthalmol Vis Sci. 2012; 53: 1962–1970 [DOI] [PMC free article] [PubMed] [Google Scholar]
- 16. Drexler W. Cellular and functional optical coherence tomography of the human retina: the Cogan lecture. Invest Ophthalmol Vis Sci. 2007; 48: 5339–5351 [DOI] [PubMed] [Google Scholar]
- 17. Gabriele ML, Wollstein G, Ishikawa H, et al. Optical coherence tomography: history, current status, and laboratory work. Invest Ophthalmol Vis Sci. 2011; 52: 2425–2436 [DOI] [PMC free article] [PubMed] [Google Scholar]
- 18. Srinivasan VJ, Ko TH, Wojtkowski M, et al. Noninvasive volumetric imaging and morphometry of the rodent retina with high-speed, ultrahigh-resolution optical coherence tomography. Invest Ophthalmol Vis Sci. 2006; 47: 5522–5528 [DOI] [PMC free article] [PubMed] [Google Scholar]
- 19. El Beltagi TA, Bowd C, Boden C, et al. Retinal nerve fiber layer thickness measured with optical coherence tomography is related to visual function in glaucomatous eyes. Ophthalmology. 2003; 110: 2185–2191 [DOI] [PubMed] [Google Scholar]
- 20. Hood DC, Kardon RH. A framework for comparing structural and functional measures of glaucomatous damage. Prog Retin Eye Res. 2007; 26: 688–710 [DOI] [PMC free article] [PubMed] [Google Scholar]
- 21. Subei AM, Eggenberger ER. Optical coherence tomography: another useful tool in a neuro-ophthalmologist's armamentarium. Curr Opin Ophthalmol. 2009; 20: 462–466 [DOI] [PubMed] [Google Scholar]
- 22. Pasol J. Neuro-ophthalmic disease and optical coherence tomography: glaucoma look-alikes. Curr Opin Ophthalmol. 2011; 22: 124–132 [DOI] [PubMed] [Google Scholar]
- 23. Morgan J, Huckfeldt R, Wong RO. Imaging techniques in retinal research. Exp Eye Res. 2005; 80: 297–306 [DOI] [PubMed] [Google Scholar]
- 24. Leitgeb R, Hitzenberger C, Fercher A. Performance of fourier domain vs. time domain optical coherence tomography. Opt Express. 2003; 11: 889–894 [DOI] [PubMed] [Google Scholar]
- 25. Chen TC, Cense B, Pierce MC, et al. Spectral domain optical coherence tomography: ultra-high speed, ultra-high resolution ophthalmic imaging. Arch Ophthalmol. 2005; 123: 1715–1720 [DOI] [PubMed] [Google Scholar]
- 26. Horowitz J, Fishelzon-Arev T, Rath EZ, Segev E, Geyer O. Comparison of optic nerve head topography findings in eyes with non-arteritic anterior ischemic optic neuropathy and eyes with glaucoma. Graefes Arch Clin Exp Ophthalmol. 2010; 248: 845–851 [DOI] [PubMed] [Google Scholar]
- 27. Huber G, Beck SC, Grimm C, et al. Spectral domain optical coherence tomography in mouse models of retinal degeneration. Invest Ophthalmol Vis Sci. 2009; 50: 5888–5895 [DOI] [PMC free article] [PubMed] [Google Scholar]
- 28. Fischer MD, Huber G, Beck SC, et al. Noninvasive, in vivo assessment of mouse retinal structure using optical coherence tomography. PLoS One. 2009; 4: e7507 [DOI] [PMC free article] [PubMed] [Google Scholar]
- 29. Kim KH, Puoris'haag M, Maguluri GN, et al. Monitoring mouse retinal degeneration with high-resolution spectral-domain optical coherence tomography. J Vis. 2008; 8: 17.1–17.11 [DOI] [PubMed] [Google Scholar]
- 30. Gabriele ML, Ishikawa H, Schuman JS, et al. Optic nerve crush mice followed longitudinally with spectral domain optical coherence tomography. Invest Ophthalmol Vis Sci. 2011; 52: 2250–2254 [DOI] [PMC free article] [PubMed] [Google Scholar]
- 31. Nagata A, Higashide T, Ohkubo S, Takeda H, Sugiyama K. In vivo quantitative evaluation of the rat retinal nerve fiber layer with optical coherence tomography. Invest Ophthalmol Vis Sci. 2009; 50: 2809–2815 [DOI] [PubMed] [Google Scholar]
- 32. Nakano N, Ikeda HO, Hangai M, et al. Longitudinal and simultaneous imaging of retinal ganglion cells and inner retinal layers in a mouse model of glaucoma induced by N-methyl-D-aspartate. Invest Ophthalmol Vis Sci. 2011; 52: 8754–8762 [DOI] [PubMed] [Google Scholar]
- 33. Hein K, Gadjanski I, Kretzschmar B, et al. An optical coherence tomography study on degeneration of retinal nerve fiber layer in rats with autoimmune optic neuritis. Invest Ophthalmol Vis Sci. 2012; 53: 157–163 [DOI] [PubMed] [Google Scholar]
- 34. Wang RS, Lv PL, Wang WJ, et al. Establishing an experimental model of photodynamically induced anterior ischemic optic neuropathy. Vis Neurosci. 2011; 28: 155–162 [DOI] [PubMed] [Google Scholar]
- 35. Maekubo T, Chuman H, Kodama Y, Nao IN. Evaluation of inner retinal thickness around the optic disc using optical coherence tomography of a rodent model of nonarteritic ischemic optic neuropathy. Jpn J Ophthalmol. 2013; 57: 327–332 [DOI] [PubMed] [Google Scholar]
- 36. Fortune B, Choe TE, Reynaud J, et al. Deformation of the rodent optic nerve head and peripapillary structures during acute intraocular pressure elevation. Invest Ophthalmol Vis Sci. 2011; 52: 6651–6661 [DOI] [PubMed] [Google Scholar]
- 37. Fatehee N, Yu PK, Morgan WH, Cringle SJ, Yu DY. Correlating morphometric parameters of the porcine optic nerve head in spectral domain optical coherence tomography with histological sections. Br J Ophthalmol. 2011; 95: 585–589 [DOI] [PubMed] [Google Scholar]
- 38. Contreras I, Rebolleda G, Noval S, Munoz-Negrete FJ. Optic disc evaluation by optical coherence tomography in nonarteritic anterior ischemic optic neuropathy. Invest Ophthalmol Vis Sci. 2007; 48: 4087–4092 [DOI] [PubMed] [Google Scholar]
- 39. Alasil T, Tan O, Lu AT, Huang D, Sadun AA. Correlation of Fourier domain optical coherence tomography retinal nerve fiber layer maps with visual fields in nonarteritic ischemic optic neuropathy. Ophthalmic Surg Lasers Imaging. 2008; 39: S71–S79 [DOI] [PMC free article] [PubMed] [Google Scholar]
- 40. Bellusci C, Savini G, Carbonelli M, Carelli V, Sadun AA, Barboni P. Retinal nerve fiber layer thickness in nonarteritic anterior ischemic optic neuropathy: OCT characterization of the acute and resolving phases. Graefes Arch Clin Exp Ophthalmol. 2008; 246: 641–647 [DOI] [PubMed] [Google Scholar]
- 41. Contreras I, Noval S, Rebolleda G, Munoz-Negrete FJ. Follow-up of nonarteritic anterior ischemic optic neuropathy with optical coherence tomography. Ophthalmology. 2007; 114: 2338–2344 [DOI] [PubMed] [Google Scholar]
- 42. Deleon-Ortega J, Carroll KE, Arthur SN, Girkin CA. Correlations between retinal nerve fiber layer and visual field in eyes with nonarteritic anterior ischemic optic neuropathy. Am J Ophthalmol. 2007; 143: 288–294 [DOI] [PMC free article] [PubMed] [Google Scholar]
- 43. Savini G, Bellusci C, Carbonelli M, et al. Detection and quantification of retinal nerve fiber layer thickness in optic disc edema using stratus OCT. Arch Ophthalmol. 2006; 124: 1111–1117 [DOI] [PubMed] [Google Scholar]
- 44. Chan CK, Cheng AC, Leung CK, et al. Quantitative assessment of optic nerve head morphology and retinal nerve fibre layer in non-arteritic anterior ischaemic optic neuropathy with optical coherence tomography and confocal scanning laser ophthalmoloscopy. Br J Ophthalmol. 2009; 93: 731–735 [DOI] [PubMed] [Google Scholar]
- 45. Hood DC, Anderson S, Rouleau J, et al. Retinal nerve fiber structure versus visual field function in patients with ischemic optic neuropathy: a test of a linear model. Ophthalmology. 2008; 115: 904–910 [DOI] [PMC free article] [PubMed] [Google Scholar]
- 46. Aggarwal D, Tan O, Huang D, Sadun AA. Patterns of ganglion cell complex and nerve fiber layer loss in nonarteritic ischemic optic neuropathy by fourier-domain optical coherence tomography. Invest Ophthalmol Vis Sci. 2012; 53: 4539–4545 [DOI] [PMC free article] [PubMed] [Google Scholar]
- 47. Papchenko T, Grainger BT, Savino PJ, Gamble GD, Danesh-Meyer HV. Macular thickness predictive of visual field sensitivity in ischaemic optic neuropathy. Acta Ophthalmol. 2012; 90: e463–e469 [DOI] [PubMed] [Google Scholar]
- 48. Mwanza JC, Durbin MK, Budenz DL, et al. Glaucoma diagnostic accuracy of ganglion cell-inner plexiform layer thickness: comparison with nerve fiber layer and optic nerve head. Ophthalmology. 2012; 119: 1151–1158 [DOI] [PubMed] [Google Scholar]
- 49. Kardon RH. Role of the macular optical coherence tomography scan in neuro-ophthalmology. J Neuroophthalmol. 2011; 31: 353–361 [DOI] [PMC free article] [PubMed] [Google Scholar]
- 50. Moreno PA, Konno B, Lima VC, et al. Spectral-domain optical coherence tomography for early glaucoma assessment: analysis of macular ganglion cell complex versus peripapillary retinal nerve fiber layer. Can J Ophthalmol. 2011; 46: 543–547 [DOI] [PubMed] [Google Scholar]
- 51. Bai Y, Xu J, Brahimi F, Zhuo Y, Sarunic MV, Saragovi HU. An agonistic TrkB mAb causes sustained TrkB activation, delays RGC death, and protects the retinal structure in optic nerve axotomy and in glaucoma. Invest Ophthalmol Vis Sci. 2010; 51: 4722–4731 [DOI] [PubMed] [Google Scholar]
- 52. Hayreh SS. Anterior ischaemic optic neuropathy: differentiation of arteritic from non-arteritic type and its management. Eye (Lond). 1990; 4 (pt 1): 25–41 [DOI] [PubMed] [Google Scholar]
- 53. Arnold AC. Anterior ischemic optic neuropathy. Semin Ophthalmol. 1995; 10: 221–233 [DOI] [PubMed] [Google Scholar]
- 54. Kupersmith MJ, Sibony P, Mandel G, Durbin M, Kardon RH. Optical coherence tomography of the swollen optic nerve head: deformation of the peripapillary retinal pigment epithelium layer in papilledema. Invest Ophthalmol Vis Sci. 2011; 52: 6558–6564 [DOI] [PMC free article] [PubMed] [Google Scholar]
- 55. Dotan G, Goldstein M, Kesler A, Skarf B. Long-term retinal nerve fiber layer changes following nonarteritic anterior ischemic optic neuropathy. Clin Ophthalmol. 2013; 7: 735–740 [DOI] [PMC free article] [PubMed] [Google Scholar]
- 56. May CA, Lutjen-Drecoll E. Morphology of the murine optic nerve. Invest Ophthalmol Vis Sci. 2002; 43: 2206–2212 [PubMed] [Google Scholar]
- 57. Chen CS, Johnson MA, Flower RA, Slater BJ, Miller NR, Bernstein SL. A primate model of nonarteritic anterior ischemic optic neuropathy. Invest Ophthalmol Vis Sci. 2008; 49: 2985–2992 [DOI] [PMC free article] [PubMed] [Google Scholar]
- 58. Salgado C, Vilson F, Miller NR, Bernstein SL. Cellular inflammation in nonarteritic anterior ischemic optic neuropathy and its primate model. Arch Ophthalmol. 2011; 129: 1583–1591 [DOI] [PMC free article] [PubMed] [Google Scholar]
- 59. Zhang C, Guo Y, Slater BJ, Miller NR, Bernstein SL. Axonal degeneration, regeneration and ganglion cell death in a rodent model of anterior ischemic optic neuropathy (rAION). Exp Eye Res. 2010; 91: 286–292 [DOI] [PMC free article] [PubMed] [Google Scholar]
- 60. Chan CK, Miller NR. Peripapillary nerve fiber layer thickness measured by optical coherence tomography in patients with no light perception from long-standing nonglaucomatous optic neuropathies. J Neuroophthalmol. 2007; 27: 176–179 [DOI] [PubMed] [Google Scholar]
- 61. Siliprandi R, Canella R, Carmignoto G, et al. N-methyl-D-aspartate-induced neurotoxicity in the adult rat retina. Vis Neurosci. 1992; 8: 567–573 [DOI] [PubMed] [Google Scholar]
- 62. Kocaoglu OP, Uhlhorn SR, Hernandez E, et al. Simultaneous fundus imaging and optical coherence tomography of the mouse retina. Invest Ophthalmol Vis Sci. 2007; 48: 1283–1289 [DOI] [PubMed] [Google Scholar]
- 63. Xu J, Molday LL, Molday RS, Sarunic MV. In vivo imaging of the mouse model of X-linked juvenile retinoschisis with fourier domain optical coherence tomography. Invest Ophthalmol Vis Sci. 2009; 50: 2989–2993 [DOI] [PMC free article] [PubMed] [Google Scholar]
- 64. Buttery RG, Hinrichsen CF, Weller WL, Haight JR. How thick should a retina be: a comparative study of mammalian species with and without intraretinal vasculature. Vision Res. 1991; 31: 169–187 [DOI] [PubMed] [Google Scholar]