

Abstract
Selected Reaction Monitoring (SRM) is a method of choice for accurate quantitation of low-abundance proteins in complex backgrounds. This strategy is, however, sensitive to interference from other components in the sample that have the same precursor and fragment masses as the monitored transitions. We present here an approach to detect interference by using the expected relative intensity of SRM transitions. We also designed an algorithm to automatically detect the linear range of calibration curves. These approaches were applied to the experimental data of Clinical Proteomic Tumor Analysis Consortium (CPTAC) Verification Work Group Study 7 and show that the corrected measurements provide more accurate quantitation than the uncorrected data.
1. Introduction
Selected Reaction Monitoring (SRM) mass spectrometry has increasingly been used to develop assays for precise quantitation of low-abundance proteins in complex biological matrices [1], [2]. The technique was introduced in the late 1970s [3] for analyzing small molecules [4], and its application for protein quantitation has been an active research topic during the past decade. Figure 1 below shows the schematic work-flow of SRM-MS assays for protein quantitation. Proteins are extracted from biological samples and enzymatically digested. Heavy-isotope versions of the peptides of interest are added to the samples, and the mixture is analyzed by Liquid Chromatography Mass Spectrometry (LC-MS). Most typically a triple quadrupole mass spectrometer [5] is used for SRM assays. In a triple quadrupole mass spectrometer, quadrupole 1 (Q1) and quadrupole 3 (Q3) serve as mass filters for selecting precursor ions and fragment ions with m/z values that define the transitions that are monitored and quadrupole 2 (Q2) is used as a collision cell for fragmenting the peptides. Because only the selected transitions are monitored instead of acquiring the entire tandem mass spectra, the speed of analysis is very fast. During the sample preparation and measurement, there is always variation in the experimental conditions that is difficult to control. Therefore, isotopically labeled reference peptides [6], [7] are often used as internal standards in SRM assays in order to reduce the effects of this variation [8]. These isotopically labeled reference peptides are created by replacing a 4-10 atoms of 12C and 14N in a selected amino acid (e.g. Arginine, Lysine, Valine, Isoleucine) with 13C and 15N, respectively. The isotopically labeled version of the analyte (Figure 1) behaves identically to the analyte peptides in the different experimental steps except that in the mass spectrometer they are distinguishable based on the masses of the precursor and fragment ions [9–14].
Figure 1.

Schematic work flow of quantitation by SRM coupled with stable isotope dilution (SID). The heavy labeled peptides are shown in red and the light ones in blue.
Over the past decade, SRM has been the technology of choice for accurate quantitation of selected peptides in complex biological samples. However, the frequent occurrence of interferences is a significant problem which causes inaccurate quantitation of peptides [15], [16]. The key factor contributing to this problem is that other components in a sample may have the same precursor and fragment masses as the monitored transitions. The interference problem only gets worse with some of the newer strategies that attempt to collect fragmentation information on all peptides simultaneously by using wider isolation windows that allow scanning of the mass range of interest in a data independent fashion [17–20]. With the current generation of AB Sciex time-of-flight instruments, the smallest size of isolation window that can be accommodated in these data independent fragmentation strategies is approximately 20-25 Da [18] – in most such cases many peptides will be isolated and fragmented together, and new software is needed for effective analysis of these mixed spectra. The Thermo Scientific Orbitrap-based Q Exactive now allows the use of discontinuous isolation windows (e.g. 5 × 4 Da windows). If the these 5 discontinuous windows are selected at random, each window will be grouped with different windows each time, and this makes it is possible to deconvolute the mixed spectra [21] more easily. The advantage of these data independent acquisition methods that use wide isolation windows is that they enable data collection without making decisions during data acquisition, thus making the measurements more versatile. However, the price paid for this versatility is an increase in potential interferences.
Currently, manual inspection is typically used to identify the interferences. To address the time-intensive and error-prone nature of manual inspection, we have developed an algorithm to automatically detect and correct the interference using the expected relative intensity of SRM transitions. Previous studies [11], [15], [22], [23] have devised methods to detect interferences in SRM assays. In one of these methods, AuDIT [15], the relative ratio of the analyte and the relative ratio of stable isotope-labeled internal standard are compared to detect interference, and the method requires the use of a stable isotope-labeled internal standard. The novel aspects of the present approach include that it can be applied to experiments where stable isotope standards are not used. Our method detects outliers in the relative intensity of SRM transitions and automatically detect the linear range of the measurements to detect inferences, which can be easily understood and implemented compared with using multiple properties of SRM in the algorithm. The threshold for the outliers were determined by computational simulation.
2. Materials and methods
2. 1 Experimental Data
The experimental data were taken from CPTAC Verification Work Group Study 7 [16] (http://cptac.tranche.proteomecommons.org/study7.html). This data set contains results from a multi-laboratory study designed to assess the performance of SRM assays. Eight laboratories measured 10 peptides in human plasma in the concentration range of 1-500 fmol/μl, and corresponding stable isotope labeled internal standard peptides were added to each sample. Three SRM transitions for each peptide were monitored. Each analysis was repeated 4 times at each laboratory. Figure 2 shows examples of experimental data for two peptides: (A) a peptide with no apparent interference (i.e. for all transitions the measured and actual concentrations are close), and (B) a peptide with interference in one of its monitored transitions (i.e. the measured concentrations are higher than the actual concentrations, especially for low concentrations).
Figure 2. Experimental data.

The measured concentration as a function of the actual concentration for two different peptides with three transitions and 4 technical replicates. The three transitions are shown as blue circles, black squares, and red triangle for transitions tr1, tr2, and tr3, respectively. (A) Example of a peptide with no interference. (B) Example of peptide with interference in transition one.
2.2 Interference Detection
In the absence of interference, the relative intensity of different transitions for a peptide is a property of the peptide sequence and the mass spectrometric method (the energy and method of fragmentation and the analysis time), and it is independent of peptide concentration. Therefore, we use the relative intensities of transition to detect interference. In Figure 3 the relative intensities are shown for the two peptides in Figure 2. In the absence of interference, the ratios are constant, with increasing noise at lower amounts. In contrast, when there is interference for one transition, the corresponding ratios deviate from the expected (constant) ratios. Based on these observations, an approach was developed to detect the interference by comparing the ratio of the intensity of pairs of transitions with the expected ratio from which a Z-score for the deviation is calculated:
Figure 3. Relative intensities of transitions.

The relative intensity as a function of the actual concentration for two different peptides with three transitions and 4 technical replicates (same peptides as in Figure 2). The three ratios are shown as yellow circles, blue squares, and red diamonds for transitions tr2/tr1, tr3/t1, and tr2/tr3, respectively. (A) In the absence of interference, the ratios are constant, with increasing noise at lower concentrations. (B) With interference in one transition, the corresponding ratios deviate from the expected constant ratios.
| (1) |
where Ij is the measured log intensity of transition j, Ii is the measured log intensity of transition i, rji is the expected transition ratio, which is equal to the median of transition ratios from the measurements of all different concentrations of one peptide and σji is the standard deviation of relative intensities calculated from the four repeated analyses for each concentration of samples of each peptide. Zji represents the number of standard deviations that the ratio between the intensities of transitions j and i deviate from the expected transition ratio. If interference occurs to transition i, it will cause an increase in Ii. Hence, the worse interference is, the larger Zji is. The maximum function guarantees that the transition which has the largest interference is detected. A transition is considered to have no interference only when it does not have outliers of intensity ratios, i.e. Zi is smaller than a threshold Zth.
2.3 Threshold Estimation
To maximize the accuracy of quantitation, a threshold, Zth, needs to be selected which balances the need for removal of interference with the need for retaining data to obtain sufficient statistics. Computer simulations were used to investigate the effect on the quantitation of the noise and the interference detection threshold. It was assumed that the data set had no interference but did have noise. The expected relative intensity of the transitions for the sample was set to be 1:1:1 and the relative noise was assumed to be 0.2 and normally distributed. 10,000 simulations were executed by adding noise to transitions randomly based on the noise rate. Interference detection was performed on the simulated data (even though there was no interference but only noise). Figure 4 below shows the results of computer simulations using the approach from section 2.2 above that detects interference by measuring the deviation of the intensity ratios of transitions from the expected ratios. Zth equal to infinity corresponds to no interference detection (black curve with centroid equal to zero since there is only noise and no interference). If a low threshold (e.g. Zth=0) is applied, the distribution will be distorted since high intensity values are selectively removed. As the value of Zth is increased from 0 to larger numbers, the distortion of the distribution decreases (Figure 4A) and the centroid (Figure 4B) moves closer to zero. In Supplementary Figure 1.1 (http://fenyolab.org/data/12_bao_methods/12_bao_methods_suppl_fig1.pdf), more noise ratios and relative intensities are simulated. The three noise ratios: 0.2, 0.4 and 0.6 are colored and shaped differently. The simulation shows the centroid and width of corrected relative error distributions as different thresholds are selected under the assumption that there is no interference. The result is consistent with Figure 4. Supplementary Figures 1.2-1.7 show the effect of selecting different interference removal thresholds when there is both noise and interference. Based on these simulations, an interference detection threshold corresponding to two standard deviations of the noise was selected as a reasonable trade-off between interference detection sensitivity and specificity.
Figure 4. Simulation for interference detection threshold.

(A) Relative error distributions for threshold Zth=∞, Zth=0, Zth=1 and Zth=2 respectively. (B) The distribution centroid as a function of threshold.
2.4 Linear Range Detection
In cases when a calibration curve has been obtained for an SRM assay it is useful to automatically find the linear range of the assay. Deviation from linear dependence at low amounts is usually caused by increase in the uncertainty of the measurements when the limit of quantitation is approached, or that the peptide studied is already present in the matrix at low amounts. At high amounts, saturation can cause deviation from linear behavior. Figure 5A shows an example where the measurements at low amounts deviate from the actual concentrations, probably because of the presence of the peptide in the matrix at low amounts. In this case the measurements of all three transitions shift from the diagonal, and Figure 5B shows that the relative intensities of transitions are almost constant on the low concentrations side. Hence, it is a different type of interference that cannot be detected using the method described in section 2.2. To address this problem, we developed an algorithm to automatically detect the linear range of a calibration curve.
Figure 5. Example of peptide where the concentration dependence deviates from linear for low concentrations.

(A) Intensities of transitions. (B) Relative intensities of transitions.
It is assumed that a data set Θ = {(x, y) | x ∈ actual _ conc, y ∈ measured _ conc} where actual _ conc represents the set of log base 2 of actual concentrations, and measured _ conc represents the set of log base 2 of measured concentrations. First, three elements are selected from Θ and fitted to a linear function f(x) = kx+; b to determine the slope, k. Second, the errors for all the three which represents the deviation between the slope of linear range and the expected line x = y are calculated using formula (2) below.
| (2) |
If the error of the three elements are all smaller than a set threshold (here selected to be 30%), an attempt is made to elongate the linear range by moving one element forward in the set Θ and calculate the linear regression for the next three elements. The linear range will be extended until no more elements can be added and all the data in Θ have been tested. Finally, the algorithm returns the longest linear range.
2.5 Implementation
Data preprocessing, interference detection, and linear range detection were programmed in Perl (perldoc.perl.org) on a Windows platform. Statements of R [24] (a statistical programming language) were called from Perl in order to plot the data. After obtaining the necessary data and the required data format from the preprocessing step, the transition ratios for the measurements of each peptide from each laboratory were calculated. Based on the algorithm of section 2.2, outliers of the transitions ratios were found. The measurements were corrected by removing the transitions with interference and the peptide quantity was calculated using only the transitions without interference, and subsequently the linear range detection algorithm was applied to the data.
3. Results and Discussion
3.1 Results of the interference detection and correction approach applied to experimental data
The method was applied to the CPTAC study Verification Work Group Study 7 data to detect and correct interference (Figure 6 and Supplementary Figure 2 http://fenyolab.org/data/12_bao_methods/12_bao_methods_suppl_fig2.pdf). Figure 6 shows three examples of the performance of our interference detection and correction method with regard to three aspects: measurements without interference are not distorted and are left uncorrected (Figure 6A) interference can be detected and corrected (Figure 6B); and the linear range can be detected (Figure 6C).
Figure 6. Correction of interference and linear range detection.
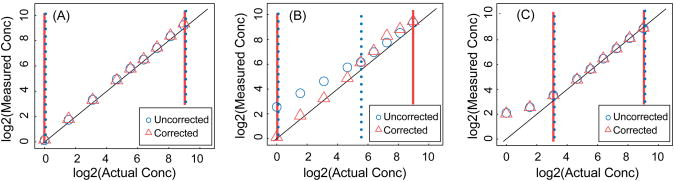
Uncorrected (blue circles) and corrected (red triangles) measurements, calculated by averaging over the transitions and the technical replicates for the three example peptides from Figure 2A, Figure 2B and Figure 5A. In the corrected data, the transitions with interference were removed and the peptide quantity was calculated using only the transitions without interference. The blue dotted line and the red solid line show the linear range of uncorrected and corrected measurements, respectively.
3.2 Overcorrection when the estimated standard deviation is low
Because the standard deviation, σ, in Equation 1 is estimated using technical replicates, this estimation can sometimes be too low, and lead to overcorrection and rejection of good measurements. Figure 7A shows an example in which the measurements at the highest concentrations were all flagged as incorrect by our interference detection method, because the estimation of the standard deviation of the measurements for the highest concentration was too low; hence, the Z-score was bigger than the threshold, and all transitions were rejected. To overcome this problem of underestimating the standard deviation, we introduce a minimum allowable value for the standard deviation, which is a property of the instrumentation used and the experimental design. To find an appropriate minimum value for these experiments, the standard deviations of the four technical replicates were studied. Figure 7B shows the frequency distribution for the standard deviation, and the minimum was selected to be 0.02 so that 95% of the standard deviation measurements were higher. This choice of minimum removed the false corrections due to underestimation of the standard deviation for the whole data set, but it did not affect the capability of the algorithm to detect interference.
Figure 7.

(A) Example of a peptide where the variation of relative transitions is very small between the technical replicates at high concentrations. (B)The frequency of standard deviation values for an example of peptide.
4 Conclusions
In conclusion, we presented a straight-forward method for detection and correction of interference that uses the expected relative intensity of SRM transitions, and an estimation of the noise from measurements of technical replicates. Computer simulations were used to select the optimal interference detection threshold. In addition, an algorithm to automatically detect the linear range of a calibration curve was developed and combined with the method for interference detection. Information about the interferences can be used either to correct or to reject measurements, yielding a straightforward strategy that improves SRM quantitation. The tool for detecting and correcting interference in SRM analysis is freely available http://fenyolab.org/tools/srm-interference/.
Acknowledgments
This work was supported by funding provided by the National Institutes of Health Grants CA126485, CA160035, GM103314, GM098256 and GM103362.
References
- 1.Gallien S, Duriez E, Domon B. Selected reaction monitoring applied to proteomics. Mass Spectrom. 2011 Mar;46, no. 3:298–312. doi: 10.1002/jms.1895. [DOI] [PubMed] [Google Scholar]
- 2.Marx V. Targeted proteomics. Nature Methods. 2013;10, no. 1:19–22. doi: 10.1038/nmeth.2285. [DOI] [PubMed] [Google Scholar]
- 3.Baty JD, Robinson PR. Single and multiple ion recording techniques for the analysis of diphenylhydantoin and its major metabolite in plasma. Biomedical Mass Spectrometry. 1977 Feb;4, no. 1:36. doi: 10.1002/bms.1200040104. [DOI] [PubMed] [Google Scholar]
- 4.Hoke S, Morand K, Greis K, Baker T, Harbol K, Dobson R. Transformations in pharmaceutical research and development, driven by innovations in multidimensional mass spectrometry-based technologies. International Journal of Mass Spectrometry. 2001;212, no. 1:135–196. [Google Scholar]
- 5.Yost RA, Enke CG. Triple quadrupole mass spectrometry for direct mixture analysis and structure elucidation. Analytical Chemistry. 1979 Oct;51, no. 12:1251–1264. doi: 10.1021/ac50048a002. [DOI] [PubMed] [Google Scholar]
- 6.Van Langenhove A, Costello CE, Biller JE, Biemann K, Browne TR. A gas chromatographic/mass spectrometric method for the simultaneous quantitation of 5,5-diphenylhydantoin (phenytoin), its para-hydroxylated metabolite and their stable isotope labelled analogs. Clinica Chimica Acta; International Journal of Clinical Chemistry. 1981 Sep;115, no. 3:263–275. doi: 10.1016/0009-8981(81)90240-0. [DOI] [PubMed] [Google Scholar]
- 7.Gaskell SJ, Rollins K, Smith RW, Parker CE. Determination of serum cortisol by thermospray liquid chromatography/mass spectrometry: comparison with gas chromatography/mass spectrometry. Biomedical & Environmental Mass Spectrometry. 1987 Dec;14, no. 12:717–722. doi: 10.1002/bms.1200141205. [DOI] [PubMed] [Google Scholar]
- 8.Anderson L, Hunter CL. Quantitative mass spectrometric multiple reaction monitoring assays for major plasma proteins. Molecular & cellular proteomics: MCP. 2006 Apr;5, no. 4:573–588. doi: 10.1074/mcp.M500331-MCP200. [DOI] [PubMed] [Google Scholar]
- 9.Barr JR, Maggio VL, Patterson DG, Jr, Cooper GR, Henderson LO, Turner WE, Smith SJ, Hannon WH, Needham LL, Sampson EJ. Isotope dilution--mass spectrometric quantification of specific proteins: model application with apolipoprotein A-I. Clin Chem. 1996 Oct;42, no. 10:1676–1682. [PubMed] [Google Scholar]
- 10.Gerber SA, Rush J, Stemman O, Kirschner MW, Gygi SP. Absolute quantification of proteins and phosphoproteins from cell lysates by tandem MS. Proc Natl Acad Sci USA. 2003 Jun;100, no. 12:6940–6945. doi: 10.1073/pnas.0832254100. [DOI] [PMC free article] [PubMed] [Google Scholar]
- 11.Keshishian H, Addona T, Burgess M, Kuhn E, Carr SA. Quantitative, multiplexed assays for low abundance proteins in plasma by targeted mass spectrometry and stable isotope dilution. Mol Cell Proteomics. 2007 Dec;6, no. 12:2212–2229. doi: 10.1074/mcp.M700354-MCP200. [DOI] [PMC free article] [PubMed] [Google Scholar]
- 12.Kalkum M, Lyon GJ, Chait BT. Detection of secreted peptides by using hypothesis-driven multistage mass spectrometry. Proc Natl Acad Sci USA. 2003 Mar;100, no. 5:2795–2800. doi: 10.1073/pnas.0436605100. [DOI] [PMC free article] [PubMed] [Google Scholar]
- 13.Bondar OP, Barnidge DR, Klee EW, Davis BJ, Klee GG. LC-MS/MS quantification of Zn-alpha2 glycoprotein: a potential serum biomarker for prostate cancer. Clin Chem. 2007 Apr;53, no. 4:673–678. doi: 10.1373/clinchem.2006.079681. [DOI] [PubMed] [Google Scholar]
- 14.Desiderio DM, Kai M. Preparation of stable isotope-incorporated peptide internal standards for field desorption mass spectrometry quantification of peptides in biologic tissue. Biomed Mass Spectrom. 1983 Aug;10, no. 8:471–479. doi: 10.1002/bms.1200100806. [DOI] [PubMed] [Google Scholar]
- 15.Abbatiello SE, Mani DR, Keshishian H, Carr SA. Automated detection of inaccurate and imprecise transitions in peptide quantification by multiple reaction monitoring mass spectrometry. Clinical Chemistry. 2010 Feb;56, no. 2:291–305. doi: 10.1373/clinchem.2009.138420. [DOI] [PMC free article] [PubMed] [Google Scholar]
- 16.Addona TA, Abbatiello SE, Schilling B, Skates SJ, Mani DR, Bunk DM, Spiegelman CH, Zimmerman LJ, Ham AJL, Keshishian H, Hall SC, Allen S, Blackman RK, Borchers CH, Buck C, Cardasis HL, Cusack MP, Dodder NG, Gibson BW, Held JM, Hiltke T, Jackson A, Johansen EB, Kinsinger CR, Li J, Mesri M, Neubert TA, Niles RK, Pulsipher TC, Ransohoff D, Rodriguez H, Rudnick PA, Smith D, Tabb DL, Tegeler TJ, Variyath AM, Vega-Montoto LJ, Wahlander A, Waldemarson S, Wang M, Whiteaker JR, Zhao L, Anderson NL, Fisher SJ, Liebler DC, Paulovich AG, Regnier FE, Tempst P, Carr SA. Multi-site assessment of the precision and reproducibility of multiple reaction monitoring-based measurements of proteins in plasma. Nature Biotechnology. 2009 Jul;27, no. 7:633–641. doi: 10.1038/nbt.1546. [DOI] [PMC free article] [PubMed] [Google Scholar]
- 17.Bern M, Finney G, Hoopmann MR, Merrihew G, Toth MJ, MacCoss MJ. Deconvolution of mixture spectra from ion-trap data-independent-acquisition tandem mass spectrometry. Analytical chemistry. 2010 Feb;82, no. 3:833–841. doi: 10.1021/ac901801b. [DOI] [PMC free article] [PubMed] [Google Scholar]
- 18.Bateman RH, Carruthers R, Hoyes JB, Jones C, Langridge JI, Millar A, Vissers JPC. A novel precursor ion discovery method on a hybrid quadrupole orthogonal acceleration time-of-flight (Q-TOF) mass spectrometer for studying protein phosphorylation. Journal of the American Society for Mass Spectrometry. 2002 Jul;13, no. 7:792–803. doi: 10.1016/S1044-0305(02)00420-8. [DOI] [PubMed] [Google Scholar]
- 19.Gillet LC, Navarro P, Tate S, Röst H, Selevsek N, Reiter L, Bonner R, Aebersold R. Targeted data extraction of the MS/MS spectra generated by data- independent acquisition: a new concept for consistent and accurate proteome analysis. Molecular & cellular proteomics: MCP. 2012 Jun;11, no. 6:O111.016717. doi: 10.1074/mcp.O111.016717. [DOI] [PMC free article] [PubMed] [Google Scholar]
- 20.Silva JC, Denny R, Dorschel CA, Gorenstein M, Kass IJ, Li GZ, McKenna T, Nold MJ, Richardson K, Young P, Geromanos S. Quantitative proteomic analysis by accurate mass retention time pairs. Analytical chemistry. 2005 Apr;77, no. 7:2187–2200. doi: 10.1021/ac048455k. [DOI] [PubMed] [Google Scholar]
- 21.Egertson J, Kuehn A, Merrihew G, Bateman N, Maclean B, Canterbury JD, Kellmann M, Zabrouskov V, Wu Christine, Maccoss MJ. Multiplexed Data Independent Acquisition for Comparative Proteomics, Proceedings of the American Society for Mass Spectrometry. Proceedings of the American Society for Mass Spectrometry. 2012;60 [Google Scholar]
- 22.Röst H, Malmström L, Aebersold R. A computational tool to detect and avoid redundancy in selected reaction monitoring. Mol Cell Proteomics. 2012 Aug;11, no. 8:540–549. doi: 10.1074/mcp.M111.013045. [DOI] [PMC free article] [PubMed] [Google Scholar]
- 23.Domanski D, Percy AJ, Yang J, Chambers AG, Hill JS, Freue GVC, Borchers CH. MRM-based multiplexed quantitation of 67 putative cardiovascular disease biomarkers in human plasma. Proteomics. 2012 Apr;12, no. 8:1222–1243. doi: 10.1002/pmic.201100568. [DOI] [PubMed] [Google Scholar]
- 24.R Development Core Team. R: A Language and Environment for Statistical Computing. 2008;1, no. 10:2673. [Google Scholar]