

Abstract
Isobaric labeling strategies, such as isobaric tags for relative and absolute quantitation (iTRAQ) or tandem mass tags (TMT), have promised to dramatically increase the power of quantitative proteomics. However, when applied to complex mixtures, both the accuracy and precision are undermined by interfering peptide ions that coisolate and cofragment with the target peptide. Additional gas-phase isolation steps, such as proton-transfer ion–ion reactions (PTR) or higher-order MS3 scans, can almost completely eliminate this problem. Unfortunately, these methods come at the expense of decreased acquisition speed and sensitivity. Here we present a method that allows accurate quantification of TMT-labeled peptides at the MS2 level without additional ion purification. Quantification is based on the fragment ion cluster that carries most of the TMT mass balance. In contrast to the use of low m/z reporter ions, the localization of these complement TMT (TMTC) ions in the spectrum is precursor-specific; coeluting peptides do not generally affect the measurement of the TMTC ion cluster of interest. Unlike the PTR or MS3 strategies, this method can be implemented on a wide range of high-resolution mass spectrometers like the quadrupole Orbitrap instruments (QExactive). A current limitation of the method is that the efficiency of TMTC ion formation is affected by both peptide sequence and peptide ion charge state; we discuss potential routes to overcome this problem. Finally, we show that the complement reporter ion approach allows parallelization of multiplexed quantification and therefore holds the potential to multiply the number of distinct peptides that can be quantified in a given time frame.
Mass spectrometry (MS)-based proteomics has undergone remarkable improvements over the past few years, resulting today in the identification of more than 10000 proteins from mammalian samples in a single experiment.1 While protein identification is now mature, accurate quantification among multiple conditions remains a challenge. Unpredictable ionization efficiencies currently prevent absolute quantification of protein abundance in high-throughput experiments. To avoid this limitation, methods have been developed where peptides from different conditions can be isotopically labeled so that their chemical structure is identical but their isotopic composition differs. When analyzed by MS, the relative change in protein abundance can be inferred from the relative abundance of the ions, which are unique to the different conditions investigated.2
Most commonly, peptides are quantified from MS1 spectra, based on relative abundance of differentially labeled species. One example is metabolic labeling.3 Alternatively, peptides from proteins obtained from different experimental conditions can be chemically modified to incorporate stable isotopes for quantification.4 A major disadvantage of these MS1-based quantification methods is that the complexity of the MS1 spectrum increases with the number of differentially modified peptides so that data acquisition speed and sensitivity is reduced due to redundant MS2 collection.5 While multiplexed proteomics with MS1-based quantification is feasible, e.g., reductive dimethylation with Lys-C-digested peptides allows the generation of five distinguishable species, the number of proteins that can be identified and quantified is reduced due to the increased complexity of the spectra. Hence, broad coverage of complex mixtures using MS1-based quantification is currently only used for two or maximally three conditions.6 Thus, there is a great need for a practical means of comparing a large number of samples in a single experiment, without sacrificing depth of coverage.
Isobaric tags, like tandem mass tags (TMT) or isobaric tags for relative and absolute quantitation (iTRAQ), are fundamentally different and promise multiplexed analyses with the potential for deep coverage. Peptides labeled with these tags have indistinguishable masses in the MS1 spectrum, thus not increasing the complexity of the spectrum, but after fragmentation each component of a multiplexed sample produces a reporter ion with unique mass in the low m/z region, which can be used for relative quantification. Presently up to eight channels have been commercialized.7 Isobaric labeling can be combined with traditional MS1-based quantification to increase the multiplexing capacity. An 18-plex experiment has been demonstrated.8
It has become increasingly clear that there is a serious shortcoming of isobaric labeling. When analyzing complex mixtures, peptides selected for fragmentation are typically contaminated by coeluting ions of lower abundance. Reporter ions therefore originate from both target and interfering ions, causing a distortion of the quantification9 (Figure 1). Two strategies have been introduced to overcome this problem. Ting et al. reisolated the most abundant ion in the MS2 spectrum and refragmented it. The resulting reporter ions in the MS3 spectrum were then almost exclusively derived from the target peptide.9a Alternatively, Wenger et al. reduced the charge state of the precursor peptide using proton-transfer ion-ion reactions (PTR) prior to fragmentation, thereby removing interfering ions with different charge states.9b While both methods drastically improve the accuracy and precision of quantification, they come at the cost of decreased data acquisition speed and sensitivity.
Figure 1.
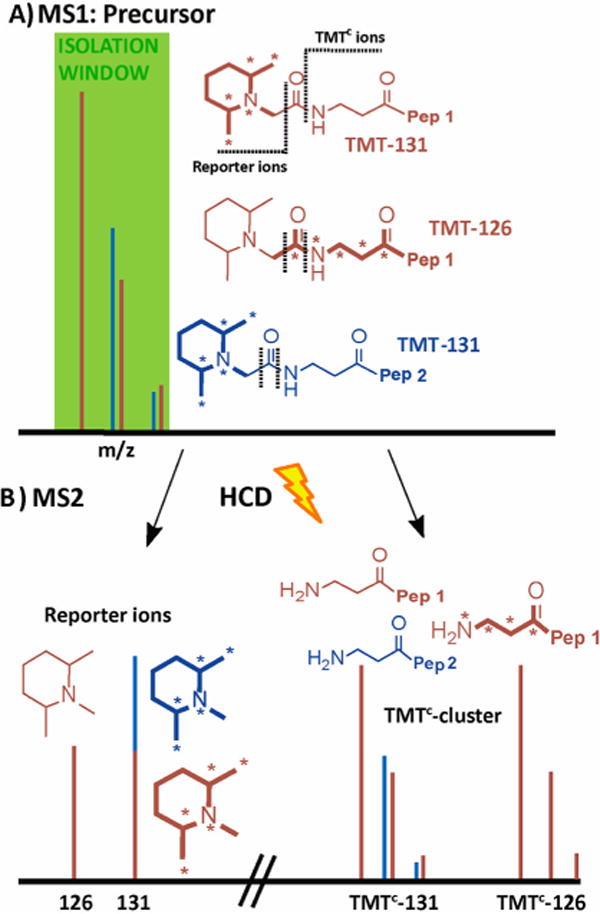
Principle of interference-free quantification based on the TMTC cluster. (A) A peptide (brown) is labeled with TMT-131 or TMT-126 reagents, and both forms are mixed in a ratio of 1:1. Asterisks on the TMT structures indicate heavy isotopes (13C or 15N). An interfering peptide (blue) is coeluting with the peptide of interest within the isolation window for the MS2 spectrum. When peptide ions are subjected to higher-energy collisional dissociation (HCD), the TMT tags fragments at two positions, as indicated with dotted lines. (B) Typically, the MS2 spectrum contains both the reporter ions (left) and the TMTC cluster (right), which contains most of the mass-balancing part of the TMT tag. Quantification based on the reporter ions is inaccurate as interfering peptides produce reporter ions of identical mass. In contrast with high-resolution MS2 spectra, the TMTC ions for the peptide of interest (and any coeluting peptides) can typically be distinguished, and therefore the TMTC ion cluster comprises accurate quantitative information. Note that this approach can be used to quantify multiple peptides in a single MS2 spectrum; e.g., in the toy example shown here the brown peptide ratio for the TMT-126 and TMT-131 channels would be 1:1, whereas the blue peptide ratio would be 0:1.
Here, we introduce an alternative approach for accurate isobaric quantification. It does not require an additional purification step; rather it exploits the high mass accuracy and resolution of modern mass spectrometers, including Orbitrap, FT-IR, and time-of-flight (TOF) instruments. As an alternative to using the reporter ions in the low m/z region of the MS2 spectrum (TMT reporter ions), we quantify sample differences based on the complement TMT fragment ion cluster (TMTC cluster), which originates from partial loss of the TMT tag (Figure 1, Supporting Information Figure 1). TMTC clusters carry the equivalent quantitative information about the relative levels of the differentially labeled peptides as the low-mass reporter ions and are essentially their complement. The position of the TMTC cluster is charge state specific, and the mass accuracy of modern instruments can easily distinguish fragment ions that differ by less than 0.02 m/z, sufficient for accurately quantifying the TMTC clusters. By analyzing mixtures of TMT-labeled yeast and human peptides with known but different mixing ratios, we show that this method generates accurate quantitative data unaffected by interfering peptide ions. Finally, we demonstrate that this method can quantify multiple distinct peptides in the same MS2 spectrum if they are cofragmented. This opens up the future possibility to parallelize quantification of isobarically labeled peptides, potentially multiplying the number of quantified peptides in a multiplexed proteomic experiment.
RESULTS AND DISCUSSION
Complement TMT Ion Cluster
Peptides labeled with any one of six different TMT channels are indistinguishable in the MS1 spectrum but can be quantified upon fragmentation based on their low m/z reporter ions (reporter ions). Upon closer inspection of MS2 spectra from TMT-labeled peptides, we observed another ion cluster that we assigned to peptide ions solely fragmented at a bond within the TMT tags (Figures 1 and 2B). These ions are generated by cleavage of the amide bond of the TMT label (Supporting Information Figure 1A).10 The leaving group typically takes a charge; hence, the TMTC product ions have one less charge than the precursor. We termed these fragment ions complement TMT (TMTC) ions. TMTC ions carry most of the mass-balancing group and, therefore, contain information about the relative differences of the labeled peptides. Because the labeled carbonyl carbon is part of the leaving group, the TMTC-130 and TMTC-129 ions are indistinguishable in our analysis (Supporting Information Figure 1A). These complementary ion clusters are more complicated than their related low-mass reporter ions because each also reflects the isotopic envelope of the labeled peptide. Hence the TMTC ion clusters of neighboring TMT channels overlap. To obtain the relative peptide level ratios we essentially have to deconvolve the TMTC ion cluster with the isotopic envelope of the precursor-peptide ions (Supporting Information Figure 1B). While it seems counterintuitive to use the TMTC cluster for quantification when the low m/z reporter ions quantitative information is easily obtainable, the TMTC ions have the principle advantage that their unique location in the spectrum depends on the exact mass and charge of the tagged peptide (Figure 1B). In contrast, the small TMT reporter ions from both the target and any coisolated peptides are indistinguishable. We therefore reasoned that the peptide-specific TMTC cluster would allow quantification at the MS2 level with negligible interference from coeluting peptides, avoiding the need of an additional gas-phase purification step.
Figure 2.
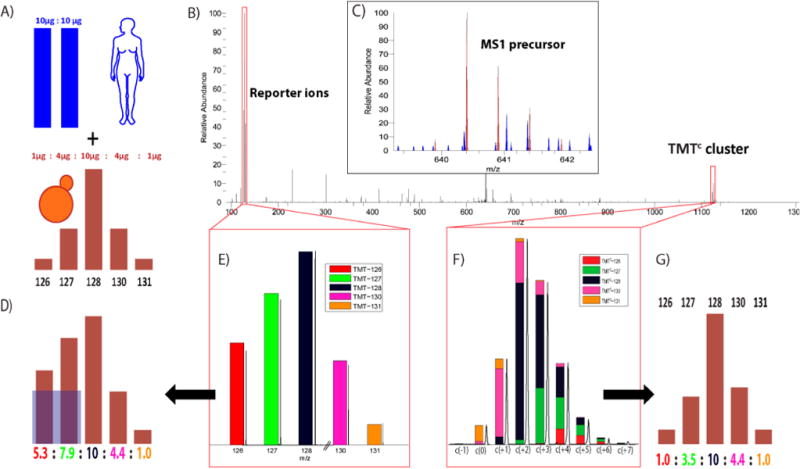
Comparison of TMT reporter ion and TMTC ion cluster quantification. (A) The human–yeast interference sample used throughout this study: peptides from human and yeast cells were digested with Lys-C and TMT-labeled. Amounts of 10 μg (TMT-126) and 10 μg of TMT-127 of human peptides were combined with 1 μg (TMT-126)/4 μg (TMT-127)/10 μg (TMT-128)/4 μg (TMT-130)/1 μg (TMT-131) of yeast peptides. Yeast peptide TMT ion ratio distortion through coisolated and fragmented human peptide ions is measured as interference. (B) MS2 spectrum of yeast peptide (AIELFTK) labeled with five-plex TMT from a run of human–yeast interference sample on a QExactive with 35k nominal resolution setting and ±2 m/z isolation window. (C) Precursor ion cluster m/z range in the full MS spectrum. In this example interfering ions (blue) are visible next to the target precursor ion cluster (brown). (D) Reporter ion quantification is accurate in the interference-free channels (128–131), but a ratio distortion is observed in channels 126 and 127 due to interference of human peptide ions. (E) TMT reporter ion m/z region with colors representing contribution of each of the five channels. After correction of isotopic impurities we obtain the ratios shown in panel D. (F) TMTC ion cluster; c(0) indicates the position of the pseudomonoisotopic peak. Contributions of the five TMT channels (color coded) are optimized so that the summed square-differences between observed and theoretical TMTC clusters are minimal. (G) TMTC ion cluster provides accurate yeast peptide quantification unaffected by interference.
Deconvolution of the TMTC Cluster in an MS2 Spectrum with Significant Interference
To evaluate the accuracy of quantification using the TMTC cluster, and in particular to test its susceptibility to interference, we created a sample of known mixing ratios in which we could identify and quantify the interference of coeluting peptides.9a We combined 1:4:10:4:1 μg of Lys-C-digested yeast peptides labeled with TMT in the channels 126, 127, 128, 130, and 131, respectively. To simulate interference, we added a mixture of 10:10 μg of human Lys-C-digested peptides labeled with TMT-126 and TMT-127, respectively (Figure 2A). We omitted the TMT-129 channel as the TMTC-129 and TMTC-130 ions are indistinguishable (Supporting Information Figure 1A). When we analyzed the interference sample using the traditional TMT reporter ions, we found that peptides exclusive to yeast were accurately quantified in the interference-free channels (128, 130, and 131), but the relative abundance in the channels with human interference (126 and 127) were heavily distorted due to contaminating reporter ions of human origin (Figure 2D). In a real biological sample, where the mixing ratios would be unknown, we would be unable to distinguish which fraction of the reporter ions originated from the peptide of interest and which fraction originated from interfering coeluting peptides.
The MS2 spectrum shown in Figure 2C is from an experiment analyzed on a QExactive with ±2 m/z isolation width, a 90 min gradient, and 35k nominal resolution at 200 m/z. The spectrum identifies the yeast peptide AIELFTK. In the preceding MS1 spectrum, the precursor’s isotopic envelope is marked in brown. Many other peaks (blue) are also visible within the isolation width for the MS2 analysis (Figure 2C). The TMT reporter ions are located in the low m/z region of the MS2 spectrum. The spectrum’s peak height and deduced relative abundance in Figure 2E do not completely agree as the intensity information is derived from the peak area, and we apply correction factors provided by the vendor to compensate for isotopic impurities. The TMTC cluster is located in the high m/z region of the spectrum (Figure 2, parts B and F). In this example the precursor ions carry two charges, while the TMTC ions are singly charged. Unlike the reporter ions, the position of this ion cluster is dependent on the exact mass and charge state of the precursor. We define the peak of TMTC ions that are derived from the TMT-131 labeled pseudomonoisotopic precursor as the c(0) position and label all other peaks relative to this position. While in some spectra the TMTC clusters of coisolated peptides are easily observable (e.g., see Figure 5), often this is not the case. We believe this is due to interference originating from many different, low-abundant peptides, presumably often with different charge states, resulting in very low abundant and highly dispersed TMTC ions throughout the spectrum. We note that PTR experiments performed in the Coon lab demonstrated that isolation of ions with the charge state of the precursor peptide alone was sufficient to remove most interference.9b
Figure 5.
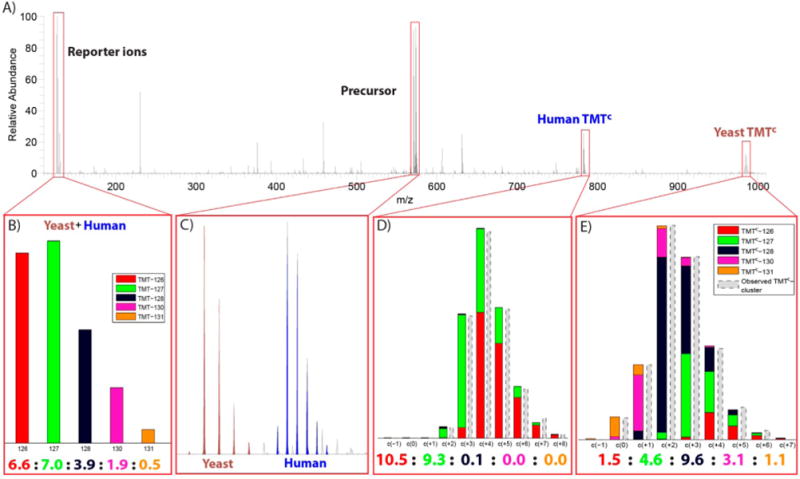
TMTC ion clusters allow quantification of multiple peptides from a single MS2 spectrum. (A) MS2 spectrum from an analysis of the two-proteome human–yeast sample applying a ±3 m/z isolation window. (B) The ratios of the reporter ions (normalized to 20) indicate that peptide ions of both human and yeast origin were fragmented in this MS2 experiment. (C) Intact precursor ions of a doubly charged (brown) and triply charged (blue) peptide ions were detected. The peptide ions were identified as YTTLGK from yeast (+2) and LDEREAGITEK from the human sample (+3). (D) The contribution of each TMT channel (colored) to the TMTC ion cluster of the human peptide is determined through deconvolution. (E) Equivalent representation of the TMTC ion cluster from the yeast peptide. For both panels D and E the ratio predictions based on deconvolution are close to the actual mixing ratios of the yeast and human peptides in the two-proteome sample.
Deducing the original mixing ratios from the TMTC ion cluster is more complicated than deriving it from the low m/z reporter ions. While the mass-balancing part of the TMT tag essentially encodes the relative quantitative information in the same way as the reporter ions, this information is convolved with the isotopic envelope of the labeled peptide. To deduce the original mixing ratio we essentially have to deconvolve the TMTC cluster with the isotopic envelope of the precursor peptide. Also, isotopic impurities from the TMT tags need to be considered (for detailed description of our calculation see the Materials and Methods and supplementary Figures 2 and 3 in the Supporting Information). The TMTC quantification in Figure 2 reports relative ratios of 1.0:3.5:10:4.4:1.0, which indicates similar ratios for channels with and without interference close to the known mixing ratios (Figure 2, parts F and G). In contrast the reporter ion ratios are reported as 5.3:7.9:10:4.4:1.0 with a strong ratio distortion in the channels with interference (compare Figure 2, parts D and G).
Evaluating TMTC Quantification in a Complete Experiment
TMTC quantification across a complete experiment (of which Figure 2 is a sample) is shown in Figure 3. To evaluate the method, we plotted the median of the absolute deviation for the 1:10 and 4:10 channels with and without interference against the number of ions that we could observe in the TMTC cluster (Supporting Information Figure 4A). For further analysis we excluded peptides of fewer than 1000 ions in the TMTC cluster. As an additional measure of quality, we evaluated how well the observed TMTC cluster fit the theoretical distribution (Supporting Information Figure 4B). Figure 3A shows a boxplot of the filtered yeast peptides with ratios normalized to 20. The whiskers reach from the 5th to 95th percentile. Figure 3B depicts the corresponding histograms. While the 126 and 127 channels show a wider ratio distribution than the 130 and 131 channels, the medians for equivalent channels with and without interference are remarkably similar and very close to the known mixing ratios. Outliers seem to be fairly equally distributed among channels with and without interference. We will address the wider distribution for the channels with interference below. Taken together, the boxplot and histograms demonstrate that deconvolution of the TMTC ion cluster faithfully quantifies the isobarically labeled peptides in the MS2 spectrum, despite coeluting human peptides with different mixing ratios.
Figure 3.
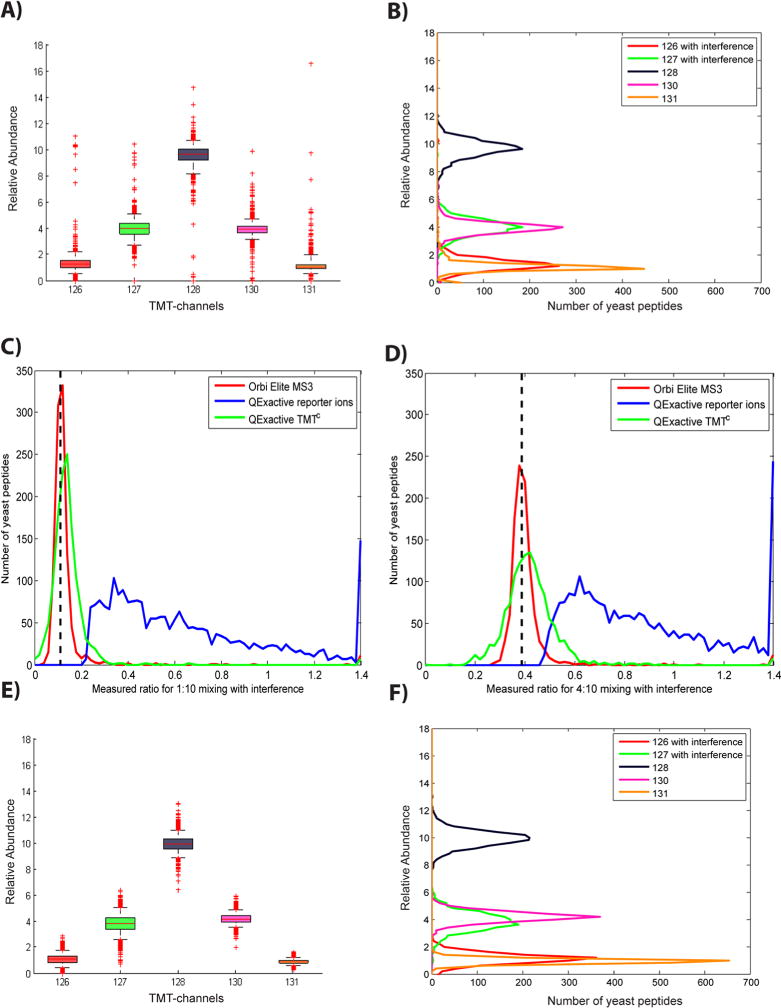
Large-scale evaluation of TMTC quantification. Panels A–D show yeast peptide ratios from the two-proteome human–yeast sample based on data acquired on a QExactive mass spectrometer. (A) Boxplot showing yeast peptide ratios determined using TMTC quantification (ratios are normalized to 20). Whiskers reach from the 5th to the 95th percentile. The median and numbers of outliers for channels with interference (126, 127) are very similar to equivalent channels without interference (130, 131). (B) Frequency distributions for ratios in panel A. Although interference does not seem to cause systematic errors, the ratio distribution for channels with interfering ions is wider than that for channels without interference. (C and D) Yeast peptides mixed in the ratios of 1:10 (TMT-126/TMT-128) and 4:10 (TMT-127/TMT-128), respectively, and subjected to interference by human peptides were quantified using TMT reporter ions (blue) or the TMTC approach (green). For evaluation, the same sample was also analyzed with an additional gas-phase isolation step (MS3) on an Orbitrap Elite (red). (E) Boxplot of Monte Carlo simulated yeast peptide ratios. The TMTC envelopes were simulated based on the known mixing ratios. As expected, the most striking difference to the actual experiment in panel A is the absence of extreme outliers. (F) Frequency distribution as in panel B of Monte Carlo simulated yeast peptide ratios. Although the extreme outliers are missing in the simulation the overall distribution is remarkably similar. As the simulation does not consider interfering peptides the wider distribution observed in the channels with interference is likely due to the increased overlap of the ion clusters with TMTC ions from other channels (see also Supporting Information Figure 4).
We also compared the performance of TMTC quantification with both the conventional MS2 reporter ion method and with the interference-free MS3 method. We quantified the yeast 1:10 and 4:10 ratios with interference (126/128 and 127/128) for TMTC and reporter ions on the QExactive (same experiment as described above) and compared it to the same sample analyzed on the Orbitrap Elite with the MS3 method and comparable elution gradient. The ratios obtained by the MS2 reporter ions were strongly distorted (Figure 3, parts C and D). By contrast, the TMTC derived medians for the 1:10 and 4:10 ratios with interference were centered close to the known mixing ratios with negligible distortion due to interference. The same was true for the ratios obtained with the MS3 method. While in this example we quantified ~30% more peptides with the TMTC approach compared to the MS3 method (Table 1); the ratio distribution is notably wider for TMTC, especially for the 4:10 ratio (Figure 3D).
Table 1.
Number Comparison of Five-Plex Interference Sample Quantified with the TMTC Approach or the MS3 Method
| QExactive TMTC | Orbi Elite TMTC | Orbi Elite MS3 | |
|---|---|---|---|
| acquired MS2 spectra | 22024 | 10173 | 8843 |
| acquired MS3 spectra | 7494 | ||
| identified peptidesa | 9390 | 4511 | 4063 |
| identified yeast peptides | 4029 | 2046 | 1879 |
| identified yeast peptides with sufficient ions for quantificationb | 1567 | 1039 | 1024 |
| filter for agreement bw predicted and observed TMTC clusterc | 1291 | 924 | 1024 |
1% false discovery rate on peptide level.
At least 1000 TMTC ions or at least 500 reporter ions for the MS3 method.
Applies only for TMTC quantification; minDiff < 0.005. (See Materials and Methods for detail.)
To evaluate the theoretical limit of the precision of the TMTC quantification, we simulated experimental sampling error for the number of ions observed in a Monte Carlo calculation, ignoring interference and other measurement errors. The resulting median absolute deviations of the simulated and measured ratios were remarkably similar (Supporting Information Figure 4, parts A and E). As expected, the simulated experiment was free of extreme outliers (Supporting Information Figure 4F). Interestingly, the boxplot and histograms of the simulated experiment showed a wider distribution of 126 and 127 channels compared to the 130 and 131 channels (Figure 3, parts E and F). We originally attributed this widening that we also observed in the actual experiment to interference. But the simulation is interference-free. We therefore conclude that the wider distribution in the lower TMT channels is likely due to the burying of the ions in the TMTC cluster (Figure 2F). As a result, measuring errors seem to accumulate and the precision of the measurement decreases. Overall, the simulated data were very similar to the real experiment, except for extreme outliers, suggesting a proximity to the theoretical limit of the present method.
Improving the Precision of the TMTC Method
We took advantage of the apparent agreement between actual experiment and Monte Carlo simulation (Figure 3, parts A, B, E, and F) and tested if the precision of the TMTC quantification could be improved by a larger mass separation between the TMT channels. To this end, we simulated 10:10:10:10:10 ratios based on amino acid sequences and numbers of ions observed in the experiment described in Figure 3, parts A and B. We then analyzed the simulated TMTC cluster by the same method we used for the actual experiments. Supporting Information Figure 5A shows a boxplot of the obtained ratios. The precision of the middle channels (127–130) is notably worse than the precision of the channels at the edges. When we removed the 128 channel the precision of all channels increases (Supporting Information Figure 5B). In contrast when removing only the 131 channel, there was less gain in precision (Supporting Information Figure 5C). This suggests that the improvement of precision is mostly due to the wider spacing of ions in the TMTC cluster rather than the higher number of ions per channel. A larger gain of precision could be achieved if each channel were separated by at least 2 Da (Supporting Information Figure 5D–H). We would like to note that the ion clusters which originate from the removal of multiple TMT reporter ions would have this desired property for a five-plex sample (data not shown). Unfortunately, for TMT-labeled peptides, these ion clusters form inefficiently.
Efficiency of TMTC Ion Formation
Table 1 summarizes the interference sample experiments run on the QExactive and Orbitrap Elite using the TMT and MS3 quantification methods. Each analysis employed comparable elution gradients of ~90 min. Notably, the number of acquired MS2 spectra and the number of identified peptides on the QExactive—with 120 ms injection time and 35k nominal resolution—is nearly double the number of MS2 spectra acquired when an equivalent TMTC experiment was run on the Orbitrap Elite with only slightly higher nominal resolution (42k resolution, 50k AGC target, 250 ms maximum injection time). While the different experimental setups prevent an exact comparison, we believe that the different duty cycles are mostly due to the parallelization of ion injection and spectrum acquisition on the QExactive. In contrast, ion injection and spectrum acquisition on the Orbitrap Elite are sequential.
One of the advantages of the TMTC approach, when compared to the MS3 method, is that no additional purification step is necessary to provide interference-free quantification and a larger fraction of the precursor ion is potentially converted into (complement) reporter ions. This could either reduce the injection time for quantification and/or increase the sensitivity. However, with the current implementation the number of peptides that can be quantified in a given time are similar to the numbers obtained with the MS3 method (Table 1).9a This is mostly due to the insufficient formation of significant numbers of TMTC ions for a large fraction of peptides. When we separate the identified yeast peptide ions by their charge state, we observe that, with 120 ms injection time, upon fragmentation, ~70% of doubly charged peptide ions create TMTC ions at an intensity that allows quantification (Figure 4A). This fraction decreases further for peptides with all charge states (Table 1). But it does not seem to be the charge state itself which results in lower efficiency of TMTC ion formation but a combination of charge state and amino acid composition. Likely peptide ions, which contain more charges than basic residues (arginine, lysine, histidine, and N-terminus), exhibit at least one proton which is highly mobile.11 When we separate peptide ions based on this criterion we found that peptides with highly mobile protons generally do not generate TMTC ions at sufficient intensity. We believe that a highly mobile proton leads to an increased fragmentation at the peptide backbone thereby suppressing the formation of the TMTC ions. It has to be noted that even when considering peptide ions that do not carry a high-mobility proton, we still observe that peptide ions of higher charge states tend to form TMTC ions less efficiently (Figure 4C).
Figure 4.
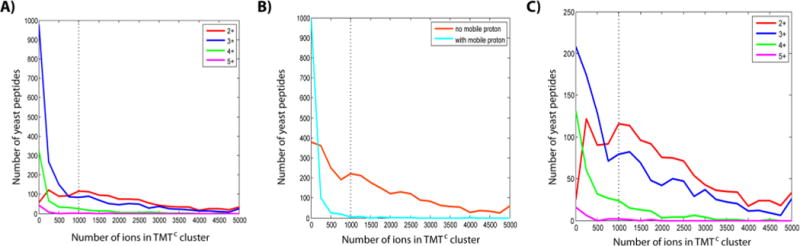
Amino acid sequence of peptides influences the TMTC ion cluster intensity. (A) Frequency distribution of the number of TMTC ions for different precursor charge states. A large fraction of higher charge state peptides does not produce significant amounts of TMTC ions. The dotted line represents a 1000 ion cutoff as used throughout this study to filter quantitative data. (B) The differences observed in panel A can be partially explained by comparing peptides with (light blue) and without (orange) protons of high mobility, irrespective of charge state. Peptides with high-mobility protons tend to yield insignificant numbers of TMTC ions. High-mobility protons likely support bond breakage at the peptide backbone and thereby suppress the formation of TMTC ions. (C) Frequency distributions of peptides not carrying a high-mobility proton for peptide ions of different charge states. The plot shows a negative correlation of peptide charge state and TMTC ion intensity. To some extent, this can be explained by the default MS instrument settings which prioritize precursors for MS2 spectra by the number of charges not ions. In addition, higher charge state peptides tend to be longer and might therefore be more likely to break at the peptide backbone, reducing the likelihood of TMTC ion formation.
The inefficient TMTC signal for a large fraction of peptides is the main limitation for TMTC quantification in its current implementation. While a significant problem, we believe there are viable solutions, with the chemistry of the isobaric tag as the most obvious target. The TMT tag was synthesized and optimized for the formation the low m/z reporter ions and not for TMTC ions. It should be possible to create a tag that forms the complement reporter ions more efficiently than the current TMT tag. For example, one could create a tag with a phosphoester bond. The neutral loss of the phospho group generally dominates the MS2 spectrum of phosphopeptides, especially with resonance collision-induced dissociation (CID) fragmentation.12 Furthermore, an additional basic group in the isobaric label might sequester high-mobility protons from the peptide backbone. More efficient formation of complement reporter ions should significantly increase the fraction of peptides amenable for quantification (Figure 4B) and should help the precision of the quantification for all peptides (Supporting Information Figure 5A).
TMTC Ion Cluster Facilitates Parallelization of Peptide Quantification
A unique advantage of the complement reporter ion approach over alternative quantification methods like MS3 or PTR is that the quantitative signal is entirely dependent on precursor characteristics. Inherently, this does not only lead to removal of interference but could allow the parallel quantification of coisolated peptides. In Figure 5, we provide a proof of principle for parallel quantification of multiple peptides in a single MS2 spectrum. By chance, we isolated two peptides for fragmentation during analysis of the human–yeast interference sample with ±3 m/z isolation width (Figure 5A). Searches of the two precursors with Sequest against a human–yeast peptide database including decoys identified the yeast peptide YTTLGK for the +2 precursor and the human peptide LDEREAGITEK for the +3 precursor. As expected, reporter ions were accrued from both the yeast and human origin (Figure 5B). In contrast the TMTC clusters were unique to each peptide, and from these precursor-specific fragment ions the two peptides were quantified independently. The human peptide was quantified at 10.5:9.3:0.1:0.0:0.0, and the yeast peptide was quantified at 1.5:4.6:9.6:2.1:1.1 (ratios normalized to 20). We believe that the quantification of the yeast peptide suffered from the localization of the peptide precursor close to the edge of the isolation window. (The pseudomonoisotopic peak of the human peptide was the target, selected by the instrument, for the MS2 spectrum.) Therefore, the peaks at the lower m/z side of the yeast isotopic envelope were less efficiently isolated, resulting in the overestimation of TMT-126 and TMT-127 channels. Even with this caveat, the quantifications for both peptides were reasonably close to the known, different mixing ratios, demonstrating that complement reporter ion quantification is uniquely applicable for methods where multiple precursors are intentionally isolated and fragmented like SWATH MS.13 Importantly, the wider isolation width does not seem to negatively affect the quantitation accuracy of the TMTC quantitation (Supporting Information Figure 6B). The data acquisition rate in multiplexed proteomic experiments is mostly limited by the ion injection time required for the accumulation of sufficient (complement) reporter ions in the MSn spectrum for quantification.9a In comparison to these ion injection times the total acquisition time of MS2 spectra for identification is short. The complement reporter ion approach allows parallelizing the ion injection for accumulation of complement reporter ions, thereby opening up the opportunity to multiply the number of peptides that could be quantified in a given time frame.
CONCLUSIONS
Here we show that the complement reporter ion cluster (TMTC) can be used for accurate quantification of isobaric labeled peptides at the MS2 level. In its current implementation approximately half the peptides did not form sufficient TMTC ions to allow successful quantification. Nevertheless, the method was still competitive with existing methods and the acquired quantitative data was found to be almost completely unaffected by interfering peptide ions. We show routes to improve the complement reporter ion generation efficiency, to allow higher precision quantification of a larger number of peptides. Finally, we demonstrated that the complement reporter ion approach can be used to quantify multiple distinct peptides in a single MS2 spectrum. This has the potential to substantially increase the acquisition speed in multiplexed proteomics.
Materials and Methods
Sample preparation and data-acquisition
Unless otherwise noted, interference samples were prepared as previously described1. HeLa S3 cells were grown in suspension to 1×10⁶ cells/mL. Yeast cells were grown to an OD of 1.0. Cells were lysed in 6 M guanidinium thiocyanate, 50 mM Hepes pH 8.5 (HCl). Protein content was measured using a BCA assay (Thermo Scientific), disulfide bonds were reduced with dithiothreitol (DTT), and cysteine residues alkylated with iodoacetamide as previously described 2. Protein lysates were cleaned up by methanolchloroform precipitation3. The samples were taken up in in 6 M guanidium thiocyanate, 50 mM Hepes pH 8.5, and diluted to 1.5 M guanidium thiocyanate, 50 mM Hepes, pH 8.5. Both lysates were digested over night with Lys-C (Wako) in a 1: 50 enzyme: protein ratio digest. Following digestion, the sample was acidified with tri-fluoric-acid to a pH < 2, and subjected to C18 solid-phase extraction (SPE) (Sep-Pak, Waters). Amino reactive TMT reagents (126 to 131, Thermo Scientific, Lot # MJ164415, 0.8 mg) were dissolved in 40 εl acetonitrile, and 10 εl of the solution was added to 100 εg of peptides dissolved in 100 εl of 50 mM HEPES (pH 8.5). After 1 h at room temperature (22 °C), the reaction was quenched by adding 8 εl of 5% hydroxylamine. Following labeling, the sample was combined in desired ratios (e.g., 1:4:10:4:1). A fraction of the labeled yeast sample was kept separately from the labeled human sample, and that sample was prepared for interference free analysis. Samples were subjected to C18 solid-phase extraction (SPE) (Sep-Pak, Waters).
LC-MS experiments were performed on an Orbitrap Elite or QEactive MS (Thermo Fischer Scientific). The Orbitrap Elite was equipped with a Famos autosampler (LC Packings) and an Agilent 1100 binary high-pressure liquid chromatography (HPLC) pump (Agilent Technologies). For each run ~1εg of peptides were separated on a 100 or 75 εm inner diameter microcapillary column packed first with approximately 0.5 cm of Magic C4 resin (5 εm, 200 Å, Michrom Bioresources) followed by 20 cm of Maccel C18 AQ resin (3 εm, 200 Å, Nest Group). Separation was achieved by applying a 9–32% acetonitrile gradient in 0.125% formic acid over 90 min at ~ 300 nl/min. Electrospray ionization was enabled through applying a voltage of 1.8 kV through a PEEK micro-tee at the inlet of the microcapillary column. The Orbitrap Elite was operated in data-dependent mode. The survey scan was performed in the Orbitrap over the range of 300–1,500 m/z at a resolution of 84 k, followed by the selection of the ten most intense ions (top 10) for HCD-MS2 fragmentation using a precursor isolation width window of ±2 m/z followed by MS2 with a resolution of a resolution of 42 k. The automatic gain control (AGC) settings were 3 × 10⁶ ions and 5 × 10⁵ ions for survey and MS2 scans, respectively. Ions were selected for MS2 when their intensity reached a threshold of 500 counts and an isotopic envelope was assigned. Maximum ion accumulation times were set to 1,000 ms for survey MS scans and to 250 ms for MS2 scans. The normalized collision energy for HCD-MS2 experiments was set to 32% at a 30-ms activation time. Singly-charged and ions for which a charge state could not be determined were not subjected to MS2. Ions within a ±10 ppm m/z window around ions selected for MS2 were excluded from further analysis for 120 s.
The QExactive was equipped with easy-nLC 1000 UHPLC pump. For each run ~1εg of peptides were separated on a 75 εm inner diameter microcapillary column packed first with approximately 0.5 cm of Magic C4 resin (5 εm, 200 Å, Michrom Bioresources) followed by 25 cm of GP-C18 resin (1.8 εm, 120 Å, Sepax Technoligies). Separation was achieved by applying a 9–32% acetonitrile gradient in 0.125% formic acid over 90 min at ~400 nL/min. Electrospray ionization was enabled through applying a voltage of 1.8 kV through a PEEK junction at the inlet of the micro capillary column. The QExative was operated in data-dependent mode. The survey scan was performed at a resolution setting of 70 k, followed by the selection of the ten most intense ions (top 10) for HCD-MS2 fragmentation. The normalized collision energy for HCD-MS2 experiments was set to 30%. Singly-charged and ions for which a charge state could not be determined were not subjected to MS2. Ions for MS2 were excluded from further selection for fragmentation for 40 s. For a test of different parameters for TMTC quantification on a QExactive see supplementary figure 6. We optimized the collision energy settings and we obtain the best numbers with the configurations used throughout this study (data not shown). Raw data are available upon request through our high-speed transfer server.
Data analysis
A suite of in-house-developed software tools was used to convert mass spectrometric data from the RAW file to the mzXML format, as well as to correct erroneous assignments of peptide ion charge state and monoisotopic m/z4. We modified the ReAdW.exe to include signal to noise ratios (S/N) for each peak during conversion to the mzXML file format (http://sashimi.svn.sourceforge.net/viewvc/sashimi/). Assignment of MS2 spectra was performed using the Sequest algorithm5 by searching the data against a protein sequence database including all entries from the human International Protein Index database (version 3.6) followed by sequences of proteins encoded by all known S. cerevisiae ORFs, and known contaminants such as human keratines. This forward (target) database component was followed by a decoy component including all listed protein sequences in reversed order. Protein sequences from the human database were listed before those from yeast so that a peptide included in both databases was always assigned to a human protein and did not intervene with measuring the interference effect. Searches were performed using a 20 ppm precursor ion tolerance, where both peptide termini were required to be consistent with Lys-C specificity, while allowing up to two missed cleavages. TMT tags on lysine residues and peptide N termini (+ 229.162932 Da) and carbamidomethylation of cysteine residues (+57.02146 Da) were set as static modifications, oxidation of methionine residues (+ 15.99492 Da) as a variable modification. An MS2 spectral assignment false discovery rate of less than 1% was achieved by applying the target-decoy database search strategy6. Filtering was performed using a linear discrimination analysis method to create one combined filter parameter from the following peptide ion and MS2 spectra properties: Sequest parameters XCorr and ΔCn, absolute peptide ion mass accuracy and charge state. Forward peptides within 3 standard deviation of the theoretical m/z of the precursor were used as positive training set. All reverse peptides were used as negative training set. Linear discrimination scores were used to sort peptides with at least 6 residues and to filter with a cutoff of 1% false discovery rate based on the decoy database4.
Each search was software-recalibrated to alleviate any systematic mass error dependent on peptide elution time or observed m/z. All ions in the full MS1 spectra were first adjusted. A representative subset of peptides was selected using those above the median XCorr and within one standard deviation of the global mass error. The mass errors of this subset were then fit to each parameter using LOESS regression. The m/z of every ion in MS1 spectra was then adjusted by the error predicted by interpolating the values of the nearest data points in the regression model. Adjustments for each of the two parameters were done iteratively. MS2 spectra were then calibrated in a similar manner. Mass errors were calculated from matched peptide fragment ions within two standard deviations of the global mass error and above the upper quartile of intensity. Mass errors were fitted to each parameter using LOESS regression and the m/z for every ion in MS2 spectra was adjusted as above.
For quantification via the reporter ions the intensity of the signal closest to the theoretical m/z, within a ±20 ppm window, was recorded. Reporter ion intensities were adjusted based on the overlap of isotopic envelopes of all reporter ions as recommended by the manufacturer.
The peak that resulted from the monoisotopic-precursor labeled with the most abundant peak of TMT-131, after fractionation, was defined as Position 0. Peak intensity (S/N) from Position −1 to +10 were extracted for quantification. The peak closest to the predicted mass was chosen within a ± 20 ppm. window. We calculated the theoretical mass difference from the pseudo monoisotopic mass minus or plus the mass-difference between C13 and C12 (1.00336 Da).
For figure 5 the dta file was manually edited to represent two peptides based on charge state and m/z values of the surviving precursor in the MS2 spectrum. This dta file was searched against the yeast human-peptide database (including decoy) with 5 ppm window.
Deconvolution of TMTC ion cluster with theoretical precursor envelope
To measure the TMT isotopic impurities of the TMT-reagents we combined each amino-reactive-TMT separately with ammonium carbonate and measured the isotopic envelope from the resulting TMT-NH2 in the MS1 (We neglected the NH2 isotopic envelope, which is ~ 0.4% for the +1 peak when the entire envelop is normalized to 1). We observed an isotopic envelope made up of three peaks at ~246, 247 and 248 m/z with abundance of > 1% when the entire envelope is normalized to 1. From these isotopic envelopes we selected each peak individually, fragmented it with HCD, and measured the resulting reporter ions (~126 Da to ~132 Da). From these spectra, we derive six TMT-impurity matrices I126… I131, which are graphically represented in supplementary figure 2. Each entry reports the relative abundance of isotopes and their fragmentation pattern (the matrices are normalized to 1). The columns define the position in the TMT-NH2 precursor isotopic envelope (~246, 247, 248 Da left to right) while rows from top to bottom corresponds to the delta mass (Δ m) which is the mass difference between this precursor ion and its resulting TMTC ion after fragmentation (~154 Da to ~159 Da, top to bottom). The six different delta masses arise from 5 different TMT channels (126 to 131, without 129 as we cannot distinguish the delta mass of 129 and 130; Suppl. Fig. 1) and an additional ion at ~132 Da, which is the result of an isotopic impurity in the 131-TMT tag.
For each of the TMT channels we can also define the vector of isotopic impurities t126…t131 by summing the rows of the respective matrices I126…I131. That is, the isotopic impurity vector t126 = [0.032 0.889 0.079] where the numbers represent the relative abundance, regardless of fragmentation pattern, of the TMT-NH2 ions with ~246, 247 and 248 Da respectively.
The vector p represents the relative population of the isotopic envelope for a given non-TMT-labeled peptide. This vector can be calculated from the amino acid composition based on the natural abundance of isotopes 7. The first position in this vector p(0) is the position of the monoisotopic peak. The following positions are the peaks which are one mass unit (~1.003 Da) heavier. The values in p are normalized to 1.
The number of TMT-tags (k) bound to a peptide is the number of lysine-residues +1 (N-terminus). From I, t, k and p we can calculate the precursor matrix PTMT (See also Suppl. Fig. 3).
In these matrices PTMT the rows indicate the delta mass after fragmentation as described for ITMT and the columns indicate the position in the isotopic envelope. We calculate columns p(−1) to p(10), with the pseudo-monoisotopic peak defining position p(0).
For given mixing ratios rTMT (expressed as r126: r127: r128: r130: r131, normalized to 1) we can calculate the distribution of delta masses throughout the isotopic precursor envelope encoded in the Precursor -Matrix PM, which is calculated as a weighted sum of the P126…P131 matrices:
From this matrix PM we can calculate the relative abundance of ions in the theoretical TMTC ion cluster which we represent with the vector ĉ. The position ĉ(0) is defined as the position which results from loss of the TMT-131 reporter ion of the pseudo moniosotopic peak p(0). We calculate ĉ for positions −1 to 14.
This is equivalent of summing up the diagonals of PM.
Next we compare theoretically calculated vector ĉ for the TMTC ion cluster with the observed ion cluster c. To avoid fitting noise of empty positions we first calculate which positions in the theoretically predicted TMTC envelope ĉ are populated with less than 1% of the total ion cluster for the theoretical ratios r̂TMT = 0.2: 0.2: 0.2: 0.2: 0.2. For typical peptides this requirement is fulfilled for the pseudo-monoistopic position ĉ(0) to ĉ(+6) to ĉ(+8). We than vary the ratio in rTMT and minimize Diff8.
minr̂ Diff(c, ĉ(r̂) = minr̂ Σi(ĉi(r̂) − ci)2 for all i where ĉi (r̂TMT=0.2:0.2:0.2:0.2:0.2) > 0.01 with Σi ĉi = 1 and Σi ci = 1
Searching for the mixing proportions which minimize the ion envelop similarity function is a standard multi-variate optimization problem. Diff is defined as quadratic similarity function. We therefore obtain an instance of convex optimization and can solve the optimization problem with a simple local search solver as implemented by the fmincon function in MATLAB.
To filter for well quantified peptides we require at least ~1000 ions in the TMTC envelope and a min Diff value of <0.005. For the purposes of this paper, we focus on individually solving this for each peptide, while an obvious extension of this method would be to solve jointly for all peptides of a given protein.
The MS3 method was performed as previously described1, on an Orbitrap Elite. For successful quantification, we required at least 500 reporter ions, which has become the standard used in our lab.
Estimation of number of ions in peak
For spectra acquired in an Orbitrap we assume that the number of ions in a peak is proportional to signal-to-noise over charges. We estimate the number of molecules in a given fragment ion peak using the assumption that the noiseband is approximately equal to 5 charges when the transient is 30 ms long and collected on a D20 Orbitrap. This number was estimated based on a comparison of charges in the orbitrap with the ion-trap on the Orbitrap Elite. This correlates well with previous published results9. The D20 Orbitrap in the Elite aquires the same signal-to-noise for a given number of same ions in half the time when compared to the D30 Orbitrap in the QExactive10. For differing resolutions (longer acquisition times) noise decreases with the square root of acquisition time9 while signal stays approximately constant. As a result we assume that the noiseband of a MS2-spectrum on the QExactive is equivalent to charges (e) as follows: 5 e at 18k nominal resolution, 3.5 e at 35k, and 2.5 e at 70k. Analogously, the noiseband for the Orbitrap Elite is estimated to be 5 e at 21k, and 3.5 e at 42k (All nominal resolution are expressed for 200 m/z).
Supplementary Material
Suppl. Fig. 1: Formation of TMT reporter ions and TMTC ion cluster. A) Fragmentation of a six-plex TMT-labeled peptide. Asterisks indicate sites of heavy isotopes (13C or 15N). TMT reporter ions and TMTC ions are formed through bond cleavage at the indicated positions. The m/z of both reporter ions and TMTC ions are channel specific. However, the MS2 mass resolution setting used in this study was not sufficient to resolve TMTC-129 and TMTC-130 ions and the TMT-129 channel was therefore not used. B) Peptide quantification is rather uncomplicated using the low m/z TMT reporter ions, but challenging for the TMTC ion cluster which results from the overlap of the high m/z TMTC ion envelopes of each individual TMT channel. Peptides are quantified by deconvolving the TMTC cluster using our knowledge of the theoretical ion intensity distribution of the isotopic envelope of the precursor peptide.
Suppl. Fig. 2: Determining the exact isotopic composition of TMT tags. The six different amino reactive TMT-tags were reacted with ammonium bicarbonate. The intensity distributions of the resulting NH2-TMT isotopic envelopes were individually measured on an Orbitrap Elite mass spectrometer. The m/z of the pseudo-monoisotopic is set to 247. Next each individual precursor peak was fragmented in an individual MS2 experiment, and its contribution to the intensity of each individual reporter ion was determined. These measurements allowed us to infer the generation of the TMTC ions (color coded). The six listed mass decrement values arise from the use of 5 different TMT reagents [126, 127, 128, 130, and 131 (Suppl. Fig. 1)] and the consideration of an additional ion at 132 m/z resulting from an isotopic impurity in the TMT-131 reagent.
Suppl. Fig. 3: TMTC ion cluster-based quantification using the example of the yeast peptide AIELFTK from the human-yeast interference sample (see also Fig. 2). A) Predicted relative intensity distribution in the isotopic envelope for the unlabeled peptide. The monoisotopic peak is positioned at p(0). B) The isotopic envelope and the intensity distribution for mass decrement ions are calculated for a peptide with two TMT-tags (one at the N-terminus, one at the lysine-residue) for an arbitrarily chosen mixing ratio of 1:1:1:1:1. The mass decrements indicate the mass difference between the m/z value of an ion in the isotopic envelope of the precursor ion and its m/z value in the TMTC cluster. By approximation, a mass decrement of 154 Da is equivalent to TMT-126, a decrement of 155 Da is equivalent to TMT-127, and so forth (a detailed annotation of mass decrements to TMT-channels is given in Suppl. Fig. 2 and in matrix form in Materials and Methods). Due to the distribution of isotopic impurities in the TMT-tag, the relative abundance of the different mass-decrements throughout the precursor envelope are not constant (e.g. the p(−1) position is nearly free of the 158 Dalton decrement) C) We are able to calculate the intensity distribution of the theoretical TMTC envelope based on the distribution of mass decrements in the precursor ion cluster. The predicted intensity distribution in the TMTC ion cluster is compared with the observed values (grey). D, E, F) According to A–C, the predicted contributions of each TMT channel are optimized so that the summed square difference between observed and predicted TMTC cluster intensity is minimal. For the shown example the optimized predicted ratios for the TMT channels 126:127:128:130:131 are 1.0:3.5:10:4.4:1.0.
Suppl. Figure 4: Filtering of TMTC-based quantitative data. A) Relative yeast peptide TMT channel intensities were calculated by de-convolving the TMTC ion cluster. The graphs show the median absolute deviation of the measured ratios from the expected 1:10 and 1:4 ratios plotted against the number of ions in the TMTC envelope. Measurements were taken in absence and under the influence of interference by human peptides. We decided to use a cutoff of 1000 ions as a minimum requirement for confident quantification. B) As a second filter criterion we used the summed square difference (Diff) between predicted and observed TMTC ion cluster. We defined peptides with a cosine distance of less than 0.02 between measured and predicted TMT channel ratios as well quantified peptides. The graph shows well-quantified peptides (blue) and other peptides (red) for their sum of ions in TMTC cluster and the sum of squared difference between observed and calculated TMTC cluster. The dotted black lines indicate the filtering thresholds used throughout this study. C) Predicted and observed TMTC isotopic cluster for a peptide which did not meet the filter criteria (Diff = 0.0017). D) An example where predicted and observed TMTC isotopic cluster agree well (Diff = 0.0002). E) Similar to the graph shown in A, this plot shows data for Monte Carlo simulated yeast peptides with known mixing ratios based on amino-acid sequence and number of ions observed in experiment described in A,B. Data from the simulated and actual experiment are very similar. F) Data from a Monte Carlo simulated experiment plotted as described in B. The distribution of most data-points is very similar between simulated and actual experiment. However, the actual experiment produced more outliers, which are likely due to occasional interference of the measured TMTC envelope through contaminating ions.
Suppl. Fig. 5: Evaluation of the influence of channel number and inter-channel mass spacing on precision of TMTC-based peptide quantification. A simulation of an experiment with TMT channels mixed in equal amounts was performed based on the amino-acid-sequences and number of ions observed in the experiment shown in figure 3A, B. Panels A–G depicts boxplots from these experiments with the sum of the ratios normalized to the number of channels multiplied by 10. Only data from TMTC ion clusters with at least 1000 ions were considered. Whiskers reach from the 5 to 95 percentile. A) Simulation for the use of all five-plex TMT as applied throughout this study. B) Removing the 128 channel notably increases the precision of the quantitative data. C) Data for using 4 channels without inter-channel mass-spacing. Almost no increase of quantitative precision is shown in comparions to the data from using all five channels as presented in B. D, E) Simulated 3-plex experiment with (D) and in the absence (E) of mass- spacing between channels. As expected, the precision is substantially higher in E as the deconvolution of the TMTC cluster is less complicated. F, G) Comparison of duplex sample with and without mass-spacing. H) Values for the median absolute deviation are plotted versus the total number of ions in TMTC cluster for experiments with varying numbers of channels and with and without massspacing between the channels (corresponding to the experiments shown in A–G). For each experiment the channel with the poorest precision was selected for the plot (bold in legend). While the precision improves with increasing number of ions for all experiments, approximately ten-times more ions are required for the 5-plex sample to obtain a precision similar to that achieved in the experiment using 3 channels separated by 2 Da mass-spacing.
Suppl. Fig 6: Method optimization for TMTC-based quantification using the QExactive. A) Comparison of different MS2 resolution settings: for 18 k, 35 k, and 70 k; nominal at 200 m/z. Maximum ion injection times were set in accordance with Orbitrap scan times at different resolution settings: 60 ms, 120 ms, and 240 ms, respectively. Vertical lines indicate the known mixing ratios of 1:10 (dotted) and 4:10 (solid). Even at a resolution setting of 18 k systematic error due to interference seems minor. However, the comparatively short ion injection time associated with the 18 k resolution setting – and, consequently, the low number of accumulated ions - led to an increase of TMTC ion clusters that did not fulfill the data filtering criteria described in Suppl. Fig. 4. At 35 k resolution most peptides passed the filtering criteria;a narrower ratio distribution show that the used settings increased the precision of the acquired quantitative data. B) Comparison of different isolation width settings and the effect on TMTC ion-based quantification at 35 k resolution. An incomplete isolation of the precursor ion envelope when applying an isolation width of ±1.5 m/z (pink) strongly affected the accuracy of the quantitative results. This problem was solved by extending the isolation width to ±2 m/z. A further extension of the isolation width to ±2.5 and ±3 m/z, respectively, did not significantly improve the accuracy of quantification but decreased the number of identified peptides. We believe that the latter can be attributed to the increased co-isolation of contaminating peptide ions. C) Numbers of MS2 spectra, identified, and quantified peptides from experiments shown in A and B.
Acknowledgments
We thank Lily Ting, Julian Mintseris, and Mike Springer for valuable advice and suggestions. This work was supported by NIH Grants GM026875 to M.W.K. and HG3456 and GM67945 to S.P.G.
Footnotes
Additional information as noted in text. This material is available free of charge via the Internet at http://pubs.acs.org.
Notes
The authors declare no competing financial interest.
References
- 1.(a) Nagaraj N, Wisniewski JR, Geiger T, Cox J, Kircher M, Kelso J, Paabo S, Mann M. Mol Syst Biol. 2011;7:548. doi: 10.1038/msb.2011.81. [DOI] [PMC free article] [PubMed] [Google Scholar]; (b) Beck M, Schmidt A, Malmstroem J, Claassen M, Ori A, Szymborska A, Herzog F, Rinner O, Ellenberg J, Aebersold R. Mol Syst Biol. 2011;7:549. doi: 10.1038/msb.2011.82. [DOI] [PMC free article] [PubMed] [Google Scholar]; (c) Huttlin EL, Jedrychowski MP, Elias JE, Goswami T, Rad R, Beausoleil SA, Villen J, Haas W, Sowa ME, Gygi SP. Cell. 2010;143:1174–1189. doi: 10.1016/j.cell.2010.12.001. [DOI] [PMC free article] [PubMed] [Google Scholar]
- 2.Matthiesen R, Carvalho AS. Methods Mol Biol. 2010;593:187–204. doi: 10.1007/978-1-60327-194-3_10. [DOI] [PubMed] [Google Scholar]
- 3.(a) Conrads TP, Alving K, Veenstra TD, Belov ME, Anderson GA, Anderson DJ, Lipton MS, Pasa-Tolic L, Udseth HR, Chrisler WB, Thrall BD, Smith RD. Anal Chem. 2001;73:2132–2139. doi: 10.1021/ac001487x. [DOI] [PubMed] [Google Scholar]; (b) Ong SE, Blagoev B, Kratchmarova I, Kristensen DB, Steen H, Pandey A, Mann M. Mol Cell Proteomics. 2002;1:376–386. doi: 10.1074/mcp.m200025-mcp200. [DOI] [PubMed] [Google Scholar]
- 4.(a) Tolonen AC, Haas W, Chilaka AC, Aach J, Gygi SP, Church GM. Mol Syst Biol. 2011;7:461. doi: 10.1038/msb.2010.116. [DOI] [PMC free article] [PubMed] [Google Scholar]; (b) Gygi SP, Rist B, Gerber SA, Turecek F, Gelb MH, Aebersold R. Nat Biotechnol. 1999;17:994–999. doi: 10.1038/13690. [DOI] [PubMed] [Google Scholar]
- 5.Mertins P, Udeshi ND, Clauser KR, Mani DR, Patel J, Ong SE, Jaffe JD, Carr SA. Mol Cell Proteomics. 2011;11:M111.014423. doi: 10.1074/mcp.M111.014423. [DOI] [PMC free article] [PubMed] [Google Scholar]
- 6.(a) Deeb SJ, D’Souza RC, Cox J, Schmidt-Supprian M, Mann M. Mol Cell Proteomics. 2012;11:77–89. doi: 10.1074/mcp.M111.015362. [DOI] [PMC free article] [PubMed] [Google Scholar]; (b) Olsen JV, Vermeulen M, Santamaria A, Kumar C, Miller ML, Jensen LJ, Gnad F, Cox J, Jensen TS, Nigg EA, Brunak S, Mann M. Sci Signaling. 2010;3:ra3. doi: 10.1126/scisignal.2000475. [DOI] [PubMed] [Google Scholar]
- 7.Ow SY, Cardona T, Taton A, Magnuson A, Lindblad P, Stensjo K, Wright PC. J Proteome Res. 2008;7:1615–1628. doi: 10.1021/pr700604v. [DOI] [PubMed] [Google Scholar]
- 8.Dephoure N, Gygi SP. Sci Signaling. 2012;5:rs2. doi: 10.1126/scisignal.2002548. [DOI] [PMC free article] [PubMed] [Google Scholar]
- 9.(a) Ting L, Rad R, Gygi SP, Haas W. Nat Methods. 2011;8:937–940. doi: 10.1038/nmeth.1714. [DOI] [PMC free article] [PubMed] [Google Scholar]; (b) Wenger CD, Lee MV, Hebert AS, McAlister GC, Phanstiel DH, Westphall MS, Coon JJ. Nat Methods. 2011;8:933–935. doi: 10.1038/nmeth.1716. [DOI] [PMC free article] [PubMed] [Google Scholar]; (c) Ow SY, Salim M, Noirel J, Evans C, Rehman I, Wright PC. J Proteome Res. 2009;8:5347–5355. doi: 10.1021/pr900634c. [DOI] [PubMed] [Google Scholar]
- 10.Pichler P, Kocher T, Holzmann J, Mazanek M, Taus T, Ammerer G, Mechtler K. Anal Chem. 2010;82:6549–6558. doi: 10.1021/ac100890k. [DOI] [PMC free article] [PubMed] [Google Scholar]
- 11.Wysocki VH, Tsaprailis G, Smith LL, Breci LA. J Mass Spectrom. 2000;35:1399–1406. doi: 10.1002/1096-9888(200012)35:12<1399::AID-JMS86>3.0.CO;2-R. [DOI] [PubMed] [Google Scholar]
- 12.Beausoleil SA, Jedrychowski M, Schwartz D, Elias JE, Villen J, Li J, Cohn MA, Cantley LC, Gygi SP. Proc Natl Acad Sci USA. 2004;101:12130–12135. doi: 10.1073/pnas.0404720101. [DOI] [PMC free article] [PubMed] [Google Scholar]
- 13.Gillet LC, Navarro P, Tate S, Roest H, Selevsek N, Reiter L, Bonner R, Aebersold R. Mol Cell Proteomics. 2012;11:O111.016717. doi: 10.1074/mcp.O111.016717. [DOI] [PMC free article] [PubMed] [Google Scholar]
Associated Data
This section collects any data citations, data availability statements, or supplementary materials included in this article.
Supplementary Materials
Suppl. Fig. 1: Formation of TMT reporter ions and TMTC ion cluster. A) Fragmentation of a six-plex TMT-labeled peptide. Asterisks indicate sites of heavy isotopes (13C or 15N). TMT reporter ions and TMTC ions are formed through bond cleavage at the indicated positions. The m/z of both reporter ions and TMTC ions are channel specific. However, the MS2 mass resolution setting used in this study was not sufficient to resolve TMTC-129 and TMTC-130 ions and the TMT-129 channel was therefore not used. B) Peptide quantification is rather uncomplicated using the low m/z TMT reporter ions, but challenging for the TMTC ion cluster which results from the overlap of the high m/z TMTC ion envelopes of each individual TMT channel. Peptides are quantified by deconvolving the TMTC cluster using our knowledge of the theoretical ion intensity distribution of the isotopic envelope of the precursor peptide.
Suppl. Fig. 2: Determining the exact isotopic composition of TMT tags. The six different amino reactive TMT-tags were reacted with ammonium bicarbonate. The intensity distributions of the resulting NH2-TMT isotopic envelopes were individually measured on an Orbitrap Elite mass spectrometer. The m/z of the pseudo-monoisotopic is set to 247. Next each individual precursor peak was fragmented in an individual MS2 experiment, and its contribution to the intensity of each individual reporter ion was determined. These measurements allowed us to infer the generation of the TMTC ions (color coded). The six listed mass decrement values arise from the use of 5 different TMT reagents [126, 127, 128, 130, and 131 (Suppl. Fig. 1)] and the consideration of an additional ion at 132 m/z resulting from an isotopic impurity in the TMT-131 reagent.
Suppl. Fig. 3: TMTC ion cluster-based quantification using the example of the yeast peptide AIELFTK from the human-yeast interference sample (see also Fig. 2). A) Predicted relative intensity distribution in the isotopic envelope for the unlabeled peptide. The monoisotopic peak is positioned at p(0). B) The isotopic envelope and the intensity distribution for mass decrement ions are calculated for a peptide with two TMT-tags (one at the N-terminus, one at the lysine-residue) for an arbitrarily chosen mixing ratio of 1:1:1:1:1. The mass decrements indicate the mass difference between the m/z value of an ion in the isotopic envelope of the precursor ion and its m/z value in the TMTC cluster. By approximation, a mass decrement of 154 Da is equivalent to TMT-126, a decrement of 155 Da is equivalent to TMT-127, and so forth (a detailed annotation of mass decrements to TMT-channels is given in Suppl. Fig. 2 and in matrix form in Materials and Methods). Due to the distribution of isotopic impurities in the TMT-tag, the relative abundance of the different mass-decrements throughout the precursor envelope are not constant (e.g. the p(−1) position is nearly free of the 158 Dalton decrement) C) We are able to calculate the intensity distribution of the theoretical TMTC envelope based on the distribution of mass decrements in the precursor ion cluster. The predicted intensity distribution in the TMTC ion cluster is compared with the observed values (grey). D, E, F) According to A–C, the predicted contributions of each TMT channel are optimized so that the summed square difference between observed and predicted TMTC cluster intensity is minimal. For the shown example the optimized predicted ratios for the TMT channels 126:127:128:130:131 are 1.0:3.5:10:4.4:1.0.
Suppl. Figure 4: Filtering of TMTC-based quantitative data. A) Relative yeast peptide TMT channel intensities were calculated by de-convolving the TMTC ion cluster. The graphs show the median absolute deviation of the measured ratios from the expected 1:10 and 1:4 ratios plotted against the number of ions in the TMTC envelope. Measurements were taken in absence and under the influence of interference by human peptides. We decided to use a cutoff of 1000 ions as a minimum requirement for confident quantification. B) As a second filter criterion we used the summed square difference (Diff) between predicted and observed TMTC ion cluster. We defined peptides with a cosine distance of less than 0.02 between measured and predicted TMT channel ratios as well quantified peptides. The graph shows well-quantified peptides (blue) and other peptides (red) for their sum of ions in TMTC cluster and the sum of squared difference between observed and calculated TMTC cluster. The dotted black lines indicate the filtering thresholds used throughout this study. C) Predicted and observed TMTC isotopic cluster for a peptide which did not meet the filter criteria (Diff = 0.0017). D) An example where predicted and observed TMTC isotopic cluster agree well (Diff = 0.0002). E) Similar to the graph shown in A, this plot shows data for Monte Carlo simulated yeast peptides with known mixing ratios based on amino-acid sequence and number of ions observed in experiment described in A,B. Data from the simulated and actual experiment are very similar. F) Data from a Monte Carlo simulated experiment plotted as described in B. The distribution of most data-points is very similar between simulated and actual experiment. However, the actual experiment produced more outliers, which are likely due to occasional interference of the measured TMTC envelope through contaminating ions.
Suppl. Fig. 5: Evaluation of the influence of channel number and inter-channel mass spacing on precision of TMTC-based peptide quantification. A simulation of an experiment with TMT channels mixed in equal amounts was performed based on the amino-acid-sequences and number of ions observed in the experiment shown in figure 3A, B. Panels A–G depicts boxplots from these experiments with the sum of the ratios normalized to the number of channels multiplied by 10. Only data from TMTC ion clusters with at least 1000 ions were considered. Whiskers reach from the 5 to 95 percentile. A) Simulation for the use of all five-plex TMT as applied throughout this study. B) Removing the 128 channel notably increases the precision of the quantitative data. C) Data for using 4 channels without inter-channel mass-spacing. Almost no increase of quantitative precision is shown in comparions to the data from using all five channels as presented in B. D, E) Simulated 3-plex experiment with (D) and in the absence (E) of mass- spacing between channels. As expected, the precision is substantially higher in E as the deconvolution of the TMTC cluster is less complicated. F, G) Comparison of duplex sample with and without mass-spacing. H) Values for the median absolute deviation are plotted versus the total number of ions in TMTC cluster for experiments with varying numbers of channels and with and without massspacing between the channels (corresponding to the experiments shown in A–G). For each experiment the channel with the poorest precision was selected for the plot (bold in legend). While the precision improves with increasing number of ions for all experiments, approximately ten-times more ions are required for the 5-plex sample to obtain a precision similar to that achieved in the experiment using 3 channels separated by 2 Da mass-spacing.
Suppl. Fig 6: Method optimization for TMTC-based quantification using the QExactive. A) Comparison of different MS2 resolution settings: for 18 k, 35 k, and 70 k; nominal at 200 m/z. Maximum ion injection times were set in accordance with Orbitrap scan times at different resolution settings: 60 ms, 120 ms, and 240 ms, respectively. Vertical lines indicate the known mixing ratios of 1:10 (dotted) and 4:10 (solid). Even at a resolution setting of 18 k systematic error due to interference seems minor. However, the comparatively short ion injection time associated with the 18 k resolution setting – and, consequently, the low number of accumulated ions - led to an increase of TMTC ion clusters that did not fulfill the data filtering criteria described in Suppl. Fig. 4. At 35 k resolution most peptides passed the filtering criteria;a narrower ratio distribution show that the used settings increased the precision of the acquired quantitative data. B) Comparison of different isolation width settings and the effect on TMTC ion-based quantification at 35 k resolution. An incomplete isolation of the precursor ion envelope when applying an isolation width of ±1.5 m/z (pink) strongly affected the accuracy of the quantitative results. This problem was solved by extending the isolation width to ±2 m/z. A further extension of the isolation width to ±2.5 and ±3 m/z, respectively, did not significantly improve the accuracy of quantification but decreased the number of identified peptides. We believe that the latter can be attributed to the increased co-isolation of contaminating peptide ions. C) Numbers of MS2 spectra, identified, and quantified peptides from experiments shown in A and B.