

Abstract
Protein kinases play critical roles in many biological and pathological processes, making them important targets for therapeutic drugs. Here, we desired to increase the throughput for kinome-wide profiling. A new workflow coupling ActivX ATP probe (AAP) affinity reagents with isotopic labeling to quantify the relative levels and modification states of kinases in cell lysates is described. We compared the new workflow to a classical proteomics approach in which fractionation was used to identify low-abundance kinases. We find that AAPs enriched approximately 90 kinases in a single analysis involving six cell lines or states in a single run, an 8-fold improvement in throughput relative to the classical approach. In general, AAPs cross-linked to both the active and inactive states of kinases but performing phosphopeptide enrichment made it possible to measure the phospho sites of regulatory residues lying in the kinase activation loops, providing information on activation state. When we compared the kinome across the six cell lines, representative of different breast cancer clinical subtypes, we observed that many kinases, particularly receptor tyrosine kinases, varied widely in abundance, perhaps explaining the differential sensitivities to kinase inhibitor drugs. The improved kinome profiling methods described here represent an effective means to perform systematic analysis of kinases involved in cell signaling and oncogenic transformation and for analyzing the effect of different inhibitory drugs.
Protein kinases play essential roles in many normal and pathological processes1 and in mammals are encoded by over 500 genes. Reflecting their roles in regulation of cell proliferation and apoptosis, kinases are among the most commonly mutated genes in cancer, and more than 800 kinase inhibitors are already in clinical use or under development.3 Kinases generally harbor at least two domains: a catalytic domain that binds the target protein and ATP, and a regulatory domain that modulates the activity of the catalytic domain through allosteric interactions.4 The catalytic domain itself comprises N-terminal and C-terminal lobes with the ATP binding site lying in a deep cleft between the lobes. This cleft contains catalytic residues and an activation loop that are essential for the phosphoryl transfer reaction. Almost all protein kinase activation loops carry an Asp-Phe-Gly (DFG) motif that can assume either an active “DFG-in” or an inactive “DFG-out” conformation. Antibody-based methods (e.g., reverse phase protein arrays,5 enzyme-linked immunosorbent assay (ELISA), Western blotting) are widely used for measuring the abundance and activities of individual kinases, but kinome-wide analysis remains challenging due to generally low but highly variable abundance from one kinase to the next and from one cell type to the next. A traditional and time-intensive approach relies on conventional fractionation to allow low-abundance kinases to be identified.6 Because ATP binding sites are well-conserved, it is also possible to enrich for kinases with chemoproteomic probes, ATP analogues,7 or “immobilized kinase inhibitors”.8
The ATP analogues used in this paper, ActivX ATP probes (AAPs), comprise an ATP moiety, an acyl group that reacts with a lysine near the ATP binding pocket, and a desthiobiotin tag that is subsequently transferred to the protein. AAPs are widely used to measure on- and off-target effects of ATP competitive kinase drugs via competitive binding studies.7,9 Workflows using AAPs published to date use a label-free intensity-based quantification and generally involve measurement of a single peptide per kinase.7,9 Intensity-based quantification uses the ion current from the mass spectrometry (MS) signal to estimate peptide abundance, but is complicated by variation in experimental technique (since each sample is prepared separately) and run-to-run variation arising from electrospray inconsistency, detector instability, and fluctuations in retention time.
The goal of the current work was to develop a high-throughput method for kinome profiling involving AAPs. We adapted the existing AAP method so that they would be compatible with 6-plex tandem mass tags10 (TMT) to increase throughput. We observed that AAPs cross-link to both active and inactive states of most kinases, making it possible to profile much of the kinome in a single step. We describe a novel workflow that couples AAP and phosphopeptide enrichment making it possible to measure both kinase abundance and activity. Finally, we present an in-depth analysis of the kinomes and proteomes of six cell lines representative of different clinical subtypes of breast cancer. This data represents a useful resource for others working on signal transduction and oncogenic mechanisms.
EXPERIMENTAL SECTION
Peptide-Level Capture Using ActivX ATP Probes
Cell lysate (0.5 mg for each condition, prepared as described in the Supporting Information) was subjected to gel filtration in spin columns (Zeba, Pierce) according to manufacturer’s instructions to remove endogenous ATP, ADP, and small molecules and then diluted with reaction buffer (25 mM Tris–HCl pH 7.4, 150 mM NaCl, 1 mM EDTA, 1% NP-40, 5% glycerol) to a final protein concentration of 2 mg/mL. Protease inhibitors (1× “complete”, Roche 04693132001) and phosphatase inhibitors (final concentration 2 mM imidazole, 1 mM sodium fluoride, 1.15 mM sodium molybdate, 4 mM sodium tartrate dehydrate, 1 mM β-glycerophosphate, 50 μM phenylarsine) were added along with MnCl2 to a final concentration 10 μM.
It is important to note that the addition of manganese chloride (MnCl2) to the lysate in accordance with standard, published protocols7,9 resulted in formation of an unacceptable precipitate. This was due to a reaction of MnCl2 with sodium vanadate and/or sodium pyrophosphate (present in the standard phosphatase inhibitor cocktails). To avoid precipitation, we used phenylarsine and sodium β-glycerophosphatase rather than sodium vanadate and sodium pyrophosphate as phosphatase inhibitors.
Lysates in reaction buffer plus protease and phosphatase inhibitors and MnCl2 were incubated with AAP for 10 min at room temperature at final concentration of 5 or 20 μM. AAP at 5 μM was used when kinase inhibitors were being assayed, and 20 μM was used for experiments in the absence of inhibitors in which we aimed for maximal kinase enrichment. For inhibition studies, lapatinib was preincubated with lysate for 10 min prior to the addition of 5 μM AAP. At the end of the AAP labeling reaction, the reaction was quenched with 8 M urea, reduced with DTT (5 mM final concentration), and alkylated with iodoacetamide (15 mM final concentration). The solution was then subjected to gel filtration (Zeba, Pierce) followed by digestion with trypsin overnight at 37 °C (at 1:50 w/w final protein/enzyme concentration). The AAP-labeled, desthiobio-tinylated peptides were bound to immobilized streptavidin (Pierce) for 1 h at room temperature (at a ratio of 25 μL of slurry to 0.5 mg of digested protein in a final volume of 0.5 mL). Extensive washing (5 × 100 μL) with lysis buffer containing 6 M urea removed nonspecific binding peptides, and subsequent water washes (5 × 100 μL) removed buffer constituents. Washed peptides were eluted with elution buffer (3 × 50 μL, 50% ACN, 0.1% TFA) and dried under vacuum.
TMT Labeling
For labeling with tandem mass tags (TMT, Thermo Scientific, Rockford, IL), 0.8 mg of each TMT reagent (126, 127, 128, 129, 130, 131) was resuspended in 40 μL of anhydrous acetonitrile (ACN). Purified peptides from the AAP workflow were resuspended in 17.5 μL of 100 mM HEPES pH 8.5 and 5 μL of ACN to which 2.5 μL of TMT reagent was added. The TMT labeling reaction was performed at room temperature for 1 h, individual labeling reactions were quenched by the addition of 3 μL of 5% hydroxylamine, and the six samples were then combined and desalted using StageTips.11
Protein-Level Capture Using ActivX ATP Probes
AAP peptide-level and protein-level capture procedures involved the same cell culture and lysis protocols but diverged after the gel filtration step following AAP labeling. For protein-level capture, streptavidin was added to the lysate to capture the undigested, desthiobiotinylated proteins/kinases. Following extensive washing [lysis buffer containing 6 M urea (5 × 100 μL), 50 mM HEPES (5 × 100 μL)], the captured proteins were subjected to on-bead digestion with trypsin or Lys-C (1:50 protein/enzyme) for 4 h at 37 °C in a TMT-compatible buffer (50 mM HEPES, pH 7.4, 0.5 M Gu–HCl). Trypsin digestion was used for all samples except for the experiment where staurosporine was used as an inhibitor. Following digestion, the resulting peptides were extracted and the beads were also washed with 50 mM HEPES (2 × 50 μL), and these washes were added to the peptide mixture. Acetonitrile was then added to the peptide mixture to a final concentration of 30%, and the peptides were subjected to TMT labeling for 1 h similar to as described above.
Following enzymatic digestion, it is often necessary to clean up the sample prior to TMT labeling. However, this can be problematic with single-shot pull downs because protein recovery can be variable following StageTip/Sep-Pak. To avoid this problem, enzymatic digestion in this study was performed in a TMT-compatible buffer (50 mM HEPES, pH 7.4) and chaotropic agent (Gu–HCl) which avoided the need for further downstream purification prior to TMT labeling.
AAP–Phospho Enrichment
For experiments in which we aimed to measure the phosphorylation levels of kinases, 0.5 mg of lysate from MCF 10A cells treated with DMSO, EGF, or lapatinib were subjected to AAP protein-level capture. Following TMT labeling, peptides were purified by StageTip, dried, and resuspended in 100 μL of binding buffer (2 M lactic acid, 50% ACN). Phosphopeptides were enriched using TiO2 as described previously.12 An amount of 600 μg of TiO2 resin (GL Sciences, Tokyo, Japan) was prepared by washing with 2 × 200 μL of binding buffer and then added to the peptides in binding buffer and incubated for 1 h at room temperature. Following incubation, beads were recovered by centrifugation (4 min, 200g) and washed with binding buffer (5 × 200 μL). Bound phosphopeptides were then eluted with 50 mM KPO4 pH 10 (3 × 20 μL) and further purified by StageTip. The purified phosphopeptides were resuspended in 8 μL 5% formic acid (FA), and 4 μL was injected and analyzed by liquid chromatography–tandem mass spectrometry (LC–MS3). Details on mass spectrometry analysis and data analysis are provided in the Supporting Information.
Further experimental information on the classical large-scale protein expression profiling experiment (PEP), Western blotting, and in vitro Kinase activity assay for kinome analysis (KAYAK) techniques is provided in the Supporting Information.
RESULTS AND DISCUSSION
One classical approach of charting kinases and their expression in cell lysates involves extensive fractionation followed by shotgun sequencing that requires days of instrument time. Methods in which kinases are selectively purified therefore represent an exciting alternative. AAPs enrich for kinases by acylating lysines in their conserved ATP binding site and thereby introducing a desthiobiotin tag that can be isolated using streptavidin.7 Published AAP methods7,9 involve peptide-level streptavidin capture workflow and use label-free, intensity-based mass spectrometry for quantitation where each sample is run separately on the mass spectrometer. We sought to increase the throughput by combining the AAP workflow with TMT whereby six samples can be analyzed in a single mass spectrometry run. We also sought to isolate and analyze kinases using AAPs as a means to quantify regulatory phosphorylation events
Profiling Kinase Inhibitors with ATP Probes and TMT-Based Multiplexed Quantitation
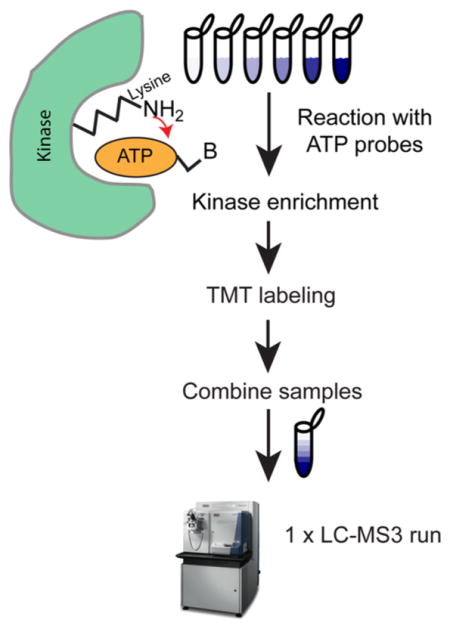
We developed and tested, using specific and nonspecific kinase inhibitors, two new kinome profiling workflows that combine AAPs with TMT labeling. One workflow uses streptavidin to capture undigested AAP-labeled proteins, and the other involves capture of digested AAP-labeled peptides (Supporting Information Figure S1A). To test the protein-level capture strategy in combination with TMT, kinome profiling was performed in HeLa lysate to which the nonspecific kinase inhibitor staurosporine was added at concentrations from 0 to 100 μM (Figure 1A and Supporting Information Table S1). IC50 values varied widely from <0.02 μM for Slk to 73 μM for Tp53rk (Figure 1B and Supporting Information Table S1) and were similar to those obtained in previous reports using previously published AAP peptide enrichment techniques,7 establishing the similarity of the two methods (Figure 1B and Supporting Information Table S1). Because inhibitors such as staurosporine compete with AAP for access to the ATP binding pocket, we would expect to observe a decrease in the levels of desthiobiotin-labeled kinases as staurosporine concentration increases. Whereas previously published7,9 AAP assays for kinase inhibitors used label-free intensity-based mass spectrometry, 6-plex TMT made it possible to collect a six-point dose–response curve in a single LC–MS run, as opposed to the six runs required previously, improving throughput. The quantitative accuracy is also likely improved due to isotopic labeling.
Figure 1.

Combining TMT with ATP probes for the accurate quantitation of kinases inhibitor profiling. (A) HeLa lysate was treated with six concentrations of staurosporine ranging from 0 to 100 μM followed by incubation with AAPs to label kinases and ATPases with desthiobiotin. Following streptavidin capture at the protein level, the proteins were digested and labeled with TMT before being combined into a single sample for analysis with LC–MS3. (B) Heat map of staurosporine inhibition in HeLa lysate, normalized to the kinase abundance in the maximum sample and clustered hierarchically using euclidean distance to group similar responders. Dose-dependent inhibition plots show profiles for various kinases. The data are shown as averages of the peptides quantitated for each of the kinases ± SD.
Next we examined lapatinib, a clinical-grade and highly specific inhibitor of EGFR/ErbB2 receptors (Supporting Information Figure S1B and Table S2), on MCF 10A lysate using the AAP peptide-level capture approach. Over a concentration range of 0–10 μM we observed inhibition of AAP labeling to three EGFR lysine residues (K867, K745, and K875) with IC50 values in the range of 0.10–0.18 μM. ErbB2 is only weakly expressed in MCF 10A and was not detected. No other kinases were observed to be significantly inhibited by lapatinib, consistent with the high specificity of this drug.
There are both advantages and disadvantages of the peptide-and protein-level capture methods (Supporting Information Figure S1). The main advantage of streptavidin capture at the protein level is the ability to analyze multiple peptides from a single kinase which strengthens quantitative results. Further enrichment of post-translational modifications on kinases is also possible. Streptavidin capture at the peptide level has the advantage of producing a much less complex mixture and generally results in increased kinase detection efficiencies.
Next we evaluated the ability of AAP to profile kinase expression levels across five breast cancer cell lines (BT-20, Hs 578T, MCF7, MDA-MB-231, and SK-BR-3) and a non-malignant normal control cell line (MCF 10A). These cell lines are among the most widely studied, carry different oncogenic mutations, and represent a range of clinical subtypes. We analyzed the six cell lines using AAPs (Figure 2A and Supporting Information Figure S2). In a single, 3 h LC–MS3 involving 0.5 mg of extract from six cell lines, we detected a total of 830 proteins; 93 of these were protein kinases corresponding to 135 modified lysines of which 122 were quantitated in all six channels (Figure 2A and Supporting Information Table S4, parts a and b). AAP pull down yielded many non-kinase ATP binding proteins that are also pulled down. In particular, Hsp90b1, Hsp90ab, Actr3, and Hspa8 accounted for a very large proportion of the spectral counts. This is a drawback when the primary focus is kinase profiling, although it also represents a means to perform profiling on other classes of ATPases. One possible way to reduce the contribution from the most abundant ATP binding proteins and allow a greater number of kinases to be identified in a single run would be to include selective inhibitors, such as geldanamycin for Hsp90, in the AAP reaction. It might also be possible to exploit structural differences in the ATP binding sites of kinase and non-kinase ATPases to enable separate targeted enrichment of each population.
Figure 2.

Comparison of AAP and PEP as methods to profile kinases. (A) AAPs were used to enrich for kinases and ATP binding proteins from six breast cancer cell lines. Following the reaction of each lysate with 20 μM AAP to label kinases and ATP binding proteins with desthiobiotin, the proteins were digested and the desthiobiotinylated peptides were captured using streptavidin. The purified peptides were then labeled with TMT and combined before being analyzed in a single run with LC–MS3. (B) For PEP analysis the six cell lysates were digested, labeled with TMT, combined, and then fractionated by strong cation-exchange chromatography (SCX) and analyzed with 22 LC–MS3 runs. (C) Cluster diagram illustrating enrichment and overlap of kinases and proteins in the two methodologies. The heat map represents the kinase intensities normalized to the maximum intensity across the six cell lines. Hierarchical clustering with euclidean distance groups similar proteins together. Pie charts depict the relative kinase enrichment of the two techniques (cyan vs black) as well as the overall number of identified proteins (size of circle). (D) Summary of the numbers of proteins and kinases identified in the two approaches.
Using AAP–TMT profiling we observed significant variation in kinase intensity profiles across the six cell lines (Figure 2A and Supporting Information Figure S2). To compare AAP–TMT labeling to classical protein expression profiling (PEP), the six lysates were digested, labeled with TMT, fractionated with strong cation-exchange chromatography, and analyzed by LC–MS3 techniques (Figure 2B). From 22 runs, 8128 proteins were identified (<1% FDR at protein level) of which 242 were kinases (Supporting Information Table S3, parts a and b). Although PEP identified more kinases, the kinase enrichment was much lower than observed with AAP (3% vs 11%) and much more LC–MS time was required (3 h versus 66 h) (Figure 2, parts C and D). For AAP 31 kinases were identified per hour versus 3.7 with PEP, an 8-fold improvement.
ActivX ATP Probes in General Do Not Selectively Enrich the Active Form of a Kinase
To date, no comprehensive study has been performed to determine whether ATP probes preferentially bind to the active or inactive form of kinases. For some protein kinases it is known that the activation loop blocks substrate binding in the inactive “DFG-out” configuration, but it is not known whether this affects ATP binding in general.13 To address this question we compared AAP profiling (Figure 3A), which relies on probe access to the ATP binding pocket, and PEP, which does not, across six cell lines. Good correlation was observed between the two methods (Figure 3, parts B and C) suggesting that the “active” form of the kinase was not enriched over the “inactive form” during the AAP labeling reaction. To compare the observed correlations to a null distribution where no correlation is expected, the cell lines were randomly shuffled, and the same correlation analysis was repeated. This was performed 1000 times, and the resulting r- and p-values were accumulated. Around 45% of kinases exhibited a high Pearson correlation coefficient (P < 0.05, r > 0.8), whereas only 3.6% of the randomized kinases did (Figure 3B). However, some lysine-modified sites on kinases from AAP profiling were poorly correlated and activation state cannot be ruled out as one of the factors (Supporting Information Figure S3).
Figure 3.
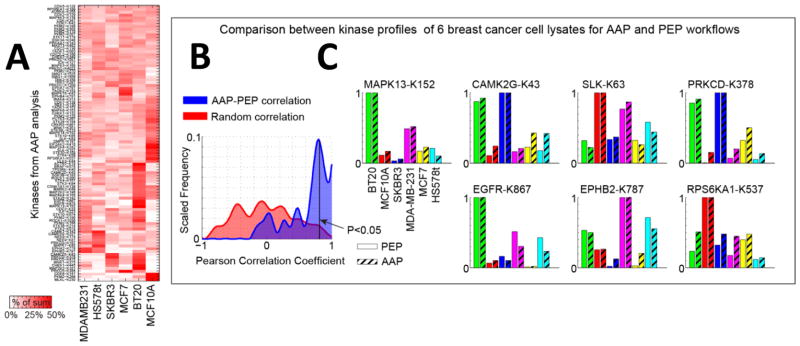
ATP probes in general do not appear to preferentially bind to the active form of a kinase. (A) Kinase profiles from AAP (peptide-level capture workflow) with TMT quantitation in six cell lysates in a single LC–MS3 run. The heat map represents the kinase intensities normalized to the sum of intensities across the six cell lines. Hierarchical clustering with euclidean distance groups similar responders together. A larger version of this heat map is shown in Supporting Information Figure S2. (B) Pearson correlation between the kinase profiles in the six lysates for AAP and PEP indicates a high degree of correlation between the two experiments (blue), as compared to the correlation obtained by randomly permuting the data (red). (C) Individual bar charts for kinase profiles for AAP and PEP workflows. The K indicates the modified lysine site to which the probe was attached.
The comparison between AAP and PEP (Figure 3, parts B and C, and Supporting Information Figure S3) suggests that, in general, the activity levels of kinases only minimally affect AAP binding because there was good agreement between the profiles from AAP enrichment and PEP. However, it is possible that there were only minor differences in the activity states of the detected kinases. To ensure maximum differentials in kinase activity levels, we treated MCF 10A cells with either (i) EGF, which stimulates EGFR and numerous downstream kinases, or (ii) with the EGFR inhibitor lapatinib, or (iii) DMSO (control). To ensure that EGF had indeed activated immediate early signaling cascades we analyzed cell lysates by Western blotting (Figure 4A) and kinase activity assay for kinome analysis (KAYAK)14 (Figure 4B and Supporting Information Figure S4 and Table S5); we observed substantial activation of Mapk, Akt, and Rps6ka1 kinases following EGF addition and inhibition when lapatinib was present. Then the same lysates were profiled using AAP–TMT, but no significant changes were observed in the spectrum of kinases detected with the key exception of inhibition of EGFR by lapatinib (Figure 4C and Supporting Information Table S6). Decreased binding of EGFR in the presence of lapatinib would be expected since lapatinib is bound to EGFR and reduces the ability of the probe to bind to EGFR. However, there was no evidence of other kinases displaying increased or reduced AAP binding, confirming that the probes did not appear to enrich for the active form of a kinase.
Figure 4.

Determining kinase activity using AAP. (A) Biological duplicates of MCF 10A cells treated with either EGF or lapatinib were analyzed with Western blotting (WB), (B) MS-based in vitro kinase activity assay KAYAK, and (C) AAP peptide-level capture to determine whether AAP preferentially reacts with the “active” form of a kinase. Evidence of EGFR/Mapk pathway activation/inhibition is clear from either WB or KAYAK analyses as changes in Rps6ka1, Akt, and Mapk. However, the levels of these proteins were unchanged in the reaction with the ATP probes, suggesting the probes reacted similarly with the active and inactive form of the kinase. The ATP probes did faithfully reflect the direct inhibition of EGFR by lapatinib. (D) The addition of an extra level of phosphopeptide enrichment following the reaction of ATP probes at the protein level allows quantitative information on the kinase activity to be obtained. Cell lines treated with EGF and lapatinib, respectively, were analyzed using the protein-level AAP enrichment workflow and the peptides labeled with TMT. A small portion (10%) was analyzed directly with LC–MS3 to obtain information on unmodified kinase abundance. The main portion (90%) was enriched for phosphopeptides using TiO2 before mass spectrometry analysis. Phosphorylations of sites in the activation loop of kinases Mapk1, Mapk3, and Stk24 were all observed to increase and decrease with EGF and lapatinib treatment, respectively, while the unmodified kinase abundance remained unchanged. Error bars represent the minimum and maximum of biological duplicate measurements.
Measuring Kinase Activity Using ActivX ATP Probes
Next we attempted to determine whether combining AAP–TMT labeling with phosphopeptide enrichment would make it possible to quantify the fraction of each kinase carrying a modification on the activation loop,15 which is usually correlated with activity. Following reaction of lysates with AAP and protein-level capture we split samples in half, subjecting one aliquot for kinome abundance profiling and subjecting the second part to phosphopeptide enrichment using TiO2. The profiles for unmodified and phosphorylated peptides were then compared.
We analyzed lysates from MCF 10A cells treated with EGF and lapatinib with AAP probes with and without phosphopeptide enrichment (Figure 4D and Supporting Information Tables S7 and S8). As before, we chose this experimental setup because it guaranteed widely varying levels of kinase activity in a defined signaling pathway. With the AAP–phospho workflow phosphorylation sites Y187–Mapk1, Y204–Mapk3, and T190–Stk24 increased with EGF stimulation and decreased with lapatinib treatment, whereas no changes were observed for the corresponding proteins in the AAP-only workflow. These phosphorylation sites are known to be located in the kinase activation loops and may therefore be useful indicators of activity. EGF stimulation of cells is known to activate the Mapk/Akt pathways, and the phosphorylation profiles of the activation loop sites were consistent with the results from Western blotting and KAYAK (Figure 4, parts A and B). In a single LC–MS3 run, 13 activation loop sites on kinases were quantified (Supporting Information Table S8) including sites on Braf, Gsk3b, Mapk3, Mapk1, Mark2, Ptk2b, Pdpk1, Rps6ka1, Slk, Stk10, and Stk24. Aside from the phosphorylation sites on kinase activation loops, other phosphorylation sites on kinases were also observed. For example, various phosphorylation sites on EGFR responded differently to EGF and lapatinib treatment (Supporting Information Figure S5).
These data show that kinase phosphorylation status, including those on known regulatory sites in the activation loop, can be quantified using our AAP–phospho workflow. One limitation is the small number (~10) of activation loop peptides that can be quantified in a single-shot mass spectrometry run. Future work might address this issue by adding fractionation steps post digestion to improve depth of coverage or by targeting specific activation loop peptides for detection by mass spectrometry. However, even the limited number of activation loop phosphorylation events detectable with the current method compares favorably to immune-based methods involving phospho-specific antibodies.
Large-Scale Characterization of the Kinome of Six Breast Cell Lines
Kinome analysis of six breast cancer cell lysates by both AAP and PEP both revealed a high degree of variation in the kinase abundance with cell lines (Figure 2). In total, 242 kinases were identified using PEP, and of these 212 were quantitated in all six channels using TMT. Hierarchical clustering showed that kinome abundance profiles clustered with subtype with SK-BR-3 and MCF7 luminal cell lines in one cluster and MCF 10A, MDAMB231, and Hs 578T basal B lines in another (Supporting Information Figure S6). The degree of variation in the receptor tyrosine kinase (RTK) expression across the six cell lines was larger than the other kinases (p = 8.4 × 10⁻⁵, Mann–Whitney U test, Figure 5, parts A and B). Looking at the profiles of the phosphatases from PEP we found that there was greater variance across the six cell lines for the protein serine/threonine phosphatases than there was for the protein tyrosine phosphatases (Supporting Information Figure S6).
Figure 5.

Comparison of kinase expression differences across six breast cancer cell lines. PEP on six cell lysates resulted in the quantitation of 212 kinases. (A) The heat map displays receptor tyrosine kinases (RTKs) normalized to the sum of the TMT channel intensities across all six channels. (B) A box and whisker plot illustrates the larger variance of the RTKs in the six cell lines compared to the other kinases. The p-value was determined from a Mann–Whitney U test. (C) Western blots for the indicated kinases. (D) Unsupervised K-means clustering using all kinases identified from PEP. Kinases are normalized to the sum of the TMT intensity across all the cell lines for each kinase. Individual bar charts illustrate the profiles for various kinases. The data are shown as averages of the peptides quantitated for each of the kinases ± SD.
Unsupervised K-means clustering was performed on the PEP kinase profiles of the six breast cancer cell lines. The broad kinase composition of the clusters was investigated to determine whether certain clusters/cell lines were enriched in particular families of kinases (Figure 5D). Tyrosine kinases were enriched in BT-20 cells (purple cluster, p = 0.008, Fisher’s exact test), whereas STE kinases were uniformly expressed across the six cell lines (gray cluster, p = 0.026). Known differences in kinase abundance were readily apparent in the data: Her2/ErbB2 is known to be highly expressed in SK-BR-3 cells,16 and this was observed by kinome profiling (Figure 5D). BT-20 cells express very high levels of EGFR,17 and this was also observed by kinome profiling, as was elevated expression of IGFR1 and ErbB3. PKC isoforms also varied in abundance across the cell lines with the α isoform elevated in MCF7 cells and the δ isoform most abundant in BT-20, MCF7, and SK-BR-3 cells; PKC ι was present at very low levels in Hs 578T cells. PKC isozymes are known to play a role in oncogenic transformation in breast cancer, have been targeted therapeutically, and have the interesting property that isozymes mediating proliferative responses in some cell lines can be inhibitory in others.18 Interestingly, PKA is also high in MCF7 cells and its activity is also known to be particularly high in MCF7 cells.14a Differences in the levels of Akt1 and Akt2 were also observed with Akt1 particularly abundant in MCF7 and Akt2 more consistent across the six cell lines. A list of all protein abundances for kinases and other proteins can be found in Supporting Information Table S3. In several cases Western blotting was performed to confirm the protein-level changes measured by mass spectrometry (Figure 5C and Supporting Information Table S9).
Breast cancer cell lines contain many of the molecular subtypes and pathways found in breast tumors and provide a model of the disease.19 For both clinical trials and personalized medicine, it is important to identify subsets of patients who will benefit from targeted therapeutics. Current studies examining the effect of drugs on large sample sets generally rely on measuring the levels of a small set of proteins (generally kinases such as EGFR, ErbB2) using ELISA-based methods, growth inhibition assays, or mRNA profiling. mRNA profiling has the advantage of being comprehensive, and studies have shown that thousands of genes contribute to the pathophysiology of breast cancer.19 However, RNA levels may not reflect the actual protein levels due to post-translational processing and degradation.20 While ELISA can accurately quantify the levels of a few proteins, it is unlikely that a single protein will be able to predict a therapeutic response.19,21 There is a need for rapid proteomics assays to measure multiple end points in the kinome, and the methods presented here provide important analysis tools for achieving that goal.
CONCLUSION
Proteome-wide analysis of kinase expression levels is challenging, in large because kinases are rarely very abundant and their levels and activities vary widely. Enrichment methods involving affinity reagents such as AAP have the advantage of fractionating samples based on a functional criterion, namely, binding to ATP. We demonstrated that isobaric tagging techniques are compatible with the AAP method dramatically improving the throughput of AAP-based kinase quantification. We find evidence that AAP does not significantly enrich kinases based on their activation states. A novel workflow based on AAP was presented whereby information can be obtained on both kinase abundance and activity from the same AAP reaction; this is done by enriching the whole kinase and performing a subsequent phosphopeptide enrichment step. We recapitulate known differences in receptor kinase expression levels across six breast cancer cell lines and find that RTK levels are generally more variable than levels of cytosolic signaling kinases. Aberrant RTK signaling is important in breast cancer, and the large variability in kinase abundances across the different cell lines, particularly for the RTKs, may offer an explanation for the very different responses of these cell lines to targeted kinase inhibitors.
Supplementary Material
Acknowledgments
The authors thank all members of the Gygi lab for helpful discussions and in particular Ryan Kunz, Woong Kim, Noah Dephoure, and Martin Wuehr. We also thank Alex Chan for helpful discussions regarding data analysis. We also thank John Rush and Jeffrey Knott at Cell Signaling Technology for help with peptide synthesis for KAYAK peptides. Special thanks to Lili Zhou for assistance with tissue culture and Western blotting. This work was supported by NIH Grant HG3456 and the NIH LINCs Consortium Grant U54 HG006097; see https://lincs.hms.harvard.edu for details.
Footnotes
Notes
The authors declare no competing financial interest.
Additional information as noted in text. This material is available free of charge via the Internet at http://pubs.acs.org.
References
- 1.Fantl WJ, Johnson DE, Williams LT. Annu Rev Biochem. 1993;62:453–481. doi: 10.1146/annurev.bi.62.070193.002321. [DOI] [PubMed] [Google Scholar]
- 2.Manning G, Whyte DB, Martinez R, Hunter T, Sudarsanam S. Science. 2002;298:1912–1934. doi: 10.1126/science.1075762. [DOI] [PubMed] [Google Scholar]
- 3.Pharma.org. [accessed 2010]; Website. http://newmeds.pharma.org.
- 4.Hubbard SR. Curr Opin Struct Biol. 2002;12:735–741. doi: 10.1016/s0959-440x(02)00383-4. [DOI] [PubMed] [Google Scholar]
- 5.Sevecka M, MacBeath G. Nat Methods. 2006;3:825–831. doi: 10.1038/NMETH931. [DOI] [PMC free article] [PubMed] [Google Scholar]
- 6.Washburn MP, Wolters D, Yates JR. Nat Biotechnol. 2001;19:242–247. doi: 10.1038/85686. [DOI] [PubMed] [Google Scholar]
- 7.Patricelli MP, Szardenings AK, Liyanage M, Nomanbhoy TK, Wu M, Weissig H, Aban A, Chun D, Tanner S, Kozarich JW. Biochemistry. 2007;46:350–358. doi: 10.1021/bi062142x. [DOI] [PubMed] [Google Scholar]
- 8.(a) Brehmer D, Godl K, Zech B, Wissing J, Daub H. Mol Cell Proteomics. 2004;3:490–500. doi: 10.1074/mcp.M300139-MCP200. [DOI] [PubMed] [Google Scholar]; (b) Wissing J, Jansch L, Nimtz M, Dieterich G, Hornberger R, Keri G, Wehland J, Daub H. Mol Cell Proteomics. 2007;6:537–547. doi: 10.1074/mcp.T600062-MCP200. [DOI] [PubMed] [Google Scholar]; (c) Duncan JS, Whittle MC, Nakamura K, Abell AN, Midland AA, Zawistowski JS, Johnson NL, Granger DA, Jordan NV, Darr DB, Usary J, Kuan PF, Smalley DM, Major B, He X, Hoadley KA, Zhou B, Sharpless NE, Perou CM, Kim WY, Gomez SM, Chen X, Jin J, Frye SV, Earp HS, Graves LM, Johnson GL. Cell. 2012;149:307–321. doi: 10.1016/j.cell.2012.02.053. [DOI] [PMC free article] [PubMed] [Google Scholar]
- 9.Patricelli MP, Nomanbhoy TK, Wu J, Brown H, Zhou D, Zhang J, Jagannathan S, Aban A, Okerberg E, Herring C, Nordin B, Weissig H, Yang Q, Lee JD, Gray NS, Kozarich JW. Chem Biol. 2011;18:699–710. doi: 10.1016/j.chembiol.2011.04.011. [DOI] [PMC free article] [PubMed] [Google Scholar]
- 10.Thompson A, Schafer J, Kuhn K, Kienle S, Schwarz J, Schmidt G, Neumann T, Johnstone R, Mohammed AK, Hamon C. Anal Chem. 2003;75:1895–1904. doi: 10.1021/ac0262560. [DOI] [PubMed] [Google Scholar]
- 11.Rappsilber J, Mann M, Ishihama Y. Nat Protoc. 2007;2:1896–1906. doi: 10.1038/nprot.2007.261. [DOI] [PubMed] [Google Scholar]
- 12.Kettenbach AN, Gerber SA. Anal Chem. 2011;83:7635–7644. doi: 10.1021/ac201894j. [DOI] [PMC free article] [PubMed] [Google Scholar]
- 13.Johnson LN. Q Rev Biophys. 2009;42:1–40. doi: 10.1017/S0033583508004745. [DOI] [PubMed] [Google Scholar]
- 14.(a) Kubota K, Anjum R, Yu Y, Kunz RC, Andersen JN, Kraus M, Keilhack H, Nagashima K, Krauss S, Paweletz C, Hendrickson RC, Feldman AS, Wu CL, Rush J, Villen J, Gygi SP. Nat Biotechnol. 2009;27:933–940. doi: 10.1038/nbt.1566. [DOI] [PMC free article] [PubMed] [Google Scholar]; (b) Kunz RC, McAllister FE, Rush J, Gygi SP. Anal Chem. 2012;84:6233–6239. doi: 10.1021/ac301116z. [DOI] [PubMed] [Google Scholar]
- 15.Adams JA. Chem Rev. 2001;101:2271–2290. doi: 10.1021/cr000230w. [DOI] [PubMed] [Google Scholar]
- 16.(a) Jannot CB, Beerli RR, Mason S, Gullick WJ, Hynes NE. Oncogene. 1996;13:275–282. [PubMed] [Google Scholar]; (b) Daly JM, Jannot CB, Beerli RR, Graus-Porta D, Maurer FG, Hynes NE. Cancer Res. 1997;57:3804–3811. [PubMed] [Google Scholar]
- 17.Wang Z, Zhang L, Yeung TK, Chen X. Mol Biol Cell. 1999;10:1621–1636. doi: 10.1091/mbc.10.5.1621. [DOI] [PMC free article] [PubMed] [Google Scholar]
- 18.Grossoni VC, Falbo KB, Kazanietz MG, de Kier Joffe ED, Urtreger AJ. Mol Carcinog. 2007;46:381–390. doi: 10.1002/mc.20287. [DOI] [PubMed] [Google Scholar]
- 19.Chin K, DeVries S, Fridlyand J, Spellman PT, Roydasgupta R, Kuo WL, Lapuk A, Neve RM, Qian Z, Ryder T, Chen F, Feiler H, Tokuyasu T, Kingsley C, Dairkee S, Meng Z, Chew K, Pinkel D, Jain A, Ljung BM, Esserman L, Albertson DG, Waldman FM, Gray JW. Cancer Cell. 2006;10:529–541. doi: 10.1016/j.ccr.2006.10.009. [DOI] [PubMed] [Google Scholar]
- 20.(a) Gygi SP, Rochon Y, Franza BR, Aebersold R. Mol Cell Biol. 1999;19:1720–1730. doi: 10.1128/mcb.19.3.1720. [DOI] [PMC free article] [PubMed] [Google Scholar]; (b) Chen G, Gharib TG, Huang CC, Taylor JM, Misek DE, Kardia SL, Giordano TJ, Iannettoni MD, Orringer MB, Hanash SM, Beer DG. Mol Cell Proteomics. 2002;1:304–313. doi: 10.1074/mcp.m200008-mcp200. [DOI] [PubMed] [Google Scholar]
- 21.Heiser LM, Sadanandam A, Kuo WL, Benz SC, Goldstein TC, Ng S, Gibb WJ, Wang NJ, Ziyad S, Tong F, Bayani N, Hu Z, Billig JI, Dueregger A, Lewis S, Jakkula L, Korkola JE, Durinck S, Pepin F, Guan Y, Purdom E, Neuvial P, Bengtsson H, Wood KW, Smith PG, Vassilev LT, Hennessy BT, Greshock J, Bachman KE, Hardwicke MA, Park JW, Marton LJ, Wolf DM, Collisson EA, Neve RM, Mills GB, Speed TP, Feiler HS, Wooster RF, Haussler D, Stuart JM, Gray JW, Spellman PT. Proc Natl Acad Sci USA. 2012;109:2724–2729. doi: 10.1073/pnas.1018854108. [DOI] [PMC free article] [PubMed] [Google Scholar]
Associated Data
This section collects any data citations, data availability statements, or supplementary materials included in this article.