

Abstract
Hyperpolarized xenon-129 is a non-invasive contrast agent for lung MRI, which upon inhalation dissolves in parenchymal structures, thus mirroring the gas-exchange process for oxygen in the lung. Multiple-exchange-time Xenon polarization Transfer Contrast (MXTC) MRI is an implementation of the XTC MRI technique in four dimensions (3 spatial dimensions plus exchange time). The aim of this study was to evaluate the sensitivity of MXTC MRI for the detection of microstructural deformations of the healthy lung in response to gravity-induced tissue compression and the degree of lung inflation. MXTC MRI was performed in four rabbits and in three healthy human volunteers. Two lung function parameters, one related to tissue- to alveolar-volume ratio and the other to average septal-wall thickness, were determined regionally. A significant gradient in MXTC MRI parameters, consistent with gravity-induced lung tissue deformation in the supine imaging position, was found at low lung volumes. At high lung volumes, parameters were generally lower and the gradient in parameter values was less pronounced. Results show that MXTC MRI permits the quantification of subtle changes in healthy lung microstructure. Further, only structures participating in gas exchange are represented in MXTC MRI data, which potentially makes the technique especially sensitive to pathological changes in lung microstructure affecting gas exchange.
Introduction
The development of hyperpolarization techniques for the noble gases helium-3 and xenon-129 (1) has resulted in a promising new class of contrast agents for lung MRI (2). Initially, most imaging research was focused on hyperpolarized helium-3 (HHe3) because of its larger gyromagnetic ratio, 100% isotopic abundance, and higher polarization levels. Several functional imaging methods were developed using HHe3, such as static and dynamic ventilation imaging based on spin-density contrast (3, 4), and mapping of the partial pressure of oxygen (pO2) based on the shortening of the T1 relaxation time in the presence of oxygen (5). The application of diffusion methods in HHe3 imaging enabled a non-invasive assessment of lung microstructure, permitting regional delineation of airspace enlargement in subjects with COPD (6-8). However, even though diffusion imaging is a potentially sensitive diagnostic imaging modality for certain lung diseases, its characterization of lung function is indirect and purely structural.
An important difference between HHe3 and hyperpolarized xenon-129 (HXe129) is the significantly larger blood-gas partition coefficient (λ) of xenon-129 (λ=0.1) (9) compared to that of helium-3 (λ<0.01) (10), which results in an easily-detectable fraction of xenon-129 dissolved in lung tissue (the so-called “dissolved phase”). Upon inhalation, xenon-129 atoms constantly exchange between alveolar airspaces and tissue structures, thus mirroring the main function of the lung, the exchange of oxygen and carbon-dioxide gases. Furthermore, xenon-129 in the dissolved phase experiences a significant chemical shift of its resonance frequency. As a result, the NMR spectrum of HXe129 in the lung shows several resonances: xenon in the gas phase (0 ppm), dissolved in tissue or blood plasma (∼198 ppm) and bound to hemoglobin (species dependent, 200-218 ppm) (11-14). With appropriately designed acquisition methods, it is therefore possible to distinguish gas- and dissolved-phase compartments in the lung: spectroscopy and chemical shift imaging directly quantify the xenon-129 magnetization in the respective compartments (11); in Dixon-type acquisitions compartment distinction is encoded via the magnetization phase (15, 16); direct dissolved-phase imaging was demonstrated recently in humans (17); and choosing appropriate imaging parameters in Cartesian gradient-echo pulse sequences allows simultaneous mapping of gas- and dissolved-phase xenon-129 (18).
Despite the potential of methods that directly interrogate the dissolved phase, the xenon-129 magnetization in the dissolved phase at any given instant is usually only on the order of 2% of the gas-phase magnetization, which makes such approaches challenging for imaging applications. This problem can be overcome with the Xenon polarization Transfer Contrast (XTC) MRI technique (19-21). In this method only the HXe129 gas phase is imaged, thus providing a substantial SNR advantage compared to (direct) imaging of dissolved HXe129. The image contrast is generated from selective inversion or saturation of the dissolved-phase magnetization using a series of narrow-bandwidth radio-frequency (RF) pulses; between each pair of RF pulses xenon atoms exchange between the gas- and dissolved–phase compartments, leading to exchange-dependent reduction of the gas-phase magnetization. For a fixed delay time between the contrast-generating RF pulses that is long relative to the time constant with which gas exchange takes place, XTC MRI enables the quantitative extraction of the regional tissue- to alveolar-volume ratio in the lung (19-21). The Multiple-exchange-time Xenon polarization Transfer Contrast (MXTC) MRI technique, initially demonstrated in reference (22), incorporates two advances over the original XTC method: 1) increased spatial resolution by replacing the single 2D-projection slice with a 3D acquisition; and 2) encoding of xenon-exchange information for multiple delay times. The use of multiple exchange times allows regional mapping of a second lung microstructure parameter, the time constant of the HXe129 exchange process, which is related to the average thickness of parenchymal septa. This parameter has been measured previously with HXe129 dynamic spectroscopy experiments (23), but spectroscopy yields only global results. With MXTC MRI, in vivo regional measurements of functional septal-wall thickness are possible.
The goal of this study was to evaluate the sensitivity of MXTC MRI by quantifying deformation of the microstructure of the healthy lung in response to gravity-induced tissue compression and the degree of lung inflation in both animals and humans.
Background
The MXTC pulse sequence is conceptually an extension of the original XTC MRI method (19-21). However, data are collected for multiple delay times, instead of just one. A detailed description of MXTC MRI has been provided in reference (22), and thus only a brief summary is given here. During a breath hold, three (in rabbits) or four (in humans) 3D FLASH image acquisitions (with image intensities Ii and using flip angles of αi) of the gas-phase magnetization are collected; the image acquisitions are separated by a series of saturation RF pulses centered at either approximately -200 ppm (control contrast, applied between I1 and I2) or +200 ppm (XTC contrast, applied between I2 and I3 and, if applicable, I3 and I4). For human studies, a multi-channel phased-array receive RF coil (24) enabled accelerated acquisitions using parallel imaging, which permitted collection of two XTC contrast maps for two different delay times in a single breath hold. Acquiring two contrasts during a single breath hold permitted a reduction of the total number of breath holds required to collect the multi-exchange time data.
After each saturation RF pulse during the XTC contrast preparation periods, the longitudinal magnetization in the dissolved phase is reduced. The only way this magnetization can recover is by gas exchange with the alveolar airspaces. However, as the longitudinal dissolved-phase magnetization is replenished, the gas-phase magnetization decreases by an equal amount. The number of xenon atoms that actually exchange depends directly on the delay time between the RF saturation pulses: short delay times permit little exchange while sufficiently long delay times permit full regrowth of the longitudinal dissolved-phase magnetization between RF pulses. The impact of a change in delay time depends strongly on the thickness of the alveolar walls and the diffusion constant for xenon in the lung tissue. Hence, measuring the gas-phase depolarization f as a function of the delay time τ between contrast-generating RF pulses allows the extraction of information about the xenon gas-exchange characteristics in the lung. As discussed in (22), depolarization maps fτ for a given delay time τ can be obtained from the 3D-FLASH image sets, each using N excitation RF pulses, according to:
| [1] |
where Np is the total number of saturation RF pulses and K is the number of excitation RF pulses before reaching the center of k space. The contrast ratio (I3/I2) is normalized by the control ratio (I2/I1) to account for magnetization decay due to T1 relaxation and HXe129 removal by the blood stream, and is further corrected for the different imaging flip angles (α1, α2, α3) to reflect xenon exchange only. For human studies, a second ratio map (using I4 and α4) was calculated accordingly.
Using this information it can be shown (22) that the HXe129 gas-phase depolarization curve f(τ) can be estimated as:
| [2] |
where F is the maximum depolarization value, labeled MXTC-F (F = f (τ → ∞)) and τc is the xenon exchange time constant. Using the xenon blood-gas partition coefficient (λ = 0.1(9)) and F, the gas-phase depolarization value for infinite delay times, the tissue- to alveolar-volume ratio can be extracted as:
| [3] |
where Vt̃ is the functional dissolved-phase volume as assessed by MXTC MRI and Va is the alveolar volume. The time constant τc characterizes the average thickness of the septal structures participating in the gas exchange process. The functional lung tissue thickness Lt̃ can be calculated from the square root of τc:
| [4] |
Here, Dm is the diffusion constant for xenon in the alveolar membranes (Dm=0.33*10-5cm2/s (20)). We will refer to the square root of τc as the parameter MXTC-S. In this study, MXTC MRI was implemented with saturation RF pulses which were non-selective with respect to the dissolved-phase resonances corresponding to the red-blood-cell and tissue/plasma compartments. Therefore, the two MXTC MRI parameters refer to the entire septal wall, with no distinction between red-blood-cell and tissue compartments.
Methods
Gas Polarization
Xenon-129 was polarized using a commercial prototype system (Xemed LLC, Durham, NH) (25). For a given set of experiments, up to two liters of enriched xenon-129 (isotope abundance 87%) were polarized via spin-exchange optical pumping during a 30-minute period.
Animal Study Setup
All animal protocols were approved by the local Institutional Animal Care and Use Committee. Animal experiments were performed with four New Zealand rabbits (denoted R1 through R4) weighing approximately 5 kg. The rabbits were anesthetized with a mixture of Xylazine 5 mg/kg and Ketamine 50 mg/kg. The animals were then intubated with an endotracheal tube and placed in a custom-made xenon-129 transmit/receive birdcage RF coil (IGC Medical Advances, Milwaukee, WI). At the beginning of each experiment, 20 ml (“low lung inflation”) or 40 ml (“high lung inflation”) of hyperpolarized xenon-129 were dispensed from a large Tedlar bag into a plastic syringe, which was then used to ventilate the rabbits starting at end-expiratory volume. The valve connecting the endotracheal tube to the syringe was closed for the duration of the experiment (∼10-15 s). Animal studies were conducted on a 1.5-Tesla commercial whole-body scanner (Avanto, Siemens Medical Solutions, Malvern, PA) with the multinuclear-imaging option.
Human Study Setup
Three healthy, non-smoking volunteers (denoted H1 through H3, 2 males, age range 19-21 years) were enrolled in the study, which was performed under a Physician's IND for imaging with HXe129 using a protocol approved by the local Institutional Review Board. Before each imaging procedure, written informed consent was obtained from the subject after the nature of the procedure had been fully explained. Immediately before and after imaging, spirometry was performed and an electrocardiogram was collected. Oxygen saturation levels and heart rate were monitored while the subject was in the MRI scanner. The total volume of HXe129 generated from a given 30-minute period of polarization was distributed among 500-ml Tedlar bags allowing up to four breath-hold experiments per polarization run. Gas mixtures given to human volunteers for each breath hold consisted of 500-ml HXe129, 150-ml oxygen and 100-ml room air. The oxygen and room-air mixture was contained in a second 500-ml Tedlar bag, which was connected to the HXe129 bag by a Y-connector. The subjects would inhale the gases from both bags simultaneously, ensuring a minimum concentration of 21% oxygen in the lung. The volunteers were asked to breath in the mixture starting at residual lung volume (RV) (“low lung inflation”). One volunteer was also imaged at total lung capacity (TLC) by breathing in additional room air after the xenon-oxygen-air mixture was administered (“high lung inflation”). In addition, one volunteer was imaged at low lung inflation in the prone, as opposed to supine, position, using a single, long exchange time (60 ms). Except for the volunteer scanned in the prone position, imaging studies for human volunteers were conducted on a whole-body 3T MRI system (TIM Trio, Siemens Medical Solutions, Malvern, PA) with the multinuclear imaging option. A custom made 32-channel receive-array RF coil with integrated asymmetric birdcage transmit RF coil was used for human studies (24). The study for the volunteer scanned in the prone position was performed on the same 1.5T MRI scanner as the rabbit studies, and used a custom-made transmit/receive wrap RF coil.
HXe129 Data Acquisition
As described above, the MXTC MRI pulse sequence acquires three (rabbits) or four (humans) 3D-FLASH image sets of the gas-phase magnetization, separated by a series of contrast-generating saturation RF pulses (22). For the FLASH acquisitions, non-selective 500-μs rectangular RF pulses centered at the gas phase (0 ppm) were used with flip angles of 1°, 1°, 2° and 4° in the human studies, and 1°, 2° and 4° in the rabbit studies. Except for the excitation flip angle, imaging parameters were identical for the three or four FLASH acquisitions. In human studies, the imaging parameters were: TR/TE 7.7/2.5 ms, image resolution 9.2 × 9.2 × (21-24) mm3, matrix size 48 × 30 × 10 (image dimensions refer to patient head-foot (frequency encoding) × left-right (phase encoding) × anterior-posterior (partition encoding) directions), acceleration factor 3, reference lines 21, receiver bandwidth 260 Hz/pixel. The imaging parameters for the animal studies were: TR/TE 6.0/3.0 ms, image resolution 3.5 × 3.5 × 7.0 mm3, matrix size 32 × 28 × 10, receiver bandwidth 260 Hz/pixel.
The contrast-generating saturation pulses were Gaussian RF pulses, with pulse duration of 3 ms for human studies and 1 ms for animal experiments. The flip angle was 90° in rabbit studies but, due to hardware limitations on our 3T scanner, the flip angle was limited to 75° in human studies. Thus, for the human studies, the resulting XTC depolarization maps underestimated the true exchange contrast, because the dissolved phase was not completely saturated (26). In order to obtain a correction factor for this effect, we also collected, in one human volunteer, 90° XTC spectroscopy data on the 1.5 T MRI scanner using a custom-made transmit/receive wrap RF coil. By comparing these results to XTC data acquired at 3T using the same delay times, we obtained a correction factor for XTC maps in the MXTC MRI study. For XTC contrast the saturation RF pulses were centered at the xenon dissolved-phase resonance at 208 ppm for human volunteers and 202 ppm for rabbit experiments, and for control contrast the saturation RF pulses were centered at the corresponding negative values. The number of saturation RF pulses was chosen such that the total gas-phase depolarization between image acquisitions was approximately 40%. To collect multiple delay time depolarization maps, two to four breath holds were performed for human studies and up to eight breath holds for rabbit studies. FLASH imaging parameters were held constant, but the xenon exchange time was varied for each contrast period.
Data Analysis
The raw k-space data were transferred from the MRI scanner and analyzed offline using MATLAB (MathWorks Natick, MA). Images from accelerated k-space acquisitions in humans were reconstructed with the GRAPPA algorithm (27). Regions of noise or low SNR in the reconstructed spin density images were removed using a threshold mask. From each breath hold data set one (rabbit) or two (human) XTC depolarization maps were calculated according to Eq. [1]. In human studies, the depolarization maps were multiplied by the correction factor (equal to 1.5) discussed above to account for the 75° saturation pulses. The complete MXTC MRI data set, consisting of depolarization maps for several delay times, was fit on a voxel-by-voxel basis to Eq. [2] using nonlinear weighted least square fitting. The fitting weights were the measurement errors of the depolarization maps. These errors were estimated using the standard deviation within each image slice. This is a valid approximation under the assumption that image noise and not structural features dominate the in-plane variation in the maps. The quality of each voxel fit was evaluated by calculating a p-value from the χ2-distribution. In voxels with a p-value > 0.95, the null hypothesis that there is no significant difference between the expected and observed result was rejected and the voxel fit parameters were labeled as invalid. Maps for the two fitting parameters, the maximum depolarization MXTC-F and the square root of the time constant MXTC-S, were calculated. Using Eqs. [3] and [4], physiological microstructure parameters were calculated from the fitting parameters.
In order to investigate the dependency of the microstructure parameters on lung inflation, an unpaired two-tailed Student's t-test was applied comparing parameter distribution means of the high lung-inflation experiment to those for the low lung-inflation experiment. We further quantified the gravity dependence by linear fitting of the medians of the parameter values for each image slice as a function of anterior-posterior (AP) position, starting at the most posterior slice. Significance of the slope of the linear fit was evaluated using Student's t-test, comparing the slope to zero. The slope of the linear fit (AP-gradient) was normalized using (ΔX/X)/Δh, where ΔX is the absolute parameter change over the position change Δh along the AP direction and X is the median parameter value.
Results
Microstructure Parameter Maps
In Fig. 1, the first and last set of 3D-spin density images (acquisition I1 (Fig. 1a) and I4 (Fig. 1b)) from a single breath-hold in human volunteer H3 are shown. In the most anterior and the most posterior images, the image intensity was higher due to the sensitivity profile of the receive-array RF coil. No apparent AP-gradient was observed in acquisition I1 (Fig. 1a). After XTC-contrast encoding a reduction of gas phase signal, especially in posterior partitions, was observed (Fig. 1b).
Figure 1.
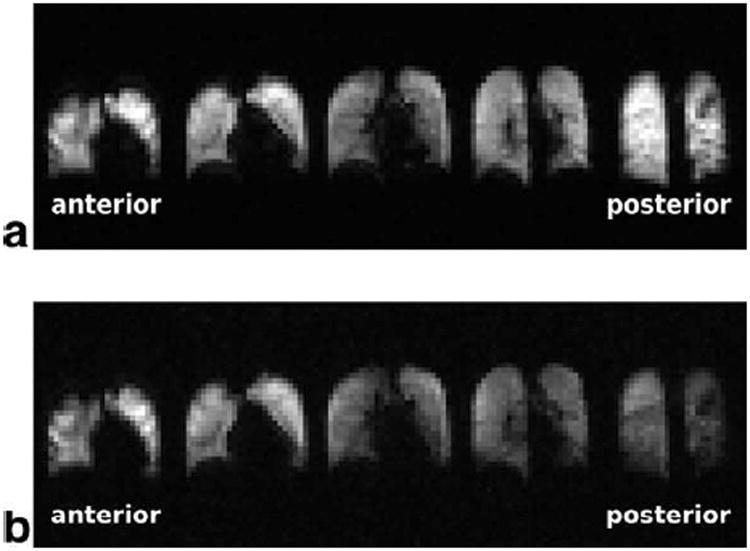
Two 3D gas-phase image acquisitions (I1 (a) and I4 (b)) from a single breath hold in volunteer H3. I1 (a) is acquired at the beginning of the breath hold and therefore depicts ventilation. No AP-gradient was observed in I1, however image intensity was increased in the most posterior and the most anterior partitions due to the surface coil intensity profile of the receive-array RF coil. After XTC-contrast encoding the gas phase signal is reduced in I4, with a relatively larger decrease in posterior partitions indicating an increase in the tissue- to alveolar-volume ratio.
Fits of the signal-intensity data from two individual voxels are shown in Fig. 2a, b. Maps of the p values of the fits, illustrating regional quality of the fitting, are shown for volunteer H3 in Fig. 2c, d. Fitting uncertainty (i.e., values near 1 [white] in the maps) was elevated close to the edges of the lungs and near the diaphragm. Also, for the human studies, the central slices exhibited increased fitting uncertainty due to their lower SNR secondary to the surface-coil sensitivity profiles of the array RF coil.
Figure 2.
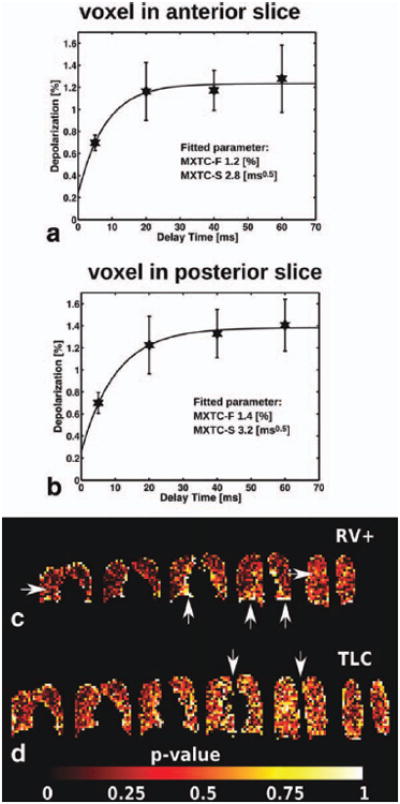
Fits of the signal-intensity data from two individual voxels (a, b) and p-value maps illustrating the quality of fit (c, d). Voxel fits, from subject H3 at low ventilation volume (RV+: xenon-oxygen-air mixture inhaled from RV), showed an elevated time constant (related to MXTC-S) and elevated maximum depolarization value (related to MXTC-F) in posterior slice (b) compared to anterior slice (a). Error bars correspond to the standard deviation of the depolarization values in the respective image slice. The location of the voxel fits shown in (a) and (b) is indicated in (c) by arrows. The quality of fit (volunteer H3) is illustrated for each imaging voxel by a p-value calculated from the χ2 -distribution of the weighted fit result (c, d). For p > 0.95, the null hypothesis, i.e. no significant difference between expected and observed result exists, was rejected and the fitted parameters for the particular voxel were flagged as invalid. The map shows regions of low fit quality (high p-value) around the edges of the lung and around the heart, possibly secondary to motion. During the TLC experiment (d), SNR was lower resulting in overall decreased fit quality, especially at the center images since the sensitivity of the surface coil receivers decreases with distance from the coils. The five (c) and six (d) coronal image partitions are the center partitions out of a total of eight partitions acquired, covering the entire lung volume.
Maps for the fitting parameters MXTC-F and MXTC-S are shown for volunteer H3 and rabbit R2 in Figs. 3 and 4, respectively. At low lung inflation (panels a and b in Figs. 3 and 4, labeled RV+ for the human and 20 ml for the rabbit), we observed a homogeneous distribution of microstructure parameter values within each image slice, and a gradient of parameter values along the direction of gravity. Parameter values were increased in posterior images, which correspond to the dependent region of the lung in the supine position. At high lung inflation (panels c and d in Figs. 3 and 4, labeled TLC for the human and 40 ml for the rabbit), the parameter maps had lower values throughout the lung and the AP-gradient was less apparent. For the one volunteer who was also imaged prone at low lung inflation, we observed increased depolarization values towards the anterior images (Fig. 5), which correspond to the dependent lung region in the prone position. A summary of the range of median values for the whole lung (± std deviation) for the microstructure parameters is given in Table 1.
Figure 3.
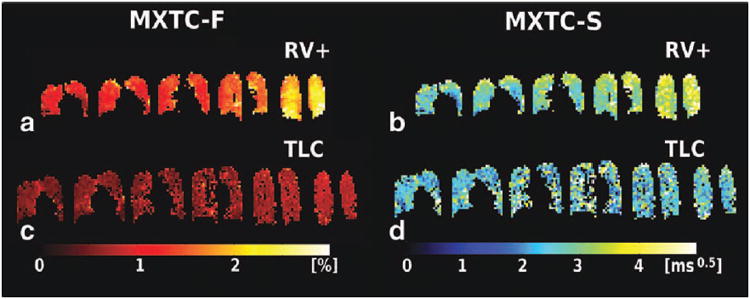
Parameter maps for tissue- to alveolar-volume ratio parameter MXTC-F, and septal-wall thickness parameter MXTC-S, obtained from curve fitting (volunteer H3). (a, b) At low lung inflation (labeled RV+), elevated parameter values were found in dependent lung regions (posterior images, to the right). (c, d) At high lung inflation (TLC), parameter values were generally lower and appeared fairly homogeneous throughout the lung.
Figure 4.
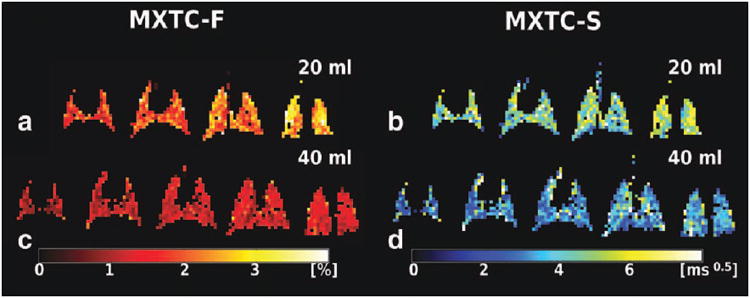
Parameter maps for tissue- to alveolar-volume ratio parameter MXTC-F, and septal-wall thickness parameter MXTC-S, for rabbit R2 ventilated to two different lung volumes. (a, b) Analogous to the human results, an AP-gradient was clearly visible at low lung inflation (20 ml). (c, d) No AP-gradient was observed at high lung inflation (40 ml).
Figure 5.
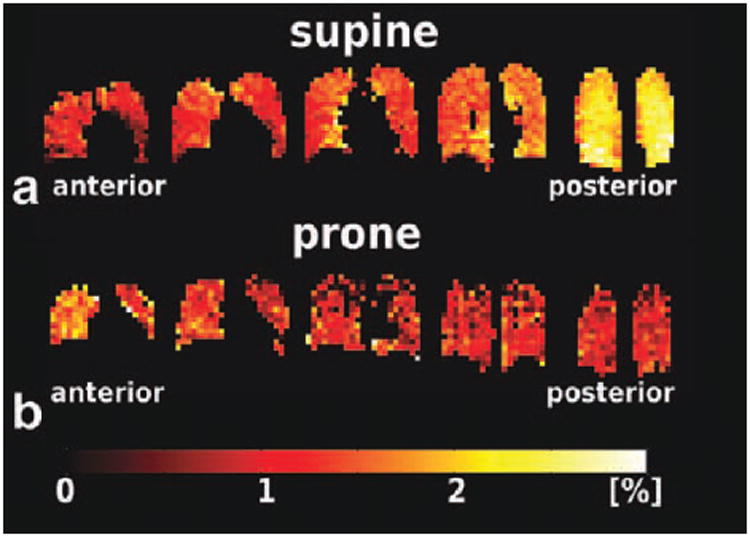
XTC depolarization maps of volunteer H3 in the (a) supine and (b) prone positions, acquired at 3T and 1.5T, respectively. For the supine position, higher depolarization values were seen in the most posterior slices (to the right in a), indicating increased tissue density. This effect is consistent with gravity-induced tissue compression in the dependent lung regions. In the prone position, the direction of the depolarization gradient was reversed, as expected, since the dependent lung regions corresponded to the anterior slices (to the left in b). Also clearly visible is the better quality of the depolarization maps at 3T (a) compared to those at 1.5T (b) due to the differences between the RF coils used at the two field strengths. At 1.5T, a custom-made transmit/receive wrap RF coil was used, which had inferior B1 homogeneity and volumetric coverage compared to the 3T RF coil, a 32 channel phased-array receive coil with an integrated asymmetric birdcage transmit coil.
Table 1.
Summary of MXTC MRI microstructure parameter distributions and linear fits of parameters as a function of AP-position for three healthy volunteers and four rabbits.
| Human | MXTC-F [%] | MXTC-S [ms0.5] | |||||||||||||
|---|---|---|---|---|---|---|---|---|---|---|---|---|---|---|---|
|
|
|||||||||||||||
| H1 | H2 | H3 | Mean±Std | H3 TLC | H1 | H2 | H3 | Mean±Std | H3 TLC | ||||||
| WL Median | 1.1 | 1.4 | 1.4 | 1.3±0.2 | 0.7 | 3.2 | 3.5 | 3.1 | 3.3±0.2 | 2.5 | |||||
| WL Std | 0.5 | 0.4 | 0.5 | 0.5±0.1 | 0.2 | 1.6 | 0.9 | 1.0 | 1.1±0.4 | 1.4 | |||||
| Slice Std | 0.2 | 0.2 | 0.3 | 0.3±0.1 | 0.2 | 1 | 0.5 | 0.9 | 0.8±0.3 | 1.1 | |||||
| AP Diff | 0.9 | 0.9 | 1.0 | 0.9±0.1 | 0.3 | 1.7 | 0.3 | 0.9 | 1.0±0.7 | 0.2 | |||||
| AP-slope [%/cm] | -7.0 | -5.9 | -7.0 | -6.6±0.6 | -3.2 | -4.5 | -1.0 | -2.8 | -2.8±1.7 | -0.4 | |||||
| p-value | 0.015* | 0.001* | 0.017* | 0.011 | 0.002* | 0.015* | 0.003* | 0.004* | 0.007* | 0.335 | |||||
|
| |||||||||||||||
| Rabbit | MXCT-F [%] | MXTC-S [ms0.5] | |||||||||||||
|
|
|||||||||||||||
| 20 ml | R1 | R2 | R3 | R4 | Mean±Std | R1 | R2 | R3 | R4 | Mean±Std | |||||
|
|
|||||||||||||||
|
| |||||||||||||||
| WL Median | 2.4 | 2.1 | 2.0 | 1.9 | 2.1±0.2 | 5.6 | 4.8 | 4.1 | 4.0 | 4.6±0.7 | |||||
| WL Std | 0.7 | 0.8 | 1.0 | 0.8 | 0.8±0.1 | 1.5 | 1.4 | 1.9 | 1.6 | 1.6±0.3 | |||||
| Slice Std | 0.5 | 0.5 | 0.4 | 0.3 | 0.4±0.1 | 1.3 | 1 | 1.3 | 1.4 | 1.3±0.2 | |||||
| AP Diff | 1.2 | 1.0 | 1.3 | 1.3 | 1.2±0.1 | 0.6 | 0.6 | 0.8 | 0.3 | 0.6±0.2 | |||||
| AP-slope [%/cm] | -16.1 | -17.3 | -22.7 | -17.6 | -18.4±2.9 | -4.0 | -4.0 | -7.2 | -2.8 | -4.5±1.9 | |||||
| p-value | 0.009* | 0.037* | 0.003* | 0.001* | 0.013 | 0.199 | 0.428 | 0.095 | 0.113 | 0.209 | |||||
|
| |||||||||||||||
| Rabbit | MXTC-F [%] | MXTC-S [ms0.5] | |||||||||||||
|
|
|||||||||||||||
| 40 ml | R1 | R2 | R3 | R4 | Mean±Std | R1 | R2 | R3 | R4 | Mean±Std | |||||
|
|
|||||||||||||||
|
| |||||||||||||||
| WL Median | 1.8 | 1.2 | 1.7 | 1.4 | 1.5±0.3 | 4.6 | 3.3 | 4.9 | 3.8 | 4.2±0.8 | |||||
| WL Std | 0.5 | 0.4 | 0.5 | 0.5 | 0.5±0.1 | 1.5 | 1.6 | 2.0 | 1.3 | 1.6±0.3 | |||||
| Slice Std | 0.4 | 0.3 | 0.5 | 0.2 | 0.4±0.1 | 1.3 | 1.3 | 1.7 | 0.9 | 1.3±0.3 | |||||
| AP Diff | 0.4 | 0.4 | 0.4 | 0.7 | 0.5±0.1 | 0.5 | 0.6 | 1.6 | 1.2 | 1.0±0.5 | |||||
| AP-slope [%/cm] | -7.8 | -7.5 | -8.2 | -13.0 | -9.1±2.6 | -3.9 | -4.5 | -9.6 | -9.2 | -6.8±0.3 | |||||
| p-value | 0.006* | 0.027* | 0.169 | 0.001* | 0.051 | 0.083 | 0.038* | 0.174 | 0.024* | 0.079 | |||||
Table 1 notes: TLC = total lung capacity; WL = whole lung parameter distribution; Std = standard deviation; Slice Std = minimum value of the standard deviations of the individual slices; AP Diff = median of most posterior slice – median of most anterior slice; AP-slope = linear fit of slice medians as a function of AP-position, normalized by median value and multiplied by 100; p-value = significance of linear fit of slope;
denotes significance at p<0.05.
Given the MXTC-F and MXTC-S values, Eqs. [3] and [4] provide the tissue- to alveolar- volume ratio (Vt̃/Va) and the mean septal-wall thickness (Lt̃), respectively. For three human subjects, the range of median values for the whole lung (± std deviation) for Vt̃/Va, derived from MXTC-F was 0.11-0.14 (0.04 - 0.05) at low lung inflation and 0.07 (0.02) for one subject at TLC. For four rabbits, Vt̃/Va was 0.19-0.24 (0.07-0.1) at low lung inflation and 0.12-0.18 (0.04-0.05) at high lung inflation. The calculation of the mean septal-wall thickness from the parameter MXTC-S requires knowledge of the effective diffusion constant for xenon within tissue structures. Using a previously estimated value for Dm in XTC studies (Dm= 0.33*10-5 cm2/s (20)), we obtained a median septal-wall thickness ranging from 5.5-6.3 μm (1.6-2.8 μm) in humans at low lung inflation and 4.6 μm (2.5 μm) at TLC. For rabbits the whole lung median septal-wall thickness at 20 ml lung inflation ranged from 7.2-10.0 μm (2.5-3.5 μm) and at 40 ml lung inflation ranged from 5.9-8.9 μm (2.3-3.5 μm).
Parameter Dependence on AP-position and Ventilation Volume
Considering the whole lung at different ventilation volumes, we found that the means of the parameter distributions for both MXTC-F and MXTC-S at high lung inflation were significantly lower than the means at low lung inflation. Based on a two-tailed Student's t-test, the differences were found to be significant with p-values < 0.0001 for both humans and rabbits.
To further illustrate the parameter gradients along the direction of gravity, we plotted the median parameter values of each image as a function of AP-position (human, Fig. 6 and rabbits, Fig. 7). A summary of results from linear fitting of parameter value versus AP-position for all subjects is given in Table 1. For the tissue- to alveolar-volume ratio parameter MXTC-F, the mean value ± standard deviation for the normalized slope in the three human subjects was −6.6 ± 0.6 %/cm at low lung inflation, which was about twice the value of -3.2 %/cm for subject H3 at TLC. The normalized slope for the septal-wall thickness parameter MXTC-S at low lung inflation (-2.8 ± 1.7 %/cm) was about a factor two lower than the MXTC-F slope at the same lung inflation. All slope values in humans were statistically significant (p-value < 0.05), except for the slope of parameter MXTC-S at TLC (-0.4 %/cm, p-value = 0.335). For rabbits, the normalized slope for MXTC-F was -18.4 ± 2.9 %/cm (p-value < 0.05) at low lung inflation and, similar to the human results, was approximately a factor two lower at high lung inflation (−9.1 ± 2.6 %/cm, p-value = 0.051). In rabbits, the slope changes for parameter MXTC-S were not statistically significant (-4.5 ± 1.9 %/cm, p-value = 0.209 at low lung inflation; -6.8 ± 0.3 %/cm, p-value = 0.079 at high lung inflation).
Figure 6.

Median parameter values for each slice plotted as a function of AP-position. (a) MXTC-F and (b) MXTC-S for subjects H1-H3 at low lung inflation are shown in blue and for subject H3 at high lung inflation (TLC) are shown in black. Error bars are standard errors of the median. The curves show an AP-gradient for parameter values at low lung inflation (blue). The gradient is much less apparent (MXTC-F) or essentially gone (MXTC-S) at high lung inflation (black).
Figure 7.
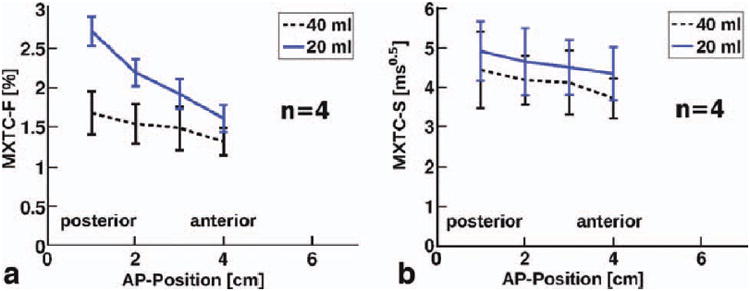
Median parameter values for each slice as a function of AP-position for four rabbits. (a) MXTC-F and (b) MXTC-S (b) at low lung inflation (20 ml) are shown in blue and at high lung inflation (40 ml) are shown in black. Error bars indicate the standard deviations of the data from the four rabbits. Similar to the human results, an AP-gradient for MXTC-F was pronounced at low lung inflation. In contrast, for MXTC-S, a statistically-significant volume dependence of the gradient was not found. However, especially for MXTC-S, the differences among the rabbits were relatively large, as indicated by the error bars.
Discussion
MXTC MRI can quantify regional properties of lung microstructure by mapping two physiologically relevant parameters: tissue- to alveolar-volume ratio and septal-wall thickness. The results of this study show that the sensitivity of MXTC MRI is sufficient to detect deformations in regional lung microstructure due to changes in ventilation volume or, at constant lung inflation, due to changes along the direction of gravity, induced by the weight of the lung itself.
The compression of lung structures at low ventilation volumes in the dependent regions, caused by the lung's weight, is a well known effect and has also been reported in various imaging studies (17, 18, 20, 29-37). For our experiments the subject was usually placed inside the MR scanner in a supine position and, as a result, the direction of non-dependent to dependent lung regions was from anterior to posterior image slices. In order to demonstrate the sensitivity of MXTC MRI to assess lung microstructure, we quantified the AP-gradient of MXTC MRI parameters in healthy volunteers and rabbits. The normalized slope along the direction of gravity for the tissue to alveolar-volume ratio parameter MXTC-F was -6.6%/cm for the human subjects at low lung inflation, and a factor of 2 lower at TLC, indicating decreased lung compliance at higher ventilation volumes, which reduces gravitational tissue deformation. The measured MXTC-F AP-gradients at low lung inflation in humans were ∼30% higher than reported whole-lung density gradients, measured at FRC with proton MRI (-4.9 ± 1.9 %/cm (30)), at RV using CT (-4.4 %/cm, (31)), and during quiet breathing with PET (-5 ± 1.2 %/cm, (32)) and SPECT (-5.1%/cm, (33)). An important difference between MXTC-F AP-gradients and whole-lung density gradients is that MXTC-F probes only those lung-parenchyma structures that are directly involved in xenon-gas exchange, whereas proton MRI, CT and PET/SPECT measurements also include larger extra-parenchymal, and consequently more rigid, structures. In light of these considerations, the finding that the MXTC-F gradient is ∼30% higher is in excellent agreement with a PET study result from Brudin et.al. (34), who reported that correcting for extra-capillary blood volume increases the AP-gradient by 30%.
The deformation of parenchymal lung microstructure in the supine position has been previously observed using other hyperpolarized gas MR techniques such as apparent diffusion coefficient and q-space measurements, which probe alveolar size. However, results were not quantitative (35, 36) or the measured AP-slope was only ∼ 2%/cm (calculated from (37)). Also, in recent studies of direct dissolved-phase imaging of HXe129, AP-gradients were observed, indicating increased HXe129 uptake in dependent lung regions (17, 18).
Comparing our results for the AP-gradient in rabbit and human studies, we found that the normalized slopes for the tissue- to alveolar-volume parameter in the rabbit experiments were approximately three times the values found in human studies (Table 1). This is consistent with the result obtained by Davidson et al (38), who found that lung compliance in rabbits is approximately 2.5 times greater than in man. We also observed gravitational gradients for the septal-wall thickness parameter MXTC-S, however these were considerably lower than the MXTC-F gradients. The observation that inflation volume and gravitational tissue deformation have an effect not only on the tissue to alveolar-volume ratio parameter, but also on the septal-wall thickness parameter, is consistent with the observation that the lung microstructural response is a combination of alveolar recruitment and alveolar distention (39).
To exclude systematic experimental errors in the observation of the AP-gradient, one human volunteer was additionally imaged in the prone position for a single, long delay time. Because the 32-channel receive array coil used for MXTC studies at 3T did not allow prone positioning, the control experiment had to be performed at 1.5T where a flexible wrap coil was available. Using a different experimental setup for the control experiment is not ideal and is an important limitation concerning the validity of the control experiment. Further, the quality of the parameter maps from the prone experiment was clearly inferior to that of the supine study due to the lower sensitivity and coverage of the wrap coil, although sufficient to observe the expected “reversed” AP-gradient in depolarization values for a single long delay time.
The gold standard for a quantitative assessment of lung structure is the use of stereological methods applied to ex vivo tissue samples (40). The stereological method, which extrapolates physical properties of a 3D structure from 2D sections, considers several levels (40): level 1 distinguishes parenchyma from non-parenchyma (10-15% (40)), level 2 differentiates between “tissue” septa and alveolar and duct airspaces, level 3 assesses the capillary blood and alveoli-capillary tissue compartments within “tissue” septa, and level 4 refers to tissue composition (epithelium, endothelium and interstitium). In this study, Vt̃/Va, derived from MXTC-F, measures the septal volume (with no distinction between tissue and blood compartments for the non-selective XTC method implemented in this study) divided by total ventilation volume. The MXTC MRI contrast is, however, exclusively derived from septal structures participating in gas exchange between alveolar airspaces and alveolar septal walls. Therefore, the reference space for MXTC MRI parameters could be classified as a “functional” subspace of level 2 stereology. As a result, the MXTC-F derived Vt̃/Va (here the tilde refers to functional volume) is expected to be lower than the parenchymal Vt/Va derived from histology. In concordance with these considerations, Vt̃/Va derived from MXTC MRI was lower than literature results obtained by histology. For rabbits, the Vt̃/Va values derived from MXTC-F at low lung inflation (0.19-0.24 at FRC+20 ml, corresponding to ∼55% TLC (38, 41)) and at high lung inflation (0.12-0.18 at FRC+40 ml, corresponding to ∼70% TLC (38, 41)) were slightly lower than the parenchymal septal volume fractions reported by Knudsen et.al., who found 0.26 for Vt/Va at 40% TLC and 0.19 at 80% TLC (41), but were nonetheless overall in excellent agreement. For humans, Vt̃/Va values derived from MXTC-F (0.11-0.14 at low lung inflation and 0.07 at TLC), were about a factor two lower than literature results for Vt/Va obtained using CT density measurements (0.26 at FRC and 0.16 at TLC, derived from (42)). A potential explanation for the observed difference is that CT density measurements also include extra-parenchymal structures in the lung which do not participate in gas exchange and therefore are excluded in MXTC-F results. Also to consider is the uncertainty in the MXTC-F derived Vt̃/Va results in human studies, which is induced by the correction factor applied to account for the non-90° contrast pulses as discussed earlier.
Considering the mean septal-wall thickness calculated from the parameter MXTC-S, the values in humans at low lung inflation (5.5-6.3 μm) were comparable to literature values of 5-8 μm (39, 42). MXTC MRI as applied in this study does not distinguish between the blood and tissue resonances of dissolved-phase xenon. Therefore, the thickness measured by xenon exchange averages over capillaries (diameter ∼10 μm (44)) and air-blood barrier structures (thickness ∼3.5 μm in humans and ∼1.2 μm in rabbits (45)). The average septal-wall thickness for rabbits is expected to be ∼1-2 μm thinner than that for humans. However, we measured slightly higher values in rabbits.
Several factors contribute to the uncertainty in the calculation of the septal-wall thickness and will be discussed briefly: 1) Since the number of delay times at which the gas-phase depolarization was measured was small, the actual location of these sampling points along the depolarization curve greatly affected the accuracy of the extracted MXTC parameters, in particular that of MXTC-S. Due to the small number of studies we were able to conduct, coupled with the circumstance that the regional distribution of the xenon gas-exchange time constants and their dependence on lung inflation was largely unknown, the selected sampling pattern was far from optimal. The results presented now form the foundation for performing sampling optimizations, which should greatly improve the measurement accuracy for MXTC-S. 2) In our xenon gas-exchange model, we neglected that the removal of labeled HXe129 spins by the blood stream also impacts the measured gas-phase depolarization curve, in particular at long delay times. Since the exchange model underlying our data analysis assumes a stationary system, the two extracted parameters MXTC-F and MXTC-S would consequently underestimate their true values. Any regional perfusion variations could further complicate the situation through a potential modulation of the MXTC parameters with reduced perfusion resulting in more accurate but still different parameters than those for normal perfusion. The magnitude of this error depends on the value of the exchange time constant relative to the capillary transit time of the blood. Based on the literature, the alveolar capillary transit times in rabbits and humans are approximately 0.6 s (46) and 1 s (47), respectively. However, since the gas-exchange for sufficiently long delay times can be approximated by a mono-exponential recovery function for which we measured exchange time constants on the order of 20 ms or less, we believe that the amount of tagged dissolved-phase xenon spins that cannot exchange with the gas phase during the applied delay times is fairly small (≪ 10%). The resulting error is further reduced by the circumstance that only about 50% of the HXe129 is dissolved in the blood (plasma + RBC) with the remainder residing in the stationary lung tissue. Hence, at least in resting subjects with the literature-based capillary transit times, we anticipate any blood-flow related errors to be much smaller than the level of uncertainty in our measurements. 3) The value of the xenon diffusion constant within lung tissue was calculated based on the time constant, determined from spectroscopic measurements, for pulmonary HXe129 gas exchange in rabbits and literature values for the mean septal-wall thickness (20), with the underlying assumption of a homogeneous wall composition. However, lung structures consist of various components, such as collagen, elastin, fibroblasts, basement membranes, capillaries, etc., with relative composition that varies between species (45). Also, the association and disassociation of xenon atoms with hemoglobin molecules, which was neglected, will yield an effective diffusion constant that is lower than the true diffusion constant. Finally, the studies in (20) were performed in much smaller rabbits (∼ 3 kg) than those used in the present studies (∼ 5 kg). All of these factors may contribute to the apparent discrepancy in the septal-wall thickness results for rabbits. Therefore, the estimated diffusion constant we used can only serve to obtain a rough estimate of the mean septal-wall thickness and might not permit accurate inter-species comparisons. In the future, a more comprehensive assessment of the composite parenchymal structure can be achieved by using MXTC MRI to selectively encode contrast for the individual dissolved-phase resonances of red blood cells, plasma and tissue (13).
Morphometric parameters such as volume and surface densities in the lung strongly depend on inflation volume, and thus considering the inflation level at which a given study was performed is crucial when comparing results among studies. In future studies, absolute lung volumes, such as TLC, can be determined in a pulmonary function lab for each individual subject, while the absolute lung volume during imaging could be obtained by interleaving the MXTC MRI pulse sequence with a fast proton MRI acquisition, e.g., during the contrast generation period. Such data from proton MRI could also be used to register MXTC MRI data from different breath holds in order to reduce the uncertainty in parameter estimation.
The p-value map, which characterizes regional fitting quality (Fig. 2c, d), indicated that fitting quality was decreased in regions potentially affected by misregistration between breath holds (e.g., close to the diaphragm) and in regions of low SNR (in the center slices, due to the surface coil sensitivity profiles of the array RF coil). In future studies, misregistration errors could be addressed using the interleaved proton MRI approach mentioned above in combination with image registration algorithms. Further, the interleaved scheme would offer opportunities for acquisition optimization to improve SNR, e.g. by collecting multiple XTC contrast maps while continuously breathing HXe129.
One major limitation regarding the quality of fit assessment in our data is the absence of repeatability studies to estimate measurement error. The assumption employed in our data analysis, that in-plane variations are stochastically driven, is an upper bound for the measurement errors. Potentially lower measurement errors would result in reduced fit quality under the χ2-criterion. As a consequence, additional voxels would not meet the goodness of fit standards for the model and would be excluded.
Conclusions
MXTC MRI is an implementation of the XTC MRI technique in three dimensions and for multiple exchange times. Regional and dynamic encoding of the xenon exchange contrast enables the mapping of functional septal wall thickness in addition to the tissue to alveolar-volume ratio already derived from single exchange time XTC MRI. Our results of quantifying the microstructure deformation of healthy lung in response to gravity-induced tissue compression and variations in the lung inflation level demonstrate the feasibility of the MXTC MRI technique. Further, only structures participating in gas exchange are represented in the MXTC MRI data. Therefore MXTC-derived parameters describe a functional subset of the lung microstructure. Future studies will assess the potential sensitivity of the method to pathological alterations of the lung parenchyma that affect gas exchange.
Acknowledgments
The authors thank Jeremy Gatesman, LVT LATG and Gina Weimer, LVT LATG for their expert animal preparation and handling.
This work was supported by NIH grants R42 HL082013, R01 EB003202 and R01 HL079077, Siemens Medical Solutions, and the New Hampshire Innovation Research Center.
Grant Support: NIH grants R42 HL082013, R01 EB003202 and R01 HL079077, Siemens Medical Solutions, and New Hampshire Innovation Research Center
List of Symbols
- λ
lambda
- χ2
chi subscript 2
- μ
mu
- ±
plus minus
- τ
tau
- τc
tau subscript c
- Vt/Va
V subscript t / V subscript a
- Vt̃/Va
V subscript tilde t / V subscript a
- Va
V subscript a
- Vt̃
V subscript tilde over t
- °
degree
References
- 1.Happer W, Miron E, Schaefer S, Schreiber D, van Wijngaarden WA, Zeng X. Polarization of the nuclear spins of noble-gas atoms by spin exchange with optically pumped alkali-metal atoms. Phys Rev A. 1984;29(6):3092–3110. [Google Scholar]
- 2.Albert MS, Cates GD, Driehuys B, Happer W, Saam B, Springer CS, Wishnia A. Biological magnetic resonance imaging using laser-polarized 129Xe. Nature. 1994;370(6486):199–201. doi: 10.1038/370199a0. [DOI] [PubMed] [Google Scholar]
- 3.Kauczor HU, Hofmann D, Kreitner KF, Nilgens H, Surkau R, Heil W, Potthast A, Knopp MV, Otten EW, Thelen M. Normal and abnormal pulmonary ventilation: visualization at hyperpolarized He-3 MR imaging. Radiology. 1996;201(2):564–568. doi: 10.1148/radiology.201.2.8888259. [DOI] [PubMed] [Google Scholar]
- 4.Holmes JH, Korosec FR, Du J, O'Halloran RL, Sorkness RL, Grist TM, Kuhlman JE, Fain SB. Imaging of lung ventilation and respiratory dynamics in a single ventilation cycle using hyperpolarized He-3 MRI. J Magn Reson Imaging. 2007;26(3):630–6. doi: 10.1002/jmri.20965. [DOI] [PubMed] [Google Scholar]
- 5.Deninger AJ, Eberle B, Ebert M, Grossmann T, Heil W, Kauczor H, Lauer L, Markstaller K, Otten E, Schmiedeskamp J, Schreiber W, Surkau R, Thelen M, Weiler N. Quantification of regional intrapulmonary oxygen partial pressure evolution during apnea by 3He MRI. J Magn Reson. 1999;141(2):207–216. doi: 10.1006/jmre.1999.1902. [DOI] [PubMed] [Google Scholar]
- 6.Saam BT, Yablonskiy DA, Kodibagkar VD, Leawoods JC, Gierada DS, Cooper JD, Lefrak SS, Conradi MS. MR imaging of diffusion of 3He gas in healthy and diseased lungs. Magn Reson Med. 2000;44(2):174–179. doi: 10.1002/1522-2594(200008)44:2<174::aid-mrm2>3.0.co;2-4. [DOI] [PubMed] [Google Scholar]
- 7.Yablonskiy DA, Sukstanskii AL, Leawoods JC, Gierada DS, Bretthorst GL, Lefrak SS, Cooper JD, Conradi MS. Quantitative in vivo assessment of lung microstructure at the alveolar level with hyperpolarized 3He diffusion MRI. Proc Natl Acad Sci U S A. 2002;99(5):3111–3116. doi: 10.1073/pnas.052594699. [DOI] [PMC free article] [PubMed] [Google Scholar]
- 8.Salerno M, de Lange EE, Altes TA, Truwit JD, Brookeman JR, Mugler JP., 3rd Emphysema: hyperpolarized helium 3 diffusion MR imaging of the lungs compared with spirometric indexes–initial experience. Radiology. 2002;222(1):252–260. doi: 10.1148/radiol.2221001834. [DOI] [PubMed] [Google Scholar]
- 9.Goto T, Suwa K, Uezono S, Ichinose F, Uchiyama M, Morita S. The blood-gas partition coefficient of xenon may be lower than generally accepted. Br J Anaesth. 1998;80(2):255–256. doi: 10.1093/bja/80.2.255. [DOI] [PubMed] [Google Scholar]
- 10.Weathersby PK, Homer LD. Solubility of inert gases in biological fluids and tissues: a review. Undersea Biomed Res. 1980;7(4):277–296. [PubMed] [Google Scholar]
- 11.Swanson SD, Rosen MS, Coulter KP, Welsh RC, Chupp TE. Distribution and dynamics of laser-polarized 129Xe magnetization in vivo. Magn Reson Med. 1999;42(6):1137–45. doi: 10.1002/(sici)1522-2594(199912)42:6<1137::aid-mrm19>3.0.co;2-4. [DOI] [PubMed] [Google Scholar]
- 12.Ruppert K, Brookeman JR, Hagspiel KD, Driehuys B, Mugler JP., 3rd NMR of hyperpolarized 129Xe in the canine chest: spectral dynamics during a breath-hold. NMR in Biomedicine. 2000;13(4):220–8. doi: 10.1002/1099-1492(200006)13:4<220::aid-nbm638>3.0.co;2-f. [DOI] [PubMed] [Google Scholar]
- 13.Ruppert K, Chang Y, Altes TA, Dregely IM, Ketel S, Ruset I, Mata JF, Hersman FW, Mugler JP., 3rd Compartment-selective XTC MRI at 1.5T and 3T; Proceedings 17th Scientific Meeting ISMRM; Honolulu. 2009; p. 9. [Google Scholar]
- 14.Imai H, Kimura A, Ito T, Fujiwara H. Hyperpolarized 129Xe dynamic study in mouse lung under spontaneous respiration: application to murine tumor B16BL6 melanoma. Eur J Radiol. 2010;73(1):196–205. doi: 10.1016/j.ejrad.2008.09.033. [DOI] [PubMed] [Google Scholar]
- 15.Driehuys B, Cofer GP, Pollaro J, Mackel JB, Hedlund LW, Johnson GA. Imaging alveolar-capillary gas transfer using hyperpolarized 129Xe MRI. Proc Natl Acad Sci USA. 2006;103(48):18278–18283. doi: 10.1073/pnas.0608458103. [DOI] [PMC free article] [PubMed] [Google Scholar]
- 16.Muradian I, Patz S, Butler J, GP T, MI H, Covrig S, Ketel S, Ruset I, Hersman F. Hyperpolarized 129Xe human pulmonary gas exchange with 3-point Dixon technique; Proceedings 14th Scientific Meeting, ISMRM; 2006; p. 862. [Google Scholar]
- 17.Cleveland ZI, Cofer GP, Metz G, Beaver D, Nouls J, Kaushik SS, Kraft M, Wolber J, Kelly KT, McAdams HP, Driehuys B. Hyperpolarized 129Xe MR Imaging of Alveolar Gas Uptake in Humans. PLoS ONE. 2010;5(8):e12192. doi: 10.1371/journal.pone.0012192. [DOI] [PMC free article] [PubMed] [Google Scholar]
- 18.Mugler JP, 3rd, Altes TA, Ruset IC, Dregely IM, Mata JF, Miller GW, Ketel S, Ketel J, Hersman FW, Ruppert K. Simultaneous magnetic resonance imaging of ventilation distribution and gas uptake in the human lung using hyperpolarized xenon-129. Proc Natl Acad Sci USA. 2010;107(50):21707–21712. doi: 10.1073/pnas.1011912107. [DOI] [PMC free article] [PubMed] [Google Scholar]
- 19.Ruppert K, Brookeman J, Hagspiel K, Mugler JP., 3rd Probing lung physiology with xenon polarization transfer contrast (XTC) Magn Reson Med. 2000;44(3):349–357. doi: 10.1002/1522-2594(200009)44:3<349::aid-mrm2>3.0.co;2-j. [DOI] [PubMed] [Google Scholar]
- 20.Ruppert K, Mata JF, Brookeman JR, Hagspiel KD, Mugler JP., 3rd Exploring lung function with hyperpolarized 129Xe nuclear magnetic resonance. Magn Reson Med. 2004;51(4):676–687. doi: 10.1002/mrm.10736. [DOI] [PubMed] [Google Scholar]
- 21.Patz S, Muradian I, Hrovat M, Ruset I, Topulos G, Covrig S, Frederick E, Hatabu H, Hersman F, Butler J. Human pulmonary imaging and spectroscopy with hyperpolarized 129Xe at 0.2 T. Acad Radiol. 2008;15(6):713. doi: 10.1016/j.acra.2008.01.008. [DOI] [PMC free article] [PubMed] [Google Scholar]
- 22.Dregely I, Mugler JP, 3rd, Ruset IC, Altes TA, Mata JF, Miller GW, Ketel J, Ketel S, Distelbrink J, Hersman FW, Ruppert K. Hyperpolarized xenon-129 gas-exchange imaging of lung microstructure: first case studies in subjects with obstructive lung disease. J Magn Reson Imaging. doi: 10.1002/jmri.22533. in press. [DOI] [PMC free article] [PubMed] [Google Scholar]
- 23.Mansson S, Wolber J, Driehuys B, Wollmer P, Golman K. Characterization of diffusing capacity and perfusion of the rat lung in a lipopolysaccaride disease model using hyperpolarized 129Xe. Magn Reson Med. 2003;50(6):1170–1179. doi: 10.1002/mrm.10649. [DOI] [PubMed] [Google Scholar]
- 24.Dregely IM, Wiggins GC, Ruset IC, Brackett J, Ketel S, Distelbrink J, Alagappan V, Mareyam A, Potthast A, Polimeni JR, Wald LL, Altes TA, Mugler JP, 3rd, Hersman FW. A 32 channel phased array lung coil for parallel imaging with hyperpolarized xenon 129 at 3T; Proceedings 17th Scientific Meeting ISMRM; Honolulu. 2009; p. 4918. [Google Scholar]
- 25.Hersman FW, Ketel J, Ruset I, Ketel S, Dregely I, Porter W, Watt D, Mugler JP, 3rd, Altes TA, Ruppert K, Mata JF, Patz S, Habatu H, Hrovat MI, Muradian I, Dabaghyan M, Miller G, Wang C, Butler J, Distelbrink J. First results from clinical sitings of a high production prototype xenon polarizer; Proceedings 18th Scientific Meeting, ISMRM; Stockholm. 2010; p. 4598. [Google Scholar]
- 26.Hrovat M, Muradian I, Frederick E, Butler J, Hatabu H, Patz S. Theoretical model for XTC (Xenon Transfer Contrast) experiments with hyperpolarized 129Xe; Proceedings 18th Scientific Meeting, ISMRM; Stockholm. 2010; p. 2556. [Google Scholar]
- 27.Griswold MA, Jakob PM, Heidemann RM, Nittka M, Jellus V, Wang J, Kiefer B, Haase A. Generalized autocalibrating partially parallel acquisitions (GRAPPA) Magn Reson Med. 2002;47(6):1202–1210. doi: 10.1002/mrm.10171. [DOI] [PubMed] [Google Scholar]
- 28.Stocks J, Quanjer PH. Reference values for residual volume, functional residual capacity and total lung capacity. ATS Workshop on Lung Volume Measurements. Official Statement of The European Respiratory Society. Eur Respir J. 1995;8(3):492–506. doi: 10.1183/09031936.95.08030492. [DOI] [PubMed] [Google Scholar]
- 29.West B, Matthews L. Stresses, strains, in the lung and surface pressures caused by its weight. J Appl Physiol. 1972;32(3) doi: 10.1152/jappl.1972.32.3.332. [DOI] [PubMed] [Google Scholar]
- 30.Hopkins SR, Henderson AC, Levin DL, Yamada K, Arai T, Buxton RB, Prisk GK. Vertical gradients in regional lung density and perfusion in the supine human lung: the Slinky effect. J Appl Physiol. 2007;103(1):240–248. doi: 10.1152/japplphysiol.01289.2006. [DOI] [PMC free article] [PubMed] [Google Scholar]
- 31.Millar AB, Denison DM. Vertical gradients of lung density in healthy supine men. Thorax. 1989;44(6):485–490. doi: 10.1136/thx.44.6.485. [DOI] [PMC free article] [PubMed] [Google Scholar]
- 32.Almquist HM, Palmer J, Jonson B, Wollmer P. Pulmonary perfusion and density gradients in healthy volunteers. J Nucl Med. 1997;38(6):962–966. [PubMed] [Google Scholar]
- 33.Petersson J, Rohdin M, Sánchez-Crespo A, Nyrén S, Jacobsson H, Larsson SA, Lindahl SGE, Linnarsson D, Neradilek B, Polissar NL, Glenny RW, Mure M. Posture primarily affects lung tissue distribution with minor effect on blood flow and ventilation. Respir Physiol Neurobiol. 2007;156(3):293–303. doi: 10.1016/j.resp.2006.11.001. [DOI] [PubMed] [Google Scholar]
- 34.Brudin LH, Rhodes CG, Valind SO, Wollmer P, Hughes JM. Regional lung density and blood volume in nonsmoking and smoking subjects measured by PET. J Appl Physiol. 1987;63(4):1324–1334. doi: 10.1152/jappl.1987.63.4.1324. [DOI] [PubMed] [Google Scholar]
- 35.O'Halloran RL, Holmes JH, Wu YC, Alexander A, Fain SB. Helium-3 MR q-space imaging with radial acquisition and iterative highly constrained back-projection. Magn Reson Med. 2010;63(1):41–50. doi: 10.1002/mrm.22158. [DOI] [PMC free article] [PubMed] [Google Scholar]
- 36.Fichele S, Woodhouse N, Swift AJ, Said Z, Paley MNJ, Kasuboski L, Mills GH, van Beek EJR, Wild JM. MRI of helium-3 gas in healthy lungs: posture related variations of alveolar size. J Magn Reson Imaging. 2004;20(2):331–335. doi: 10.1002/jmri.20104. [DOI] [PubMed] [Google Scholar]
- 37.Evans A, McCormack D, Ouriadov A, Etemad-Rezai R, Santyr G, Parraga G. Anatomical distribution of 3He apparent diffusion coefficients in severe chronic obstructive pulmonary disease. J Magn Reson Imaging. 2007;26(6):1537–47. doi: 10.1002/jmri.21205. [DOI] [PubMed] [Google Scholar]
- 38.Davidson JT, Wasserman K, Lillington GA, Schmidt RW. Effect of aging on respiratory mechanics and gas exchange in rabbits. J Appl Physiol. 1966;21(3):837–842. doi: 10.1152/jappl.1966.21.3.837. [DOI] [PubMed] [Google Scholar]
- 39.Carney DE, Bredenberg CE, Schiller HJ, Picone AL, McCann UG, Gatto LA, Bailey G, Fillinger M, Nieman GF. The Mechanism of Lung Volume Change during Mechanical Ventilation. Am J Resp Care Med. 1999;160:1697–1702. [PubMed] [Google Scholar]
- 40.Weibel ER. Design and Morphometry of the Pulmonary Gas Exchanger. In: Crystal RG, editor. The lung: scientific foundations. Philadelphia: Lippincott-Raven; 1997. pp. 1147–1157. [Google Scholar]
- 41.Knudsen L, Weibel ER, Gundersen HJG, Weinstein FV, Ochs M. Assessment of air space size characteristics by intercept (chord) measurement: an accurate and efficient stereological approach. J Appl Physiol. 2010;108(2):412–421. doi: 10.1152/japplphysiol.01100.2009. [DOI] [PubMed] [Google Scholar]
- 42.Coxson HO, Mayo JR, Behzad H, Moore BJ, Verburgt LM, Staples CA, Pare PD, Hogg JC. Measurement of lung expansion with computed tomography and comparison with quantitative histology. J Appl Physiol. 1995;79(5):1525–1530. doi: 10.1152/jappl.1995.79.5.1525. [DOI] [PubMed] [Google Scholar]
- 43.Coxson HO, Rogers RM, Whittall KP, Dyachkova Y, Paré PD, Sciurba FC, Hogg JC. A quantification of the lung surface area in emphysema using computed tomography. Am J Respir Crit Care Med. 1999;159(3):851–6. doi: 10.1164/ajrccm.159.3.9805067. [DOI] [PubMed] [Google Scholar]
- 44.West JB. Respiratory Physiology: The Essentials. 8th. Lippincott Williams & Wilkins; 2008. [Google Scholar]
- 45.Mercer RR, Russell ML, Crapo JD. Alveolar septal structure in different species. J Appl Physiol. 1994;77(3):1060–6. doi: 10.1152/jappl.1994.77.3.1060. [DOI] [PubMed] [Google Scholar]
- 46.Wang PM, Yang QH, Lai-Fook SJ. Effect of positive airway pressure on capillary transit time in rabbit lung. J Appl Physiol. 1990;69(6):2262–2268. doi: 10.1152/jappl.1990.69.6.2262. [DOI] [PubMed] [Google Scholar]
- 47.Hogg JC, Coxson HO, Brumwell ML, Beyers N, Doerschuk CM, MacNee W, Wiggs BR. Erythrocyte and polymorphonuclear cell transit time and concentration in human pulmonary capillaries. J Appl Physiol. 1994;77(4):1795–1800. doi: 10.1152/jappl.1994.77.4.1795. [DOI] [PubMed] [Google Scholar]