

Abstract
Silver is a strong antibiotic that is increasingly incorporated into consumer products as a bulk, salt, or nanosilver, thus potentially causing side-effects related to human exposure. However, the fate and behavior of (nano)silver in the human body is presently not well understood. In order to aggregate the existing experimental information, a physiologically based pharmacokinetic model (PBPK) was developed in this study for ionic silver and nanosilver. The structure of the model was established on the basis of toxicokinetic data from intravenous studies. The number of calibrated parameters was minimized in order to enhance the predictive capability of the model. We validated the model structure for both silver forms by reproducing exposure conditions (dermal, oral, and inhalation) of in vivo experiments and comparing simulated and experimentally assessed organ concentrations. Therefore, the percutaneous, intestinal, or pulmonary absorption fraction was estimated based on the blood silver concentration of the respective experimental data set. In all of the cases examined, the model could successfully predict the biodistribution of ionic silver and 15–150 nm silver nanoparticles, which were not coated with substances designed to prolong the circulatory time (eg, polyethylene glycol). Furthermore, the results of our model indicate that: (1) within the application domain of our model, the particle size and coating had a minor influence on the biodistribution; (2) in vivo, it is more likely that silver nanoparticles are directly stored as insoluble salt particles than dissolve into Ag+; and (3) compartments of the mononuclear phagocytic system play a minor role in exposure levels that are relevant for human consumers. We also give an example of how the model can be used in exposure and risk assessments based on five different exposure scenarios, namely dietary intake, use of three separate consumer products, and occupational exposure.
Keywords: nanosilver, human exposure, biodistribution, PBPK model, risk assessment, toxicokinetics
Introduction
Silver is a white, lustrous metallic element that is known to be used by humans since ancient times. It is utilized in a broad range of applications, such as jewelry, cutlery, monetary currency, dental fillings, photography, or explosives.1 Nowadays, the main field of application is in the electrical and electronic industry, followed by silver brazing and soldering.2 However, silver is better known for its application as an effective antibiotic agent in various products.3–5 Recently, it has become popular to incorporate silver in its nanoform into products such as cosmetics, textiles, food boxes, sprays, wound dressings, etc, and today nanoparticulate silver is the most common nanomaterial found in consumer products.4,6–10 Another, rather exotic, though relevant, exposure source is by means of the oral and dermal administration of ionic and nanoparticulate silver as a “universal remedy”.11,12 The legally required registration of these products as drugs is usually avoided by selling them as dietary supplements that are “very beneficial to human health”.13
Although ionic and nanoparticulate silver are used in numerous applications, reports on their adverse health effects are actually very scarce and almost all concluded only acute effects caused by short-term exposure to very high doses.1,14 Sole exceptions are argyria and argyrosis, which are blue-grey discolorations of the skin and eyes, respectively. Both conditions are caused by the exposure to a single high dose of silver15 or to continuous low doses of silver for several months or even years.11,12,16 The blue-grey color is caused by granulates composed of insoluble silver salts (eg, silver sulfide, silver selenide), which are deposited in the dermis and cornea.14 Argyria and argyrosis are permanent conditions with no known effective therapy. However, besides the psychological effects induced by the change of appearance,17 argyria is thought not to be harmful and it is controversial whether argyrosis is associated with visual impairment.14,16
Aside from the deposition of silver in the dermis and cornea, the effects of silver at the cellular level are of interest. While the exact mechanisms are unknown, through bacteria studies it is known that (nano)silver interacts with multiple sites in the cell.5 Two points on cytotoxicity of silver may be highlighted. Firstly, it is not completely clear whether the dissolved silver ions or the particulate form interacts with cell components, although it is suspected that the unique physicochemical properties of silver nanoparticles (NPs) lead to yet unknown adverse health effects,1 such as the “Trojan Horse” effect.18 Secondly, (nano)silver may cause adverse effects by the generation of reactive oxygen species (ROS) and through the interaction with the thiol groups of proteins.1 However, the mammalian cell also possesses several defense mechanisms to render generated ROS harmless. These so called antioxidants include compounds of an enzymatic (eg, superoxide dismutases, catalases, glutathione [GSH] peroxidase) and a non-enzymatic (eg, α-Tocopherol, carotenoids, melatonin) nature.19,20
Due to the increased usage of (nano)silver and concerns regarding its toxic effects, there is a rising need for a health risk assessment on the exposure to (nano)silver. At the moment information on consumer and occupational exposure, as well as of toxicokinetic (TK) and toxicological data for exposure levels that are relevant for consumers is lacking, which limits our ability to construct risk assessments.21 Physiologically based pharmacokinetic (PBPK) modeling provides a good method to structure the available information and data, put them into context, and provide insight into the relationships between an external dose and internal organ, blood or excretion dose.22 On these grounds, PBPK models are increasingly used in a variety of risk assessments.22 Yet, for metals and NPs, only a small number of models have been developed. Since the early 1990s, PBPK models had been developed for five potentially toxic metals: arsenic, chromium, lead, nickel, and zinc.23 More recently, PBPK models for NPs have been published for carbon,24 poly(lactic-co-glycolic) acid (PLGA),25 silver,26 and quantum dots.27 However, with the exception of the model for PLGA NPs, no PBPK model could successfully be validated against independent data.
In light of all this, we have developed a PBPK model for humans that comprises two sub-models, one for ionic silver and one for silver NPs (in the following denoted as “nanosilver”), with the aim of determining organ specific silver levels from external doses. Based on this dual approach we make it possible to evaluate and compare different exposure routes both for ionic silver and nanosilver. In order to ensure the reliability of the developed model, we have validated both sub-models with independent data from the literature. Finally, on the basis of five exposure scenarios (dietary intake, use of three separate consumer products, and occupational exposure), we will present how our PBPK models can be used for exposure and risk assessments.
Methods
The ionic silver and nanosilver PBPK model structures were based on mechanistic consideration of the underlying pharmacokinetic processes. The basic concept of the couplings and dependencies between the PBPK sub-models is shown in Figure 1. The established compartment model structures were then calibrated with empirical data from available TK studies. With this approach it was possible to reduce the number of calibration parameters to the absolute minimum required and hence achieve optimum use of the available TK data. In particular, the limited data on nanosilver made this approach necessary and prevented the development of a full mechanistic model. Finally, the PBPK models were validated with independent data and used to compare human exposure to ionic silver and nanosilver via different routes.
Figure 1.
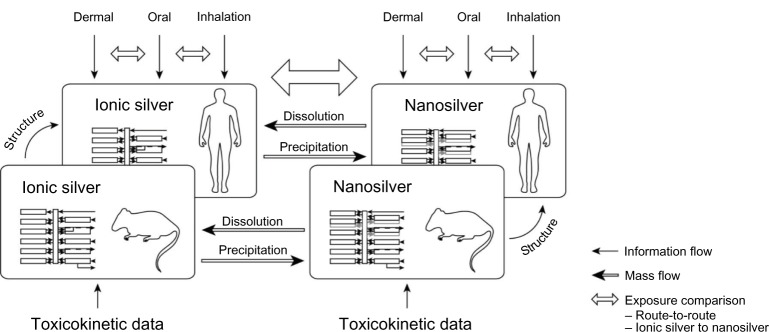
Basic concept of couplings and dependencies between the different PBPK models.
Abbreviation: PBPK, physiologically based pharmacokinetic.
For the development and application of the PBPK models, as much as possible, we followed the guidelines of the harmonization project of the International Programme on Chemical Safety (IPCS).22 In these guidelines, general assumptions for PBPK models are listed. In addition, we made two specific assumptions for nanosilver (all model assumptions are available in the supplementary materials): (1) Silver NPs are discretely distributed in 1 nm steps (Figure S1); and (2) distribution of NPs in the blood stream is size-independent.
The structure of our PBPK models (Figure 2A and B) was based on the available knowledge on the disposition of ionic silver and nanosilver within the rat and human. A detailed explanation on the implemented mechanisms of absorption, distribution, metabolism and excretion (ADME) is given below for each of the four processes separately. However, some general aspects apply for all processes, silver forms, humans, and rats and shall be described in this subchapter.
Figure 2.
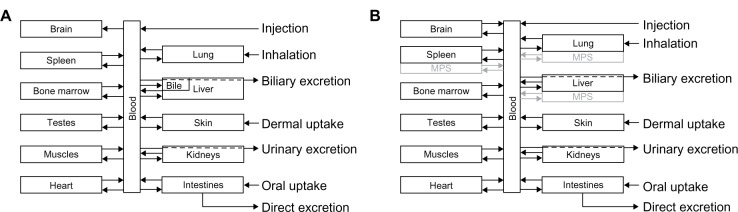
Schematic diagram of the PBPK model structures for (A) ionic and (B) nanoparticulate silver, which were used both for rats and humans.
Note: In the ionic silver model no transport of silver from the brain to the blood was modeled, to consider the blood–brain barrier.
Abbreviations: MPS, mononuclear phagocyte system; PBPK, physiologically based pharmacokinetic.
To keep the models as simple as possible, ADME of ionic silver and nanosilver in the human and rat models were assumed to follow first-order kinetics, as is common for PBPK models.23 Hence, the following equation was used to describe the disposition of (nano)silver (if not indicated otherwise, a full list of all model equations is available in the supplementary materials):
| [1] |
where AAg_com_1(2) (μg) is the total mass of silver in compartment 1 and 2, respectively, k12 (min−1) is the kinetic transfer rate from compartment 1 to 2, while k21 (min−1) is the kinetic transfer rate from compartment 2 to 1.
As recommended by Li et al25 the PBPK models were designed as membrane-limited models. In order to reduce the complexity of the models, transfer functions have been developed for the uptake rates of (nano)silver from the blood to the organs. These were based on organ-specific characteristics (ie, glutathione concentration, capillary wall type, phagocytosis efficiency). For the transport from the organ to the blood, the same release rate for all organs was used. With this approach, the number of model parameters was limited and over-parameterization of the PBPK models was prevented. For the brain and testes, smaller uptake and/or release rates were usually used in comparison to the other organs, to model the blood–brain and the blood–testes barriers, respectively.
Once the model structure was set up, the distribution, metabolism and excretion rates were calibrated with in vivo kinetic data for intravenously injected (nano)silver. TK data for extravascular administrated (nano)silver (eg, oral, subcutaneous, etc) was not considered. Data from Klaassen28 and Lankveld et al26 was used for the ionic silver and nanosilver rat model, respectively. However, exceptions were made if there was a lack of information in these two studies or better data were available for individual rates. These exceptions are highlighted in the respective subchapters.
In order to obtain comparable and consistent results for the ionic silver PBPK model, the usage of experimental data was limited to easily soluble silver species, namely silver nitrate and silver acetate, and ionic silver solutions. A rat body weight of 300 g was used for the rat PBPK models, because this is the mean body weight in both in vivo studies that were used to calibrate the PBPK models. For the human PBPK model and for the presentation of the risk assessment concept we limited all calculations to the International Commission on Radiological Protection (ICRP) reference adult man.29 Since generally no gender-specific and age-specific data are available for model parameters of the transfer functions (ie, glutathione concentration, capillary wall type, phagocytosis efficiency), separate calculations for women and younger age groups were not carried out.
Also, the sole gender-related differences that have been reported are increased silver levels in the kidneys of female rats compared with male rats after exposure to nanosilver.30–32 These differences were deliberately not included into the model, because a sound physiologically-based explanation has not been given, hence introducing an extra kinetic factor into the PBPK model cannot be justified. Possible explanations for increased silver levels in female rat kidneys may be gender differences in the hormonal regulation or the basement structure of the kidney.33
A full list of physiological parameters and the determined absorption, distribution, metabolism and excretion rates, along with the associated equations, are summarized in the supplementary materials. The parameterization approach of the kinetic rates for the ionic silver and nanosilver rat PBPK model can also be found in the supplementary materials.
In the following section, the different absorption models that were implemented in our PBPK models will be described. Afterwards, the mechanistic considerations on the kinetics of ionic silver and nanosilver that form the basis of distribution, metabolism, and excretion in the models will be explained.
Absorption
The dermal and oral absorption of ionic silver and nanosilver are both based on the European Chemicals Agency (ECHA) models available.34 Both models are relatively simple and rely on experimentally determined percutaneous and intestinal absorption fractions. For nanosilver, in all experiments, only the amount of silver that penetrated through the cell layer was determined, but never the chemical composition or the presence of nanostructures. Therefore, we assumed in our model that all particles can pass the epidermis and intestinal wall and end up in the blood circulation. A detailed explanation and discussion on available absorption fractions for humans and rats can be found in the supplementary materials.
For the inhalation of particles the more sophisticated ICRP model was used.35 In this model, a size-dependent deposition in five different lung compartments is considered, as well as movement/clearance processes between these compartments and the gastrointestinal (GI)-tract. The movement/clearance rates were determined from an in vivo study on rats for silver NPs.36 The complete inhalation model, together with the description on the determination of the absorption rates and the implementation into the PBPK models, is available in the supplementary materials.
In general, percutaneous, intestinal and pulmonary absorption fractions are lacking in the literature. Hence, whenever we used independent data to validate the human or rat PBPK models, we had to determine the absorption fractions with our PBPK models. Therefore, the absorption factor was fitted to result in equal blood silver levels of the in vivo data and the model. If the blood silver level was not available, another organ silver level was used for the fit. The determined intestinal absorption fractions and pulmonary absorption rates are listed in the supplementary materials (Table S7 and Table S8, respectively).
Distribution
Next, with respect to its role as an antioxidant, GSH also plays a major role in the biodistribution of ionic silver. This behavior can most likely be attributed to the fact that silver ions preferably form complexes with sulfhydryl groups, and in many cells GSH represents by far the most common low-molecular-weight mercaptan and also the largest pool of soluble mercaptans.20,37–39 Given the large complex formation constant between ionic silver and GSH, the organ silver uptake was defined as being proportional to the relative organ GSH concentration, hence reducing the number of model parameters. Thus, the ionic silver uptake rate korgan_up_ionic (min−1) from blood to the respective organs was calculated according to the following equation:
| [2] |
where bionic (min−1) is the ionic uptake constant (calibrated with data from Klaassen28), morgan (g) is the organ weight, Corgan_GSH (μmol/g) is the GSH concentration in the organ, mb.w. (g) is the body weight, and Cbody_GSH (μmol/g) is the mean GSH concentration in the body.
The organ release rate for rats was calibrated with data from Klaassen.28 For humans it was fitted to result in the reported silver half-life of 15 days in the human liver.40
Nanoparticulate silver uptake was modeled on the basis of the ability of NPs to cross the capillary wall of the organs and to be phagocytosed in the mononuclear phagocyte system (MPS).41 Both pathways were modeled simultaneously by introducing separate compartments for the MPS in lung, liver and spleen (Figure 2B). It should be pointed out that the uptake/accumulation of particles by the MPS increases with higher nanosilver concentration in the blood.31 The possible reasons for this behavior will be discussed later.
For the transcapillary pathway, the organs were grouped according to their capillary wall type (CT). In total, four CT groups were formed (adapted from Sarin,42 see also Table S3):
CT1: non-sinusoidal non-fenestrated blood capillary type (ie, brain, heart, lung, muscles);
CT2: non-sinusoidal fenestrated blood capillary type (ie, intestines, kidneys, skin, testes);
CT3: sinusoidal blood capillary type with pores larger than 15 nm (ie, liver, spleen); and
CT4: myeloid bone marrow sinusoidal blood capillary type (ie, bone marrow).
Apart from depending on the CT group, the uptake was also assumed to be proportional to the amount of silver that passes the capillary walls of the organ. Thus, the transcapillary organ uptake rate korgan_up_nano_cap (min−1) from the blood circulation was calculated according to the following equation:
| [3] |
where bnano_cap (-) is the nanoparticulate uptake constant (which depends on the CT and was calibrated with data from Lankveld et al26), Qorgan_blood (L/minute) is the amount of blood that flows through the organ, and Vblood (L) is the total body blood volume. The organ blood flow normalized to the total blood volume describes the amount of NPs that are transported to the capillaries of the organ per minute in relation to the total amount of NPs in the blood.
No experimental data is available for the bone marrow, but it is known that the capillary walls of bone marrow clear xenobiotics from the blood circulation at a high rate by endocytosis processes42 and it has already been shown for other NPs that they accumulate in the bone marrow at high concentrations.43–45 Therefore, it was assumed that all particles that are not taken up by other organs or are excreted are absorbed by the bone marrow.
The second nanoparticulate distribution pathway was based on the uptake of NPs by the MPS. The MPS comprises phagocytic cells, which are located in reticular connective tissue (eg, Kupffer cells, alveolar and splenic macrophages).46 The phagocytosis efficiency of these macrophages is dependent on the size of the particles and increases until a maximum phagocytosis efficiency is reached at around 2 to 3 μm.47,48 This size-dependency can also be seen in the study of Lankveld et al.26 Hence, the MPS uptake rate korgan_up_nano_MPS (min−1) from the blood circulation was calculated according to the following quadratic equation:
| [4] |
where bnano_MPS_1 (nm−2) is the first MPS uptake constant, bnano_MPS_2 (nm−1) is the second MPS uptake constant (both uptake constants calibrated with data from Lankveld et al26), d (nm) is the particle diameter, Qorgan_blood (L/minute) is the amount of blood that flows through the organ, and Vblood (L) is the total blood volume.
The organ release rate of nanosilver for rats was calibrated with data from Lankveld et al.26 For humans, the same ratio between the rat and human organ release rates was assumed as for the ionic silver PBPK model (transcapillary and MPS), since detailed human TK data is missing. As mentioned above, data for bone marrow is very scarce and considering that the monocytes are formed and occur in the bone marrow in high numbers the same release rate was used as for the MPS.
Metabolism
A simplified metabolism scheme has been used for ionic silver (Figure 3). Based on the idea that the interaction of soluble silver species with mercaptans leads to the formation of silver sulfide39 and the fact that mainly silver sulfide (partly silver selenide) is detected in tissue samples after exposure to ionic silver,14,49,50 it was assumed that soluble silver species are slowly transformed to silver sulfide. For the general population, it is known that less than 0.5 g of silver is stored in the human body within a lifetime.40 In extreme cases, however, up to 100 g of silver can be stored in the human body.11,51,52 Therefore, it can be expected that under normal exposure conditions no organ reaches saturation in a lifetime. Due to these considerations, a storage compartment was implemented for each organ (except blood), which represents the deposited silver sulfide. These storage compartments were modeled as sink compartments from which no silver is released and which have infinite storage capacity. The total storage of ionic silver in the rat’s body was set to 0.5%, which is a conservative assumption based on experimental results after intravenous injection of an ionic silver solution.53
Figure 3.

Metabolism of ionic silver and nanosilver and the connection between the PBPK models. For the fate of silver nanoparticles two scenarios were considered: (1) dissolution, and (2) direct storage as silver sulfide.
Abbreviation: PBPK, physiologically based pharmacokinetic.
Two possible scenarios were considered for the metabolism of nanosilver (Figure 3): (1) silver NPs dissolve and release soluble silver species, which are then transferred to the ionic silver PBPK model, and (2) silver NPs are directly transformed to silver sulfide particles. Both cases have been described under controlled laboratory conditions in vitro,54,55 but exact in vivo behavior remains unknown. Scenario 2 is further supported from our own evaluations (supplementary materials) and from the detection of NPs, also as agglomerates, in the organs of rats exposed to NPs that partly consist of sulfur and selenium.31,49 Hence, if not mentioned otherwise, a direct storage was used for the calculations. When scenario 1 was used for the calculations, realistic dissolution rates were taken from the literature. In Figure 1, the implementation of particle dissolution in the PBPK model for scenario 1 and the dependencies between the ionic silver and nanosilver PBPK models is shown (a more detailed illustration can be found in the supplementary materials; Figures S1 and S2).
For the human PBPK model the same ionic and nanoparticulate storage rates were used as the ones determined for the rat PBPK model. Since, comparable to the rat, in all human organs mercaptans are much more abundant than silver, we assumed that silver sulfide formation is not dependent on mercaptan concentrations and takes place at the same rate in rats and humans.
For the metabolization of silver in the skin compartment, a slightly different approach had to be used. Based on reports of an increased storage of silver in human skin,11,12,56 especially in sun-exposed areas, the human skin storage rate was determined separately. The increased storage was explained by Danscher57 as a consequence of ultraviolet light exposure that causes a photoreduction of silver chloride to metallic silver, which then is oxidized by surrounding tissue and then transformed to silver sulfide. For the ionic PBPK model, the increased human skin storage rate was determined by calibrating the rate to a value at which the skin permanently stores 3.2 μg/g silver58 (lowest concentration found in an argyria case) after an intravenous injection of 1.84 g silver11,15 (lowest dose found that causes argyria). Data from silver arsphenamine was used in this case, because data on silver nitrate or another ionic silver solution is not available. Likewise, no specific data is available for nanosilver. Therefore, the same skin storage factor was also used for nanosilver. Studies that describe the development of argyria in rats were not available. Hence, in the rat PBPK models the same storage rate for the skin compartment was used as for all other organ compartments.
Excretion
Next, with respect to the distribution of ionic silver, GSH also plays a major role in the excretion of silver, which happens via the biliary route as a silver-GSH complex.59,60 Therefore, it can be assumed that further metabolization of silver in the liver will not occur. Based on this consideration, in the PBPK models the biliary and urinary excreted silver was directly removed from the blood compartment. Most of the (nano)silver excretion rates of the model are very small and, therefore, the amount of silver in the bile and urine is negligible. However, for the biliary excretion of ionic silver a sub-compartment had to be added to the liver to consider the large amounts of silver that are present in bile (Figure 2A). Note that this extra sub-compartment has no silver sulfide storage compartment and has the same uptake and release rates as the liver, respectively.
We assumed that the biliary excretion of silver-glutathione complexes is an endocytosis process that is comparable to the endocytosis of nanosilver. Hence, the organ blood flow normalized to the total blood volume was used to extrapolate from rats to humans (equation 3). For the urinary excretion of silver a nine times lower rate was used than for the biliary excretion.61
Since it was also assumed that endocytosis processes are size-independent, even for the biliary excretion process, the same biliary excretion rates were used for nanosilver and ionic silver in the rat and in the human PBPK models. The same was done for the urinary excretion rates of both models, since no specific information was available.
Exposure and risk assessment
The PBPK models were used to compare and assess several realistic exposure scenarios to ionic silver and nanosilver. In general, it was assumed that products are used daily at worst case concentrations and, hence, silver release/uptake did not decrease with time. The five exposure scenarios comprised the dietary uptake (diet),9 the oral uptake of silver NPs released from food boxes (food box),8 the dermal uptake of silver NPs released from T-shirts (T-shirt),62 the oral uptake of emitted silver NPs from a throat spray (throat spray),6 and occupational exposure conditions were reconstructed from biomonitoring data (silver worker).63 As input for the exposure and risk assessment we used all reported size fractions that were at least partly within nano-range.
Results
Our PBPK models were validated against published TK data for ionic silver and nanosilver in both rats and humans. Absorption fractions and rates were fitted to the respective data sets, such that the absorption part of the models cannot be validated. However, it was still possible to validate the distribution, metabolization, and excretion parts of the models; the model structure. Validation of the model structure was possible by comparing the time course of modeled silver levels in the various organs to experimental values. The exposure conditions of the respective experimental studies were used as input parameters to our models as much as possible. Whenever the information on the exposure conditions was incomplete, assumptions were made.
Rat PBPK models
In vivo data from rats exposed to ionic silver and nanosilver via their diet was compared with our model results (Figure 4). The modeled silver levels are generally in line with the reported in vivo data. However, due to the fact that the model was calibrated with data from male rats, the predicted kidney silver levels for female rats are generally lower by approximately a factor of two when compared to in vivo data. It is also apparent from the data of Kim et al31 (Figure 4A) that especially the kidney silver level of female rats is increasing in a non-linear manner with the administrated dose, which is not reflected in the model.
Figure 4.

Comparison of the PBPK model simulations to toxicokinetic data of rats after oral exposure for 28 days.
Notes: (A) 30 (a), 300 (b), and 1000 (c) mg/kg/day 60 (52.7–70.9) nm particles,31 (B) 12.6 mg/kg/day 14 ± 2 nm particles (11% ionic fraction),49 and (C) 9 mg/kg/day silver acetate49 without (a) and with (b) consideration of the formation of nanoparticles in the GI-tract. Light grey: female rats; dark grey: male rats; black: nanosilver; white: ionic silver; *intestinal absorption fractions were fitted to match blood silver levels (listed in Table S7); °transformation of soluble silver salts to silver nanoparticles within the digestive tract. Error bars represent standard deviations; n = 5 to n = 10. Data from31,49.
Abbreviations: PBPK, physiologically based pharmacokinetic; NP, nanoparticle; Ag, silver; GI, gastrointestinal.
Figure 4A also shows that the nanosilver uptake rates in organs that are part of the MPS are increasing with the blood silver level. For the low, middle and high-dose group MPS uptake rates (equation 4) 0%, 25%, and 100% of the original rate (determined from Lankveld et al26) respectively, were deduced by comparison with the data of Kim et al.31 This means that below a blood silver concentration of 180 ng/g the nanosilver uptake in the MPS compartments is negligible.
Two points should be highlighted from the comparison with the data of Loeschner et al.49 Firstly, although the muscles were not used to calibrate the model, the silver levels in the muscles fit very well (Figure 4B), which indicates that the transfer functions based on the capillary wall type for determining the organ uptake rates are applicable. Secondly, as shown in Figure 4C (“without NP formation”), the simulation for 100% ionic uptake after oral administration of silver acetate is not reflected in the in vivo data. However, it was recently shown that soluble silver salts are transformed to silver NPs, consisting of metallic silver, silver sulfide, and silver chloride, within an in vitro human GI digestion model.64 Therefore, we have also assumed the precipitation of NPs in the digestive tract and carried out a simulation with a mixture of 33% ionic silver and 67% nanosilver (the ratio was estimated based on the results of Walczak et al64). As can be seen in Figure 4C (“with NP formation”) the simulation results for the model that considers precipitation of particles in the digestive tract are much closer to the in vivo data.
In Figure 5, a comparison of PBPK model simulations with in vivo data from rats after exposure to NPs in air (A, B) and intratracheal instillation of silver nitrate (C) are summarized. The data of Takenaka et al36 were used to calibrate the rat respiratory clearance model (Figure 5A, highlighted by the asterisks of the lung silver levels in the “Immediately” and “Day 7” group; further information can be found in the supplementary materials). In all cases, the model predicted well experimental organ silver levels. The only exception was for “Day 1” in Figure 5A, where the model underestimates most of the organ silver levels. An explanation for this could be the delayed movement of silver from lymph nodes (surrounding the lung) to the blood. As shown by Takenaka et al,36 these lymph nodes also take up small amounts of the inhaled silver.
Figure 5.

Comparison of the PBPK models to toxicokinetic data of rats after inhalation or instillation of silver.
Notes: (A) (a-d) Exposure once for 6 hours to 133 μg/m3 14.6 ± 1.0 nm particles.36 (B) Exposure 6 hours/day and 5 days/week for 28 days to 61.24 μg/m3 14.77 ± 0.11 nm particles.65 (C) Intratracheal instillation of 7.0 μg AgNO3.36 Light grey: female rats; dark grey: male rats; black: nanosilver; white: ionic silver. *Pulmonary absorption fractions were fitted to match blood/liver silver levels (listed in Table S8), pulmonary clearance fractions were calibrated to match lung silver levels (listed in Table S8). Error bars represent standard deviations; n = 4 or n = 5. Data from36,65.
Abbreviations: LOD, below limit of detection; ND, not determined by the authors; PBPK, physiologically based pharmacokinetic.
Another finding is that although an uptake of NPs via the olfactory nerve is not considered in the model, the brain silver levels are slightly overestimated in the short-term exposure scenario in Figure 5A. On the contrary, for the 28 days exposure study of Ji et al,65 the brain levels are slightly underestimated by the nanosilver PBPK model (Figure 5B).
In Figure 5C, silver levels after intratracheal instillation of silver nitrate are depicted.36 Since the authors reported the total organ silver content instead of concentrations, the weight of a rat was set to 175 g in accordance to the specifications in the paper. For the respiratory clearance the same model was used as for nanosilver, which probably explains slight differences in the lung silver levels. The silver absorbed by the blood was assumed to be in ionic form. With this approach very good results were obtained for silver levels in the liver.
Excretion rates were compared to data from rats that received intravenous injections of 1 mg/kg 7.9 nm silver particles.66 It was reported that 9.0% ± 13.8% and 0.08% ± 0.14% (mean ± standard deviation) of the silver were excreted in the feces and urine within the first 24 hours, respectively (assuming that with a body weight of 300 g, 18 g feces, and 33 mL urine are excreted per day). The size of the particles is not in the application domain of our model for NPs (which is 15 to 150 nm), but it was shown for gold NPs that the biliary clearance is practically identical for 5, 18, and 80 nm large particles within the first 24 hours.67 Therefore, we simulated the exposure conditions reported by Park et al66 with our model and obtained comparable results, namely a biliary and urinary excretion of 13.0% and 0.18%, respectively. Different results, however, were reported for the same exposure duration by Dziendzikowska et al,68 who measured a biliary and urinary excretion far below 0.01% and 0.1% of the intravenously injected 5 mg/kg 20 nm silver particles within the first 24 hours, respectively.
Human PBPK models
Simulation results from our human PBPK models were compared to published human toxicokinetic and biomonitoring data (Figure 6). In Figure 6A, the ionic PBPK model is compared to the reference organ silver levels of the USA, which were derived from 18 to 102 deceased individuals (exact number depends on the organ).40 Assuming that the examined persons had an average age of 60 years, the average daily intake that we could derive with our model is 10.2 μg silver. This value is within the range of reported intake rates (1–90 μg).2,9 From Figure 6A it can also be observed that our model is in good agreement with experimental data for the skin and brain. We can therefore say that for both of these compartments, the assumption of increased storage and no silver release seems to be appropriate. The results also support our model assumption, that the formation of nanoparticles in the digestive tract64 plays no role at such low intake rates.
Figure 6.
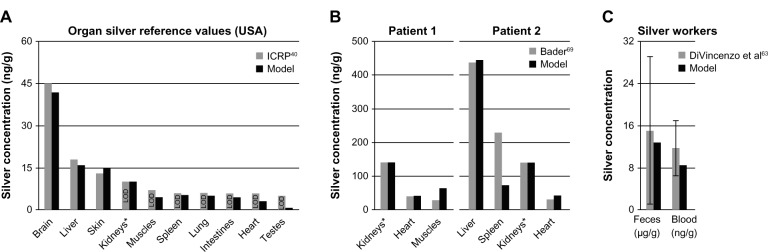
Comparison of the PBPK models to human toxicokinetic and biomonitoring data.
Notes: (A) Organ silver reference values of the USA,40 (B) organ silver levels of deceased burn victims treated with silver nitrate,69 and (C) biomonitoring data from worker occupationally exposed to silver in air.63 *Dietary intake (A) and dermal absorption fractions (B) were fitted to match kidney’s silver levels. Error bars represent standard deviations; n = 25 to n = 30. Data from40,63,69.
Abbreviations: ICRP, International Commission on Radiological Protection; LOD, limit of detection; PBPK, physiologically based pharmacokinetic.
In Figure 6B, organ silver levels of two burn victims are shown, who died during or shortly after having been treated with silver nitrate.69 Patient 1 had burns over 20% of his body and was treated for 30 days. Two weeks after the therapy was discontinued the patient died. Patient 2 had burns over 96% of his body and silver nitrate dressings were applied continuously until the patient died one week after hospitalization. In total, it was estimated by our model that 14.1 mg and 3.9 mg of silver were dermally absorbed by patient 1 and patient 2, respectively. The much higher uptake by patient 1 can be explained by the longer treatment duration.
Finally, we also attempted to reproduce the exposure conditions reported from a factory where photosensitized products were being manufactured (Figure 6C). The reported silver concentrations in air ranged from 10 to 100 μg/m3.63 For our calculations, we used a mean value of 55 μg/m3 and an exposure time of 8 hours a day and 5 days a week. However, the lack of information on the particle size distribution and chemical composition made it difficult to make certain assumptions. Nevertheless, a sensitivity analysis for particle size revealed that for our parameterization of the silver uptake into the blood circulation the size of the particles is of minor importance. This size-independence can be attributed to the storage process, which is much faster than most of the size-dependent mucociliary clearance processes of the ICRP model.35 For the occupational scenario, a particle size of 15 nm was used, which was also used to determine the pulmonary absorption rate. As can be seen in Figure 6C, after exposure to 15 nm particles for 6 months (steady-state), the silver levels in the blood and feces fit very well with the biomonitoring data.
The more recently published biomonitoring study on silver workers by Lee et al70 could not be used for the validation of our model, since the reported silver levels in the blood did not exceed background levels in blood that can result from dietary intake.61
In Figure 7A and B, the time course of the biodistribution of ionic silver and nanosilver in the human body is illustrated for organs with concentrations higher than 2 ng/g, respectively. For both ionic silver and nanosilver the liver, kidney and spleen are among the most important uptake organs. Specifically, the accumulation of ionic silver in the brain and the clearance of large amounts of nanosilver from the blood circulation by the bone marrow are of particular interest. In our model, 3.2% and 8.3% of the absorbed ionic silver and nanosilver (without considering the MPS compartments) is stored in the human body, respectively.
Figure 7.
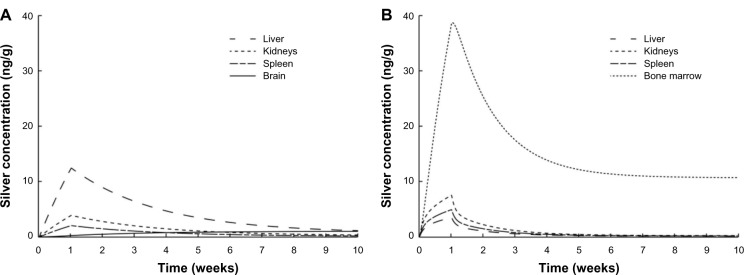
Comparison of the silver biodistribution with the human PBPK models.
Notes: It was assumed that 15 μg silver are released directly to the blood stream during 1-week (eg, from catheter). (A) Release of ionic silver. (B) Release of silver nanoparticles.
Abbreviation: PBPK, physiologically based pharmacokinetic.
For the ionic silver and nanosilver human PBPK model a sensitivity analysis was performed, the data from which can be found in the supplementary materials.
For nanosilver, the sensitivity of organ silver levels to the dissolution rate was also evaluated (see supplementary materials). For simulations with dissolution, it was assumed that the NPs are releasing silver ions. The biodistribution of the released ions was then simulated with our ionic PBPK model. If a dissolution of more than 1 nm/day is considered in the PBPK model, the silver level in the liver increases considerably, since the liver is rich in glutathione that can bind to ionic silver. Also, organs that only take up very small amounts of nanosilver, such as the heart, show a large increase in the organ silver levels, if dissolution is assumed. A comparison of this result with in vivo data is very difficult, due to the limited number of studies that evaluated the biodistribution of particles together with control groups exposed to soluble silver salts. However, the results of the available studies clearly show different distribution patterns between NPs and silver salts.49,71 Since such different distribution patterns can only be described by our model if no dissolution of NPs is considered, we usually used a direct storage of NPs in our simulations.
Exposure and risk assessment
For the selected exposure scenarios we calculated the human organ silver levels with the help of our models. These scenarios are dietary intake, use of three consumer products, and occupational exposure. The results are depicted in Figure 8. The levels represent steady-state conditions, which in the model are reached after approximately 6 months. It should be noted that these levels include only soluble silver species in the organs. Insoluble silver species, eg, silver sulfide, were not considered because their contribution to the toxicity is negligible (except for argyria). For ionic silver and nanosilver similar adverse effect levels have been reported in vitro72–75 and in vivo.50,76 Therefore, ionic silver and nanosilver organ levels can be compared to the same no observed effect level, which is indicated by the grey-shaded area in Figure 8.
Figure 8.

Calculated silver levels in human tissues without insoluble silver species using our PBPK models.
Notes: The scenarios above (A–K) exposure under a variety of conditions in different organs. Diet: dietary intake of 90 μg ionic silver per day. Food box: oral intake of 4.2 μg silver nanoparticles per day released from a commercially available food box. T-shirt: dermal exposure to 363 μg silver nanoparticles per day (for 0.5 hours) released from a commercially available T-shirt into 120 mL (artificial) alkaline sweat. Throat spray: inhalation of silver nanoparticles released from a commercially available colloidal silver throat spray. Daily inhaled silver dose was assumed to be 556 ng, which results from ten spray actions. Silver worker: silver worker exposed to 15 nm particles in air. The concentration in air was set to 55 μg per m3. The exposure scenario was calculated for 8 hours a day and 5 days a week for a worker who is doing light exercise and breathes through the mouth. Grey-shaded areas indicate silver levels where adverse effects have been reported in vitro. Light grey: sporadic reports. Dark grey: repeated reports. (Arranged on the basis of the dietary organ silver level: from high to low.)
Abbreviation: PBPK, physiologically based pharmacokinetic.
For the use of nanosilver containing consumer products (ie, food box, T-shirt, and throat spray), the soluble silver levels of all organs were at least lower by a factor of 10 than levels where adverse effects have been reported in vitro.74,77,78 The relative importance of consumer products for (nano)silver exposure can also be derived from the comparison to the exposure from dietary intake (background exposure to silver). The dietary intake was used, since, according to the US-environmental protection agency (EPA), the doses of our dietary scenario (90 μg/day ionic silver intake by adults) are below levels of health concern for short-term and long-term exposure.9,79 For all consumer products that we assessed, most organ levels were clearly below the dietary background level. Only the silver levels in bone marrow for all cases and in the lung for the case “throat spray” were in the same order of magnitude or exceeded the dietary background level, respectively.
The same exposure conditions were used for the occupationally exposed worker as for the biomonitoring study from Figure 6C. As can be seen in Figure 8, the organ silver levels are much higher than for all consumer product scenarios, and generally higher than the dietary background level. The lung and bone marrow silver concentrations are at levels for which adverse effects in in vitro studies have been reported. To evaluate the likelihood of developing argyria, we also calculated the total skin silver concentration with insoluble silver species. Under the same exposure conditions a worker would have a skin silver concentration of 1.32 μg/g after 40 years of occupational exposure. In contrast, 3.2 μg/g was the lowest concentration found in the literature that was reported to cause argyria.58
Discussion
The aim of this project was to develop PBPK models for ionic silver and nanosilver that can be used for assessing the dose from a wide range of exposure scenarios. It is essential for a broad application domain, that mechanistic information is reflected in the model structures and that the number of parameters is consistent with the number of underlying data points.22
Through our comparison to independent data, we showed that although the model structures are relatively simple, the models are valid for different exposure scenarios, different particle sizes, and different particle coatings. However, for nanosilver, the application domain of 15 to 150 nm has to be observed. Also for some coatings the model is not applicable (further discussed in subchapter “Distribution”).
Absorption
After oral administration of nanosilver, we determined intestinal absorption fractions between 0.12% and 0.88%. These absorption fractions are in good agreement with the results of Bouwmeester et al80 who measured a translocation of silver nanoparticles (20 and 30 nm) between 0.19% and 0.62%, in an in vitro intestinal epithelium coculture model for a duration of 4 hours. For ionic silver an absorption fraction of approximately 5% was reported for rats,53 which is also in line with our 3.25% for silver acetate in rats. A comparison with in vitro determined intestinal absorption fractions of soluble silver (eg, by Bouwmeester et al80) is not possible because of the formation of NPs in the GI-tract.64
No experimental uptake rates are available for pulmonary absorption; therefore, we compared our fitted absorption fractions to the concentrations that are needed to cause argyria after pulmonary and intestinal uptake. As reviewed by Holler et al,2 the oral dose to cause argyria may be up to 3.75 times higher than the inhalation dose. This is reflected in our fitted absorption fractions of 20.1% for inhalation (from Ji et al65) compared to 3.25% for oral uptake (see above).
Distribution and excretion
The disposition of nanosilver was reasonably well described by our model for polyvinylpyrrolidone (PVP)49 and carboxymethyl cellulose (CMC)31 coated particles as well as for pure particles36 and silver alloy particles.65 These results show that the particle surface charge and coating are of minor importance for the nanosilver distribution in the organs. This finding may be explained by opsonization: any (silver) NP that is taken up by a mammalian organism is immediately binding proteins to its surface.81 The so formed “protein corona” stabilizes the particles64,82,83 and determines their biodistribution and clearance from the blood.84 The “protein corona” has a very similar composition among different kinds of metallic NPs81,85 and, as suggested by our model, a stronger influence on the biodistribution than the particle coating. Hence, silver NPs that are coated with substances designed to alter opsonization, such as polysorbate 8084 or polyethylene glycol (PEG),86 are not covered by our model.
The biodistribution was reasonably well described for 15, 20, 60, 80, and 110 nm sized silver particles, although a size-dependent particle uptake was only implemented for compartments of the MPS. From this finding, we deduce that size plays a minor role for the transport efficiency of silver NPs through the capillary wall. The physiological properties of the capillaries are defining the particle size range in which the distribution is size-independent, and, therefore the limits of our model. The lower size limit (15 nm) is defined by the pore size of the kidneys42 and the upper size limit (150 nm) by the pore size of the liver,42 the clathrin-mediated endocytosis pathway,87 and the bone marrow uptake.43 Outside this size range, it has to be expected that the uptake rate of one or more organs is altered; for example, the direct passage of very small NPs (<15 nm) through the pores of the organ blood capillaries. In fact, the lower and higher size limits might be slightly lower, due to the formation of a “protein corona” in vivo and, hence, increased particle diameter.88 The size-independence of the biodistribution in non-MPS organs between 15 and 150 nm can also be seen in other in vivo studies (the uptake/accumulation of organs of the MPS may differ between different sizes and structures of NPs).67,71,89,90 Contrasting these studies, there are also reports that show a diverging biodistribution of particles that were in the size range of our nanosilver PBPK model,91,92 indicating that there might be other factors influencing the biodistribution. However, in these two studies, the biodistribution was evaluated after external exposure (inhalation and oral) and the deviating results might be caused by different uptake kinetics of different particle sizes.
Our nanosilver PBPK model is only valid within the application domain of 15 to 150 nm. For particles below or above the defined size range it must be expected that the TKs are different than described by our model, which is supported by several in vivo studies that used silver particle sizes below 15 nm50,66,93 and above 150 nm.68
As mentioned above, good results were obtained with a size-independent uptake of nanosilver via the capillaries of the organs, whereas a size-dependent particle uptake had to be implemented for the MPS compartments of the lung, liver, and spleen. However, by comparing our PBPK model with in vivo data, it can be seen that this approach is only valid for a blood silver concentration larger than 180 ng/g. Below this concentration, the uptake by the MPS compartments is of minor importance for all particle sizes. There are several possible explanations for this observation, namely: (1) macrophages are able to dissolve low amounts of nanosilver instantaneously and only accumulate high amounts of nanosilver; (2) above this threshold, the conditions in the blood (eg, pH, ionic strength) promote the agglomeration of silver NPs,94 and are subsequently cleared from the blood stream by the MPS; and, (3) below this threshold, the MPS is not activated by nanosilver in the blood. However, the results of our model show that if the nanosilver dissolved in the MPS as described in explanation (1), the largest fraction of the dissolved silver would be transported to the liver (see also supplementary materials). Since correspondingly high concentrations in the liver have never been reported, we conclude that the dissolution of nanosilver is less likely than a threshold concentration for the uptake, either due to agglomeration of the particles in the blood or activation of the MPS. This finding of a threshold concentration is very interesting, considering the fact that under realistic exposure conditions (consumer products and occupational limits), the blood silver levels are at least one order of magnitude below this threshold. This also means that in TK experiments, where this threshold is clearly exceeded (eg, Dziendzikowska et al68), the MPS may completely alter the disposition of the nanosilver in the body.
In most in vivo studies the recovery of silver is low. In studies where the nanosilver was intravenously administered, the fraction of silver that could be recovered from the organs and fecal and urine excretion is usually in the range of less than 1% to 55%.26,68,93 On the contrary, after injecting intravenously 1 and 10 mg/kg of 7.9 nm silver NPs, Park et al66 recovered 180% and 700% of silver, respectively, from the liver alone. The authors did not discuss reasons for these high recoveries. All studies commonly only evaluated a limited number of organs and/or excretion routes, which makes it difficult to evaluate and determine the biodistribution. The highest recovery rate was reported by Lankveld et al,26 but taking into account that after one day only 13% to 55% of the injected silver was recovered from the organs, 45% to 87% of the silver particles must have been distributed elsewhere. Unfortunately, the feces and urine silver content was not evaluated, but based on results of other in vivo studies the possibility that significant amounts of the particles were excreted in the feces or urine can be excluded.66,67,93,95 Studies with polystyrene and iron oxide NPs showed that the bone marrow plays an important role in the clearance of NPs.43–45 Therefore, for our nanosilver PBPK models we assumed that NPs are cleared from the blood by the bone marrow. Nevertheless, the possibility that the small recovery in the study by Lankveld et al26 is due to, for example, absorption of NPs into the wall of the storage bottle and, hence, a lower injected dose is realized or due to the distribution of the particles in other parts of the body cannot be excluded. The only part of the body that was repeatedly reported to take up NPs and which was not covered in any study (and consequently not in our model, since the organ uptake transfer function cannot be applied) is the lymphatic system. However, the lymphatic system is probably of minor importance, because NPs that are absorbed in local lymphatic vessels are transported via the thoracic duct back to the systemic blood circulation.81
Metabolism
With our PBPK models, we demonstrated that no significant dissolution of silver NPs to silver ions takes place in vivo (even when the MPS is considered; see supplementary materials). This may be attributed to two factors: the first factor is the stabilization of particles by proteins, which are adsorbed on the particle surface. Second, it was already shown that macrophages can transform bulk silver to silver-sulfur nanocrystals,96,97 which makes it unlikely that particles become completely dissolved and are released as silver ions by macrophages. However, there are two model limitations that could bias our evaluation of the particle dissolution in vivo. First, it cannot be excluded that by calibrating the nanosilver PBPK model with data from Lankveld et al26 some kind of dissolution was unintentionally included into the model. Second, because our ionic PBPK model was calibrated with data after the intravenous injection of a ionic silver solution,28 we can only model silver ions that are able to freely distribute within the body. Hence, it is out of the application domain of the model, if, for example, the particle dissolution occurs intracellularly and the dissolved silver is directly transformed to silver sulfide within the cell (eg, in macrophages).
Interestingly, the determined ionic silver storage rate is practically identical with the nanosilver storage rate for the non-MPS system. This finding can probably be explained by very similar storage processes of ionic silver and nanosilver. In fact, after exposing rats orally to soluble silver salts and NPs, nanosized granules could be detected in the animals of both groups.49,50 This behavior can also be seen with argyria, where the precipitated granulates in the skin all have a similar appearance, mostly in the micrometer range, irrespective if metallic silver,98 ionic silver,99 or colloidal silver/nanosilver11,12 was taken up. Unfortunately, the data on the chemical composition of these particles is very limited, but Loeschner et al49 could measure sulfur and selenium in the precipitated granulates. These measurements prove that the particles react with sulfur and selenium in vivo. The sulfidation process leads to, at least in vitro, an extensive decrease in the dissolution rate and toxicity and causes the formation of nanobridges between the NPs.100,101 Sulfidation, next to opsonization, is another process that has the potential to stabilize the particles in vivo. However, in vivo opsonization and sulfidation probably happen in parallel. What is yet unknown is if the sulfidation processes happen spontaneously or if they are triggered or enhanced, for example by intracellular digestion of particles by macrophages.
One limitation of the PBPK models is that it was assumed that the storage compartment is a perfect sink. In reality, the precipitated silver sulfide is very slowly dissolving and even the blue-grey discoloration of the skin can decline slowly.102 This means that the model is most likely overestimating the amount of stored silver. For most organs this overestimation is of minor importance, because the soluble silver concentration marks the most important toxicological endpoint. It might only become relevant for the assessment of stored silver in the skin, which as an endpoint results in argyria. However, although the storage rate is overestimated by our model, the daily ionic silver dose that has to be taken in orally within 70 years in order to develop argyria is still higher in our model than the levels suggested by the US-EPA,79 namely 25.6 and 14.0 μg/kg/day, respectively.
Exposure and risk assessment
We used our PBPK model to calculate the internal organ silver levels on the basis of five different exposure scenarios for humans (diet, food box, T-shirt, throat spray, and silver worker). In all consumer product scenarios, the silver levels of all organs were around or below the dietary background (except the lung silver level after the usage of the colloidal silver throat spray), which indicates that for adults the risk of adverse health effects from exposure to nanosilver in consumer products is very small. For the risk assessment, we compared directly the ionic silver and nanosilver organ levels with each other. As discussed above, this approach was based on reports of similar adverse effects after exposure to the same amount of ionic silver or nanosilver.50,73,75,76 However, the advantage of our PBPK models is that new evidence on the impact of, for example, size and surface composition on the toxic response of an organ can easily be incorporated into the models by introducing factors that can express the toxicity compared to ionic silver (eg, comparable to the toxic equivalency quotient for dioxins).
In the “silver worker” scenario, the soluble silver levels in different organs exceeded the background levels by a large margin; the silver in bone marrow and the lung was clearly above levels where adverse effects have been reported in vitro.73,77 In addition, it has to be considered that the maximum admissible concentration for silver NPs in many countries is 100 μg/m3,103 which is nearly twice as high as in our scenario. Hence, the results of our PBPK model indicate that occupational exposure to silver NPs may induce adverse health effects even for exposures below the legal limit. These findings are in line with the results of Bachand et al,104 who reported that silver NP levels at the workplace may be high enough to trigger a significant inflammatory response in the alveolar epithelium.
In the exposure assessment, large uncertainties arise from the limited knowledge on the silver form that is released from the consumer products and the amount of released silver that is absorbed to the systemic blood circulation (eg, size distribution, coating/corona, chemical composition, agglomeration/aggregation state). For the “T-shirt” and “food box” scenarios, the size-specific information on the amount of NPs released from the products is limited.8,62 In our exposure assessment we therefore made some conservative assumptions on the amount of nanosilver that is released (ie, all released particles were on the nanoscale) and absorbed (ie, all sizes and coatings are taken up equally). However, it is, for example, known that the skin absorbs small particles better than larger ones, which may be due to the width of the intercellular space of the stratum corneum (around 100 nm) and the dimensions of the hair follicles.105,106 Hence, the determined organ silver levels of the exposure scenarios might be slightly overestimated. Nevertheless, due to the fact that nanosilver is increasingly incorporated in products in contact with the skin, such as in textiles and cosmetics, more data on the released silver form and percutaneous absorption is desirable.9,10
Conclusion
The following mechanistic insights were obtained by the aggregation of existing information into PBPK models: (1) by combining the ionic and nanoparticulate PBPK models it was possible to show that the dissolution of silver NPs outside of cells does not occur in vivo and if particles dissolve within the cell, it is likely that the dissolved silver ions are transformed intracellularly to insoluble silver species; (2) below the threshold concentration of 180 ng silver per gram of blood, the uptake of nanosilver by the MPS compartments is negligible for realistic human exposure like in the investigated scenarios; many animal studies, however, are conducted with doses above this threshold; and, (3) most coatings do not influence nanosilver biodistribution, which might be attributed to opsonization.
In all consumer exposure scenarios that have been evaluated with our PBPK models, most organs had silver levels that were clearly below levels for which adverse effects have been reported in vitro. Also, in our comparative assessment, most organs had silver levels below or around the background silver levels of dietary intake. This indicates that the risk for adults from nanosilver in consumer products is small. However, in an occupational setting several organs may reach levels where adverse health effects have to be feared. The most critical route of exposure is inhalation.
The following experimental studies would help to further increase the reliability of our models: (1) in vitro determination of the pulmonary and intestinal absorption fraction of ionic silver and nanosilver of different sizes, coatings and concentrations; (2) investigations into the disposition of nanosilver that could not be recovered in the in vivo studies; (3) the storage kinetics of ionic silver and nanosilver, including the influence of macrophages; (4) the transport efficiency of nanosilver of rat blood capillaries compared to human blood capillaries; and, (5) the TKs of silver NPs that are smaller than 15 nm.
Acknowledgments
The study was supported by funding from the Swiss Federal Office of Public Health (FOPH).
Footnotes
Disclosure
The authors report no conflicts of interest in this work.
References
- 1.Chen X, Schluesener HJ. Nanosilver: a nanoproduct in medical application. Toxicol Lett. 2008;176(1):1–12. doi: 10.1016/j.toxlet.2007.10.004. [DOI] [PubMed] [Google Scholar]
- 2.Holler JS, Nordberg GF . Silver. In: Nordberg GF, Fowler BA, Nordberg M, Friberg LT, editors. Handbook on the Toxicology of Metals. 3rd ed. Burlington: Academic Press; 2007. pp. 809–814. [Google Scholar]
- 3.Fox CL. Silver sulfadiazine – a new topical therapy for Pseudomonas in burns. Therapy of Pseudomonas infection in burns. Arch Surg. 1968;96(2):184–188. doi: 10.1001/archsurg.1968.01330200022004. [DOI] [PubMed] [Google Scholar]
- 4.Yin HQ, Langford R, Burrell RE. Comparative evaluation of the antimicrobial activity of ACTICOAT antimicrobial barrier dressing. J Burn Care Rehabil. 1999;20(3):195–200. doi: 10.1097/00004630-199905000-00006. [DOI] [PubMed] [Google Scholar]
- 5.Chaloupka K, Malam Y, Seifalian AM. Nanosilver as a new generation of nanoproduct in biomedical applications. Trends Biotechnol. 2010;28(11):580–588. doi: 10.1016/j.tibtech.2010.07.006. [DOI] [PubMed] [Google Scholar]
- 6.Quadros ME, Marr LC. Silver nanoparticles and total aerosols emitted by nanotechnology-related consumer spray products. Environ Sci Technol. 2011;45(24):10713–10719. doi: 10.1021/es202770m. [DOI] [PubMed] [Google Scholar]
- 7.Lorenz C, Windler L, von Goetz N, et al. Characterization of silver release from commercially available functional (nano)textiles. Chemosphere. 2012;89(7):817–824. doi: 10.1016/j.chemosphere.2012.04.063. [DOI] [PubMed] [Google Scholar]
- 8.von Goetz N, Fabricius L, Glaus R, Weitbrecht V, Günther D, Hungerbühler K. Migration of silver from commercial plastic food containers and implications for consumer exposure assessment. Food Addit Contam Part A Chem Anal Control Expo Risk Assess. 2013;30(3):612–620. doi: 10.1080/19440049.2012.762693. [DOI] [PubMed] [Google Scholar]
- 9.Wijnhoven SWP, Peijnenburg WJGM, Herberts CA, et al. Nano-silver: a review of available data and knowledge gaps in human and environmental risk assessment. Nanotoxicology. 2009;3(2):109–138. [Google Scholar]
- 10.Project on Emerging Nanotechnologies [homepage on the Internet] Consumer product analysis [updated March 14, 2011] Available from: http://www.nanotechproject.org/inventories/consumer/analysis_draft/Accessed March 21, 2013
- 11.Wadhera A, Fung M. Systemic argyria associated with ingestion of colloidal silver. Dermatol Online J. 2005;11(1):12. [PubMed] [Google Scholar]
- 12.Chang AL, Khosravi V, Egbert B. A case of argyria after colloidal silver ingestion. J Cutan Pathol. 2006;33(12):809–811. doi: 10.1111/j.1600-0560.2006.00557.x. [DOI] [PubMed] [Google Scholar]
- 13.Fairvital [homepage on the Internet] Colloidales silber 15 ml 500 ppm non-ionic [updated not specified] Available from: http://www.fairvital.com/product_info.php?products_id=77Accessed March 21, 2013
- 14.US Public Health Service ATSDR Toxicological profile for silver Atlanta: Agency for Toxic Substances and Disease Registry; 1990Available from: http://www.atsdr.cdc.gov/toxprofiles/tp146.pdfAccessed June 17, 2013 [PubMed] [Google Scholar]
- 15.Gaul LE, Staud AH. Clinical spectroscopy: seventy cases of generalized argyrosis following organic and colloidal silver medication, including a biospectrometric analysis of ten cases. JAMA. 1935;104(16):1387–1390. [Google Scholar]
- 16.Pala G, Fronterré A, Scafa F, et al. Ocular argyrosis in a silver craftsman. J Occup Health. 2008;50(6):521–524. doi: 10.1539/joh.n8001. [DOI] [PubMed] [Google Scholar]
- 17.Rosemary J.[homepage on the Internet]Rosemary’s story [updated January 22, 2013] Available from: http://www.rosemaryjacobs.comAccessed May 21, 2013
- 18.Kreuter J. Influence of the surface properties on nanoparticle-mediated transport of drugs to the brain. J Nanosci Nanotechnol. 2004;4(5):484–488. doi: 10.1166/jnn.2003.077. [DOI] [PubMed] [Google Scholar]
- 19.Tan DX, Manchester LC, Terron MP, Flores LJ, Reiter RJ. One molecule, many derivatives: a never-ending interaction of melatonin with reactive oxygen and nitrogen species? J Pineal Res. 2007;42(1):28–42. doi: 10.1111/j.1600-079X.2006.00407.x. [DOI] [PubMed] [Google Scholar]
- 20.Sies H. Oxidative stress: oxidants and antioxidants. Exp Physiol. 1997;82(2):291–295. doi: 10.1113/expphysiol.1997.sp004024. [DOI] [PubMed] [Google Scholar]
- 21.Christensen FM, Johnston HJ, Stone V, et al. Nano-silver – feasibility and challenges for human health risk assessment based on open literature. Nanotoxicology. 2010;4(3):284–295. doi: 10.3109/17435391003690549. [DOI] [PubMed] [Google Scholar]
- 22.IPCS The harmonization project document series no 9: Guidance on principles of characterizing and applying PBPK models in risk assessment. WHO Library Cataloguing-in-Publication Data: International Programme on Chemical Safety. 2010.
- 23.Reddy MB, Yang RSH, Clewell HJ, III, Andersen ME. Physiologically based pharmacokinetic modeling: Science and applications. Hoboken: John Wiley & Sons; 2005. [Google Scholar]
- 24.Péry AR, Brochot C, Hoet PH, Nemmar A, Bois FY. Development of a physiologically based kinetic model for 99m-technetium-labelled carbon nanoparticles inhaled by humans. Inhal Toxicol. 2009;21(13):1099–1107. doi: 10.3109/08958370902748542. [DOI] [PubMed] [Google Scholar]
- 25.Li M, Panagi Z, Avgoustakis K, Reineke J. Physiologically based pharmacokinetic modeling of PLGA nanoparticles with varied mPEG content. Int J Nanomedicine. 2012;7:1345–1356. doi: 10.2147/IJN.S23758. [DOI] [PMC free article] [PubMed] [Google Scholar]
- 26.Lankveld DP, Oomen AG, Krystek P, et al. The kinetics of the tissue distribution of silver nanoparticles of different sizes. Biomaterials. 2010;31(32):8350–8361. doi: 10.1016/j.biomaterials.2010.07.045. [DOI] [PubMed] [Google Scholar]
- 27.Lee HA, Leavens TL, Mason SE, Monteiro-Riviere NA, Riviere JE. Comparison of quantum dot biodistribution with a blood-flow-limited physiologically based pharmacokinetic model. Nano Lett. 2009;9(2):794–799. doi: 10.1021/nl803481q. [DOI] [PubMed] [Google Scholar]
- 28.Klaassen CD. Biliary excretion of silver in the rat, rabbit, and dog. Toxicol Appl Pharmacol. 1979;50(1):49–55. doi: 10.1016/0041-008x(79)90491-5. [DOI] [PubMed] [Google Scholar]
- 29.ICRP Basic anatomical and physiological data for use in radiological protection: reference values. A report of age- and gender-related differences in the anatomical and physiological characteristics of reference individuals. ICRP Publication 89. Ann ICRP. 2002;32(3–4):5–265. [PubMed] [Google Scholar]
- 30.Sung JH, Ji JH, Yoon JU, et al. Lung function changes in Sprague-Dawley rats after prolonged inhalation exposure to silver nanoparticles. Inhal Toxicol. 2008;20(6):567–574. doi: 10.1080/08958370701874671. [DOI] [PubMed] [Google Scholar]
- 31.Kim YS, Kim JS, Cho HS, et al. Twenty-eight-day oral toxicity, genotoxicity, and gender-related tissue distribution of silver nanoparticles in Sprague-Dawley rats. Inhal Toxicol. 2008;20(6):575–583. doi: 10.1080/08958370701874663. [DOI] [PubMed] [Google Scholar]
- 32.Xue Y, Zhang S, Huang Y, et al. Acute toxic effects and gender-related biokinetics of silver nanoparticles following an intravenous injection in mice. J Appl Toxicol. 2012;32(11):890–899. doi: 10.1002/jat.2742. [DOI] [PubMed] [Google Scholar]
- 33.Kim WY, Kim J, Park JD, Ryu HY, Yu IJ. Histological study of gender differences in accumulation of silver nanoparticles in kidneys of Fischer 344 rats. J Toxicol Environ Health Part A. 2009;72(21–22):1279–1284. doi: 10.1080/15287390903212287. [DOI] [PubMed] [Google Scholar]
- 34.ECHA . Guidance on information requirements and chemical safety assessment: Chapter R15: Consumer exposure estimation. Helsinki: European Chemicals Agency; 2010. [Google Scholar]
- 35.ICRP Human respiratory tract model for radiological protection. A report of a Task Group of the International Commission on Radiological Protection. Ann ICRP. 1994;24(1–3):1–482. [PubMed] [Google Scholar]
- 36.Takenaka S, Karg E, Roth C, et al. Pulmonary and systemic distribution of inhaled ultrafine silver particles in rats. Environ Health Perspect. 2001;109(Suppl 4):547–551. doi: 10.1289/ehp.01109s4547. [DOI] [PMC free article] [PubMed] [Google Scholar]
- 37.Hansen RE, Roth D, Winther JR. Quantifying the global cellular thiol-disulfide status. Proc Natl Acad Sci U S A. 2009;106(2):422–427. doi: 10.1073/pnas.0812149106. [DOI] [PMC free article] [PubMed] [Google Scholar]
- 38.Isab AA, Wazeer MI. Synthesis and characterization of thiolate-Ag(I) complexes by solid-state and solution NMR and their antimicrobial activity. Spectrochim Acta A Mol Biomol Spectrosc. 2007;66(2):364–370. doi: 10.1016/j.saa.2006.03.007. [DOI] [PubMed] [Google Scholar]
- 39.Bell RA, Kramer JR. Structural chemistry and geochemistry of silver-sulfur compounds: Critical review. Environ Toxicol Chem. 1999;18(1):9–22. [Google Scholar]
- 40.ICRP Report of Committee II on permissible dose for internal radiation (1959) Annals of the ICRP/ICRP Publication. 1960;2:1–40. [Google Scholar]
- 41.Brandenberger C, Mühlfeld C, Ali Z, et al. Quantitative evaluation of cellular uptake and trafficking of plain and polyethylene glycol-coated gold nanoparticles. Small. 2010;6(15):1669–1678. doi: 10.1002/smll.201000528. [DOI] [PubMed] [Google Scholar]
- 42.Sarin H. Physiologic upper limits of pore size of different blood capillary types and another perspective on the dual pore theory of microvascular permeability. J Angiogenes Res. 2010;2:14. doi: 10.1186/2040-2384-2-14. [DOI] [PMC free article] [PubMed] [Google Scholar]
- 43.Davis SS, Illum L, Moghimi SM, et al. Microspheres for targeting drugs to specific body sites. J Control Release. 1993;24(1–3):157–163. [Google Scholar]
- 44.Illum L, Davis SS. Targeting of colloidal particles to the bone marrow. Life Sci. 1987;40(16):1553–1560. doi: 10.1016/0024-3205(87)90120-2. [DOI] [PubMed] [Google Scholar]
- 45.Daldrup HE, Link TM, Blasius S, et al. Monitoring radiation-induced changes in bone marrow histopathology with ultra-small superparamagnetic iron oxide (USPIO)-enhanced MRI. J Magn Reson Imaging. 1999;9(5):643–652. doi: 10.1002/(sici)1522-2586(199905)9:5<643::aid-jmri5>3.0.co;2-a. [DOI] [PubMed] [Google Scholar]
- 46.van Furth R, Cohn ZA, Hirsch JG, Humphrey JH, Spector WG, Langevoort HL. The mononuclear phagocyte system: a new classification of macrophages, monocytes, and their precursor cells. Bull World Health Organ. 1972;46(6):845–852. [PMC free article] [PubMed] [Google Scholar]
- 47.Champion JA, Walker A, Mitragotri S. Role of particle size in phagocytosis of polymeric microspheres. Pharm Res. 2008;25(8):1815–1821. doi: 10.1007/s11095-008-9562-y. [DOI] [PMC free article] [PubMed] [Google Scholar]
- 48.Doshi N, Mitragotri S. Macrophages recognize size and shape of their targets. PLoS One. 2010;5(4):e10051. doi: 10.1371/journal.pone.0010051. [DOI] [PMC free article] [PubMed] [Google Scholar]
- 49.Loeschner K, Hadrup N, Qvortrup K, et al. Distribution of silver in rats following 28 days of repeated oral exposure to silver nanoparticles or silver acetate. Part Fibre Toxicol. 2011;8:18. doi: 10.1186/1743-8977-8-18. [DOI] [PMC free article] [PubMed] [Google Scholar]
- 50.van der Zande M, Vandebriel RJ, Van Doren E, et al. Distribution, elimination, and toxicity of silver nanoparticles and silver ions in rats after 28-day oral exposure. ACS Nano. 2012;6(8):7427–7442. doi: 10.1021/nn302649p. [DOI] [PubMed] [Google Scholar]
- 51.Gettler AO, Rhoads CP, Weiss S. A Contribution to the Pathology of Generalized Argyria with a Discussion of the Fate of Silver in the Human Body. Am J Pathol. 1927;3(6):631–652.15. [PMC free article] [PubMed] [Google Scholar]
- 52.East BW, Boddy K, Williams ED, Macintyre D, Mclay AL. Silver retention, total body silver and tissue silver concentrations in argyria associated with exposure to an anti-smoking remedy containing silver acetate. Clin Exp Dermatol. 1980;5(3):305–311. doi: 10.1111/j.1365-2230.1980.tb01708.x. [DOI] [PubMed] [Google Scholar]
- 53.Furchner JE, Richmond CR, Drake GA. Comparative metabolism of radionuclides in mammals-IV. Retention of silver-110m in the mouse, rat, monkey, and dog. Health Phys. 1968;15(6):505–514. doi: 10.1097/00004032-196812000-00005. [DOI] [PubMed] [Google Scholar]
- 54.Liu J, Pennell KG, Hurt RH. Kinetics and mechanisms of nanosilver oxysulfidation. Environ Sci Technol. 2011;45(17):7345–7353. doi: 10.1021/es201539s. [DOI] [PMC free article] [PubMed] [Google Scholar]
- 55.Liu J, Sonshine DA, Shervani S, Hurt RH. Controlled release of biologically active silver from nanosilver surfaces. ACS Nano. 2010;4(11):6903–6913. doi: 10.1021/nn102272n. [DOI] [PMC free article] [PubMed] [Google Scholar]
- 56.Wöbling RH, Wilbradt R, Schopenhauer-Germann E, Euler G, König KH. Argyrose bei Beschäftigten in der silberverarbeitenden Industrie: Dermatologische Untersuchungen und quantitative Messungen mittels Atomabsorptionsspektrometrie [Argyrosis among workers in the silver industry: dermatological examinations and quantitative measurements by atomic absorption spectrometry] Arbeitsmed Sozialmed Praventivmed. 1988;23:293–297. German. [Google Scholar]
- 57.Danscher G. Light and electron microscopic localization of silver in biological tissue. Histochemistry. 1981;71(2):177–186. doi: 10.1007/BF00507822. [DOI] [PubMed] [Google Scholar]
- 58.Triebig G, Valentin H. Berufskrankheit Argyrose? – Aktuelle Aspekte [Occupational disease argyrosis? – Current aspects] Verhandlungen der Deutschen Gesellschaft für Arbeitsmedizin. 1982;22:239–243. German. [Google Scholar]
- 59.Alexander J, Aaseth J. Hepatobiliary transport and organ distribution of silver in the rat as influenced by selenite. Toxicology. 1981;21(3):179–186. doi: 10.1016/0300-483x(81)90154-2. [DOI] [PubMed] [Google Scholar]
- 60.Ballatori N, Clarkson TW. Biliary secretion of glutathione and of glutathione-metal complexes. Fundam Appl Toxicol. 1985;5(5):816–831. doi: 10.1016/0272-0590(85)90165-4. [DOI] [PubMed] [Google Scholar]
- 61.Perrelli G, Piolatto G. Tentative reference values for gold, silver and platinum: literature data analysis. Sci Total Environ. 1992;120(1–2):93–96. doi: 10.1016/0048-9697(92)90219-i. [DOI] [PubMed] [Google Scholar]
- 62.von Goetz N, Lorenz C, Windler L, Nowack B, Heuberger M, Hungerbühler K. Migration of Ag- and TiO2-nanoparticles from textiles into artificial sweat under physical stress: Experiments and exposure modeling. Environ Sci Technol. 2013 doi: 10.1021/es304329w. In press. [DOI] [PubMed] [Google Scholar]
- 63.DiVincenzo GD, Giordano CJ, Schriever LS. Biologic monitoring of workers exposed to silver. Int Arch Occup Environ Health. 1985;56(3):207–215. doi: 10.1007/BF00396598. [DOI] [PubMed] [Google Scholar]
- 64.Walczak AP, Fokkink R, Peters R, et al. Behaviour of silver nanoparticles and silver ions in an in vitro human gastrointestinal digestion model. Nanotoxicology. 2012 Oct 1; doi: 10.3109/17435390.2012.726382. Epub. [DOI] [PubMed] [Google Scholar]
- 65.Ji JH, Jung JH, Kim SS, et al. Twenty-eight-day inhalation toxicity study of silver nanoparticles in Sprague-Dawley rats. Inhal Toxicol. 2007;19(10):857–871. doi: 10.1080/08958370701432108. [DOI] [PubMed] [Google Scholar]
- 66.Park K, Park EJ, Chun IK, et al. Bioavailability and toxicokinetics of citrate-coated silver nanoparticles in rats. Arch Pharm Res. 2011;34(1):153–158. doi: 10.1007/s12272-011-0118-z. [DOI] [PubMed] [Google Scholar]
- 67.Hirn S, Semmler-Behnke M, Schleh C, et al. Particle size-dependent and surface charge-dependent biodistribution of gold nanoparticles after intravenous administration. Eur J Pharm Biopharm. 2011;77(3):407–416. doi: 10.1016/j.ejpb.2010.12.029. [DOI] [PMC free article] [PubMed] [Google Scholar]
- 68.Dziendzikowska K, Gromadzka-Ostrowska J, Lankoff A, et al. Time-dependent biodistribution and excretion of silver nanoparticles in male Wistar rats. J Appl Toxicol. 2012;32(11):920–928. doi: 10.1002/jat.2758. [DOI] [PubMed] [Google Scholar]
- 69.Bader KF. Organ deposition of silver following silver nitrate therapy of burns. Plast Reconstr Surg. 1966;37(6):550–551. doi: 10.1097/00006534-196606000-00012. [DOI] [PubMed] [Google Scholar]
- 70.Lee JH, Mun J, Park JD, Yu IJ. A health surveillance case study on workers who manufacture silver nanomaterials. Nanotoxicology. 2012;6(6):667–669. doi: 10.3109/17435390.2011.600840. [DOI] [PubMed] [Google Scholar]
- 71.Wang J, Zhou G, Chen C, et al. Acute toxicity and biodistribution of different sized titanium dioxide particles in mice after oral administration. Toxicol Lett. 2007;168(2):176–185. doi: 10.1016/j.toxlet.2006.12.001. [DOI] [PubMed] [Google Scholar]
- 72.Greulich C, Kittler S, Epple M, Muhr G, Köller M. Studies on the biocompatibility and the interaction of silver nanoparticles with human mesenchymal stem cells (hMSCs) Langenbecks Arch Surg. 2009;394(3):495–502. doi: 10.1007/s00423-009-0472-1. [DOI] [PubMed] [Google Scholar]
- 73.Foldbjerg R, Dang DA, Autrup H. Cytotoxicity and genotoxicity of silver nanoparticles in the human lung cancer cell line, A549. Arch Toxicol. 2011;85(7):743–750. doi: 10.1007/s00204-010-0545-5. [DOI] [PubMed] [Google Scholar]
- 74.Foldbjerg R, Olesen P, Hougaard M, Dang DA, Hoffmann HJ, Autrup H. PVP-coated silver nanoparticles and silver ions induce reactive oxygen species, apoptosis and necrosis in THP-1 monocytes. Toxicol Lett. 2009;190(2):156–162. doi: 10.1016/j.toxlet.2009.07.009. [DOI] [PubMed] [Google Scholar]
- 75.Greulich C, Braun D, Peetsch A, et al. The toxic effect of silver ions and silver nanoparticles towards bacteria and human cells occurs in the same concentration range. RSC Advances. 2012;2(17):6981–6987. [Google Scholar]
- 76.Hadrup N, Loeschner K, Mortensen A, et al. The similar neurotoxic effects of nanoparticulate and ionic silver in vivo and in vitro. Neurotoxicology. 2012;33(3):416–423. doi: 10.1016/j.neuro.2012.04.008. [DOI] [PubMed] [Google Scholar]
- 77.Hackenberg S, Scherzed A, Kessler M, et al. Silver nanoparticles: evaluation of DNA damage, toxicity and functional impairment in human mesenchymal stem cells. Toxicol Lett. 2011;201(1):27–33. doi: 10.1016/j.toxlet.2010.12.001. [DOI] [PubMed] [Google Scholar]
- 78.Samberg ME, Oldenburg SJ, Monteiro-Riviere NA. Evaluation of silver nanoparticle toxicity in skin in vivo and keratinocytes in vitro. Environ Health Perspect. 2010;118(3):407–413. doi: 10.1289/ehp.0901398. [DOI] [PMC free article] [PubMed] [Google Scholar]
- 79.US-EPA [homepage on the Internet] Integrated risk information system – silver (CASRN 7440-22-4) [updated January 12, 1996] Available from: http://www.epa.gov/iris/subst/0099.htmAccessed March 21, 2013
- 80.Bouwmeester H, Poortman J, Peters RJ, et al. Characterization of translocation of silver nanoparticles and effects on whole-genome gene expression using an in vitro intestinal epithelium coculture model. ACS Nano. 2011;5(5):4091–4103. doi: 10.1021/nn2007145. [DOI] [PubMed] [Google Scholar]
- 81.Landsiedel R, Fabian E, Ma-Hock L, et al. Toxico-/biokinetics of nanomaterials. Arch Toxicol. 2012;86(7):1021–1060. doi: 10.1007/s00204-012-0858-7. [DOI] [PubMed] [Google Scholar]
- 82.MacCuspie RI. Colloidal stability of silver nanoparticles in biologically relevant conditions. J Nanopart Res. 2011;13(7):2893–2908. [Google Scholar]
- 83.MacCuspie RI, Allen AJ, Hackley VA. Dispersion stabilization of silver nanoparticles in synthetic lung fluid studied under in situ conditions. Nanotoxicology. 2011;5(2):140–156. doi: 10.3109/17435390.2010.504311. [DOI] [PubMed] [Google Scholar]
- 84.Göppert TM, Müller RH. Polysorbate-stabilized solid lipid nanoparticles as colloidal carriers for intravenous targeting of drugs to the brain: comparison of plasma protein adsorption patterns. J Drug Target. 2005;13(3):179–187. doi: 10.1080/10611860500071292. [DOI] [PubMed] [Google Scholar]
- 85.Wasdo SC, Barber DS, Denslow ND, et al. Differential binding of serum proteins to nanoparticles. Int J Nanotechnol. 2008;5(1):92–115. [Google Scholar]
- 86.Li Y, Pei Y, Zhang X, et al. PEGylated PLGA nanoparticles as protein carriers: synthesis, preparation and biodistribution in rats. J Control Release. 2001;71(2):203–211. doi: 10.1016/s0168-3659(01)00218-8. [DOI] [PubMed] [Google Scholar]
- 87.Rejman J, Oberle V, Zuhorn IS, Hoekstra D. Size-dependent internalization of particles via the pathways of clathrin- and caveolae-mediated endocytosis. Biochem J. 2004;377(Pt 1):159–169. doi: 10.1042/BJ20031253. [DOI] [PMC free article] [PubMed] [Google Scholar]
- 88.Choi HS, Liu W, Misra P, et al. Renal clearance of quantum dots. Nat Biotechnol. 2007;25(10):1165–1170. doi: 10.1038/nbt1340. [DOI] [PMC free article] [PubMed] [Google Scholar]
- 89.Chen J, Tan M, Nemmar A, et al. Quantification of extrapulmonary translocation of intratracheal-instilled particles in vivo in rats: effect of lipopolysaccharide. Toxicology. 2006;222(3):195–201. doi: 10.1016/j.tox.2006.02.016. [DOI] [PubMed] [Google Scholar]
- 90.Sakai N, Takakura M, Imamura H, et al. Whole-body distribution of C-14-labeled silica nanoparticles and submicron particles after intravenous injection into mice. J Nanopart Res. 2012;14(5):1–11. [Google Scholar]
- 91.Park EJ, Bae E, Yi J, et al. Repeated-dose toxicity and inflammatory responses in mice by oral administration of silver nanoparticles. Environ Toxicol Pharmacol. 2010;30(2):162–168. doi: 10.1016/j.etap.2010.05.004. [DOI] [PubMed] [Google Scholar]
- 92.Kreyling WG, Semmler-Behnke M, Seitz J, et al. Size dependence of the translocation of inhaled iridium and carbon nanoparticle aggregates from the lung of rats to the blood and secondary target organs. Inhal Toxicol. 2009;21(Suppl 1):55–60. doi: 10.1080/08958370902942517. [DOI] [PubMed] [Google Scholar]
- 93.Garza-Ocañas L, Ferrer DA, Burt J, et al. Biodistribution and long-term fate of silver nanoparticles functionalized with bovine serum albumin in rats. Metallomics. 2010;2(3):204–210. doi: 10.1039/b916107d. [DOI] [PubMed] [Google Scholar]
- 94.Jiang JK, Oberdorster G, Biswas P. Characterization of size, surface charge, and agglomeration state of nanoparticle dispersions for toxicological studies. J Nanopart Res. 2009;11(1):77–89. [Google Scholar]
- 95.Semmler-Behnke M, Kreyling WG, Lipka J, et al. Biodistribution of 1.4- and 18-nm gold particles in rats. Small. 2008;4(12):2108–2111. doi: 10.1002/smll.200800922. [DOI] [PubMed] [Google Scholar]
- 96.Locht LJ, Larsen A, Stoltenberg M, Danscher G. Cultured macrophages cause dissolucytosis of metallic silver. Histol Histopathol. 2009;24(2):167–173. doi: 10.14670/HH-24.167. [DOI] [PubMed] [Google Scholar]
- 97.Locht LJ, Smidt K, Rungby J, Stoltenberg M, Larsen A. Uptake of silver from metallic silver surfaces induces cell death and a pro-inflammatory response in cultured J774 macrophages. Histol Histopathol. 2011;26(6):689–697. doi: 10.14670/HH-26.689. [DOI] [PubMed] [Google Scholar]
- 98.Scroggs MW, Lewis JS, Proia AD. Corneal argyrosis associated with silver soldering. Cornea. 1992;11(3):264–269. [PubMed] [Google Scholar]
- 99.Wang XQ, Chang HE, Francis R, et al. Silver deposits in cutaneous burn scar tissue is a common phenomenon following application of a silver dressing. J Cutan Pathol. 2009;36(7):788–792. doi: 10.1111/j.1600-0560.2008.01141.x. [DOI] [PubMed] [Google Scholar]
- 100.Levard C, Reinsch BC, Michel FM, Oumahi C, Lowry GV, Brown GE. Sulfidation processes of PVP-coated silver nanoparticles in aqueous solution: impact on dissolution rate. Environ Sci Technol. 2011;45(12):5260–5266. doi: 10.1021/es2007758. [DOI] [PubMed] [Google Scholar]
- 101.Levard C, Hotze EM, Lowry GV, Brown GE. Environmental transformations of silver nanoparticles: impact on stability and toxicity. Environ Sci Technol. 2012;46(13):6900–6914. doi: 10.1021/es2037405. [DOI] [PubMed] [Google Scholar]
- 102.Blumberg H, Carey TN. Argyremia: Detection of unsuspected and obscure argyria by the spectrographic demonstration of high blood silver. JAMA. 1934;103(20):1521–1524. [Google Scholar]
- 103.Drake PL, Hazelwood KJ. Exposure-related health effects of silver and silver compounds: a review. Ann Occup Hyg. 2005;49(7):575–585. doi: 10.1093/annhyg/mei019. [DOI] [PubMed] [Google Scholar]
- 104.Bachand G, Allen A, Bachand M, Achyuthan K, Seagrave J, Brozik S. Cytotoxicity and inflammation in human alveolar epithelial cells following exposure to occupational levels of gold and silver nanoparticles. J Nanopart Res. 2012;14(10):1–10. [Google Scholar]
- 105.Vogt A, Combadiere B, Hadam S, et al. 40 nm, but not 750 or 1,500 nm, nanoparticles enter epidermal CD1a+ cells after transcutaneous application on human skin. J Invest Dermatol. 2006;126(6):1316–1322. doi: 10.1038/sj.jid.5700226. [DOI] [PubMed] [Google Scholar]
- 106.Tan MH, Commens CA, Burnett L, Snitch PJ. A pilot study on the percutaneous absorption of microfine titanium dioxide from sunscreens. Australas J Dermatol. 1996;37(4):185–187. doi: 10.1111/j.1440-0960.1996.tb01050.x. [DOI] [PubMed] [Google Scholar]