Abstract
Optical coherence microscopy (OCM) is a widely used structural imaging modality. To extend its application in molecular imaging, gold nanorods are widely used as contrast agents for OCM. However, they very often offer limited sensitivity as a result of poor signal to background ratio. Here we experimentally demonstrate that a novel OCM implementation based on dark-field circular depolarization detection can efficiently detect circularly depolarized signal from gold nanorods and at the same time efficiently suppress the background signals. This results into a significant improvement in signal to background ratio.
OCIS codes: (110.4500) Optical coherence tomography; (120.5820) Scattering measurements; (180.3170) Interference microscopy; (290.5850) Scattering, particles; (290.5855) Scattering, polarization
1. Introduction
Optical coherence microscopy is a powerful imaging method with advantages in terms of imaging depth, resolution and sensitivity [1]. Because of these advantages OCM is a widely used imaging method for various applications [2,3]. OCM is essentially a structural imaging modality. Various contrast agents for OCM are developed to extend its application into molecular imaging [4]. Among them, gold nanoparticles are widely used molecular contrast probes as gold nanoparticles provide tunable high scattering/absorption cross section due to plasmon resonance and they are biologically inert [5,6]. Because of these advantages gold nanoparticles are widely used molecular contrast probes in optical imaging methods [7–9].
The problem with conventional contrast mechanism lies in the difficulty of differentiating the signal arising from gold nanoparticles and the background from the surrounding tissue. Consequently, a fairly high concentration of gold nanoparticles is required for achieving an adequate contrast. Another issue of OCM is related to the strong reflection from a cover slip on which biological samples are prepared. Even a minor difference in the refractive index between the sample and the flat interfaces may result in a strong reflection of the incident light. This strong specular reflection, coupled with the limited dynamic range of OCM, makes it very difficult to detect the extremely weak scattering signals from nanoparticles [10].
To overcome the poor contrast associated with conventional contrast mode of OCM, various groups have developed contrast mechanisms with differentiable property compared to background tissue [11–15]. These differentiable behaviors allow effective suppression of background, leading to enhanced contrast and sensitivity. Differentiable polarization response is one of the effective mechanisms for contrast enhancement. Recently, we proposed chirality based polarization differential response to effectively suppress background signal to improve sensitivity of gold nanostructures [14].
In optical microscopy, other polarization based sensitivity enhancement methods make use of the fact that asymmetric nanoparticles are known to provide strong depolarization and many biological tissues have weak ballistic depolarization [16,17]. A method was proposed to efficiently reduce the background by detecting the strong depolarized light originating from asymmetric nanoparticles [18]. Contrast enhancement was demonstrated using this approach experimentally.
To overcome the issue of the dynamic range imposed by strong reflection from flat surface, dark field detection for OCM was proposed. Improvement in the detection of weak signals has been reported by this method [10]. Other than specular reflection rejection, the dark field method is also known to provide improved lateral resolution. This improvement is due to the fact that the dark-field illumination and detection aperture allows the passage of higher spatial frequencies compared to the bright field illumination and detection [10,19,20].
In this paper, we present a dark-field circular depolarization OCM system, which is designed to enhance the sensitivity of gold nanorods in biological tissues, particularly when the tissue is mounted on a glass slide. The principle idea relies on the fact that the detection of only depolarized signal can efficiently reduce the background signal. With the reduction in the background level it is possible to detect gold nanorods at a very small concentration. The implementation of dark field circular depolarization sensitive OCM setup is described in Section 2. Experimental images of gold nanorods in a tissue phantom and in cells are presented in Section 3 to demonstrate efficient background reduction leading to enhancement in contrast and sensitivity.
2. Materials and methods
2.1 Dark field circular depolarization sensitive OCM
In this section, we first describe the implementation of dark-field detection in an OCM setup followed by the description of a circular depolarization sensitive detection mechanism. Dark-field method achieves the strong background rejection by using special illumination and a detection setup [8,20,21] that rejects the strong specular reflection from the sample and the glass slide.
Dark-field OCM setup was proposed by Villigear et al. [10] in 2010. They used a Bessel beam illumination to implement the dark-field setup. We have implemented a dark field OCM using a simpler approach but with two half-moon shaped aperture stops. One stop (Stop1) is inserted into the source arm to obtain oblique illumination and the other stop (Stop 2) is in the detector arm to block the specular reflection. The inset in the Fig. 1 shows the transmittance recorded with a camera at stop 1 and stop 2.
Fig. 1.
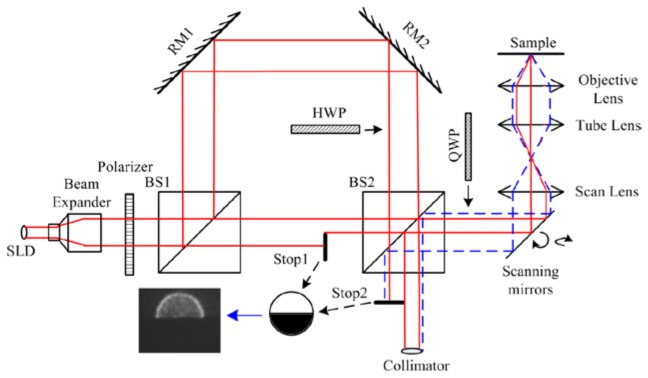
Configuration for DF circular depolarization sensitive OCM (BS1, BS2: Beam Splitter; RM1, RM2: Reflective Mirror; SLD: Super-Luminescent Diode; QWP: Quarter wave plate; HWP: Half wave plate)
The schematic of our OCM system is shown in Fig. 1, where the illumination was provided by a SLD (InPhenix Inc., maximum power: 11mW, the full width at half-maximum bandwidth of 49 nm centered at 842 nm) and the full width half maximum waist size of the source beam emitting from the collimator is around 2 mm. For easier alignment of the stops a 3x beam expander is used to increase the beam waist size. BS1 divides this light into reference arm and the sample arm. Two reference mirrors (RM1 and RM2) on a linear translational stage form the reference arm. In this setup, the reference arm light and backscattered light from the sample arm interfere at BS2. A 2D scanning mirror from Newport with a large reflective surface (1 inch diameter) is used for scanning in the sample arm. The A-scan rate is 600Hz limited by this 2D scanner. A free space 40x (NA = 0.6) objective lens is used to focus light on the sample. A fiber collimator collects the interference signal. A spectrometer with wavelength detection range from 804.8nm to 875nm at the steps of 0.068nm is used to detect the interference signal. Further post processing in computer is conducted to generate A-Scan signal from the measured spectral information.
Combination of a quarter wave plate (QWP) and a half wave plate (HWP) in the proposed scheme help to convert the dark-field setup into a dark-field polarization sensitive setup. By orienting the QWP at 45° with respect to the source polarization, we can generate circularly polarized incident light on the sample. HWP in the reference arm allows us to select the cross- and co-polarization components. When the HWP is at 0° with respect to the source polarization, the cross-polarization component is detected. When the HWP is oriented along 45°, the co-polarization signal is detected. The definition and terminology for co- and cross-polarization is same as in the [22].
With 120µW power incident on the sample and a calibrated attenuation of 36.6dB in the sample arm, along with a 14dB of calibrated reflection, the system has SNR value of 97.2dB. The lateral resolution of the system is 2.2µm.
2.2 Gold nanorod and Tissue phantom setup
To demonstrate the effectiveness of our approach in a tissue like scattering environment, we first imaged the gold nanorods in a thick tissue-mimicking phantom setup. The phantom structure is shown in Fig. 2(a) . The setup consists of 1% Lipofundin solution which mimics the scattering property of the soft biological tissues [23]. The scattering effect of the solution is in Fig. 2(b). This solution is mixed with commercially available gold nanorod solution with a concentration of 0.5nM. The gold nanorods have a plasmon resonance peak around 850nm [24]. The solution is filled in a channel of thickness around 1.3mm.
Fig. 2.
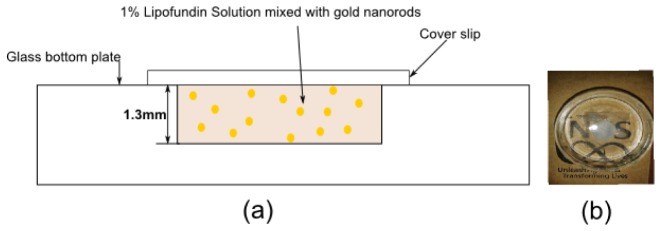
Tissue phantom setup (a) Schematic and (b) Photo of the setup
2.3 Cellular imaging with gold nanorods
Melanoma carcinoma cells were seeded onto cover slips placed in 6-well culture plates at a seeding density of 1x10⁴ cells/cm2 at least 24 hours before dosing with nanorods. The cells were cultured in DMEM culture medium with 10% fetal bovine serum (FBS) and 1% penicillin-streptomycin at 37°C under a 5% CO2 atmosphere.
The commercially purchased gold nanorods stabilized with cetyltrimethylammonium bromide (CTAB) were unstable in culture medium and would aggregate immediately upon introduction into medium. To ensure that they remain colloidallly stable in culture medium, the nanorods were coated with human serum. To achieve this, the nanorod solution was first centrifuged at 8000 rpm for 10 min to obtain the nanorods as a pellet. The nanorods were then resuspended in sterile-filtered human serum and incubated at 37°C overnight to allow a stabilizing coating of serum to form around the nanorods. The nanorods were then spun down again at 6000 rpm for 10 min before resuspension in culture medium at a concentration of 0.85 nM.
Cells were then dosed with gold nanorods by aspirating the normal culture medium from the wells, and replacing it with the culture medium containing 0.85 nM gold nanorods. The cells were then incubated for 6 hours at 37°C under a 5% CO2 atmosphere to allow intracellular uptake of gold nanorods. Following the incubation, cells were washed thoroughly three times with PBS. The seeded cells were then transferred onto glass slide for imaging.
A separate negative control was also prepared by incubating the cells in culture medium without nanorods. The cells were similarly washed thrice with PBS and the cover slips transferred onto a glass slide for imaging.
3. Results and discussion
To experimentally demonstrate efficient background rejection and contrast enhancement, we first imaged the nanorods mixed in the thick highly scattering tissue-mimicking phantom. Next, the nanorods were loaded in melanoma carcinoma cells and in-vitro images were obtained.
3.1 Gold nanorods in a tissue phantom
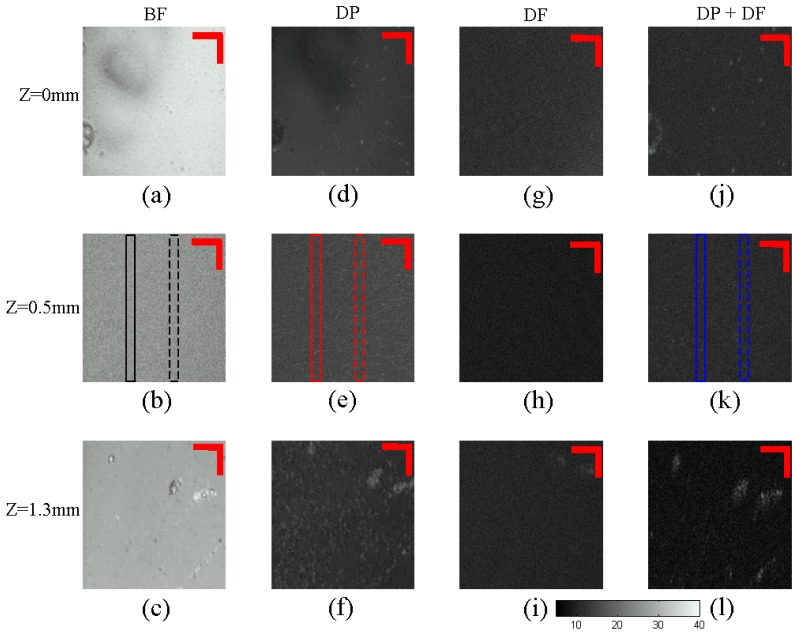
Nanorods in the tissue phantom setup were imaged in four different OCM configurations: (i) Bright Field OCM (BF), which is the configuration in which most conventional OCM operates. This OCM configuration does not have dark-field or polarization sensitive rejection mechanisms. (ii) Bright field circular depolarization OCM (DP), this configuration has polarizing elements to reject co-polarized signal which is the major source of the background signal. (iii) Dark-field setup (DF), with dark-field illumination and a stop that is able to reject specular reflections from the sample, and (iv) Dark-field circular depolarization sensitive OCM (DF + DP), this configuration has both dark-field and polarization sensitive detection mechanism, to reject the strong background signal. The sample was placed on axial translational stage so that it is possible to focus at different axial depth in the sample. Enface layer that contains the nanoparticles is extracted from the image data. The enface image data is plotted in gray scale images, where the brightness indicates the signal strength in dB.
Figures 3(a) , 3(b), and 3(c) are the enface images obtained with the bright field OCM setup at depths Z = 0mm (The bottom surface of the coverslip), Z = 0.5mm (Inside the Lipofundin solution), and Z = 1.3mm (The bottom surface of the glass channel). In these images, it is difficult to locate the signal from the gold nanoparticles due to the strong background arising from the specular reflection as well as backscattered light from the Lipofundin solution. Figures 3(d), 3(e), and 3(f) show the enface images obtained with the bright field circular depolarization sensitive OCM. As this method rejects the co-polarized components that have the majority of the background signal, there is a significant reduction in the background compared to the bright field OCM. Since the nanorods have strong circular depolarization signals, they can be seen with high contrast and sensitivity. Figures 3(g), 3(h), and 3(i) are the dark field images, again there is a strong reduction in the background as the dark field method rejects the extremely strong specular reflection. Figures 3(j), 3(k), and 3(l) show the dark field circular depolarization images. As it combines both background rejection mechanisms, it gives the best background reduction among the four methods.
Fig. 3.
En-face images of the tissue phantom at different depths (0 mm, 0.5mm, and 1.3mm). BF = Bright field setup, DP = Depolarization setup, DF = Dark-field setup, DP + DF = Depolarization and Darkfield setup. The grayscale bar indicates signal strength in dB, Scale bar = 20μm.
The intensity fluctuation along the line profile is plotted in Fig. 4 . The line profile regions are indicated in Figs. 3(b), 3(e) and 3(k). From the results it can be seen that for a signal coming from a depth around 500μm in a highly scattering environment, there is around 15dB reduction in the background signal with the circular depolarization measurement compared to the BF setup. With the addition of dark field illumination and detection along with the depolarization measurement there is around 20dB reduction in the background signal compared to the BF setup. With this background reduction and with the fact that the nanorods have strong circular depolarization signal, it is possible to see the signal from the nanorods that is not visible in the BF setup.
Fig. 4.
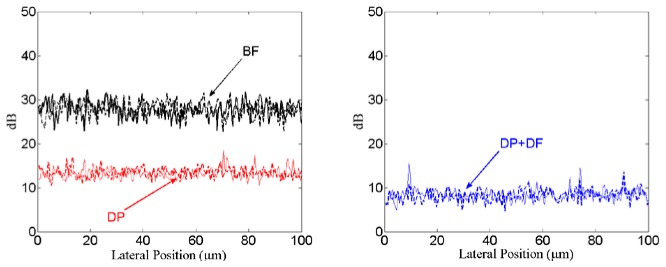
Intensity fluctuation along in the line profile region identified in the Fig. 3, for the BF, DF and DP + DF measurement setup
3.2 Cellular imaging
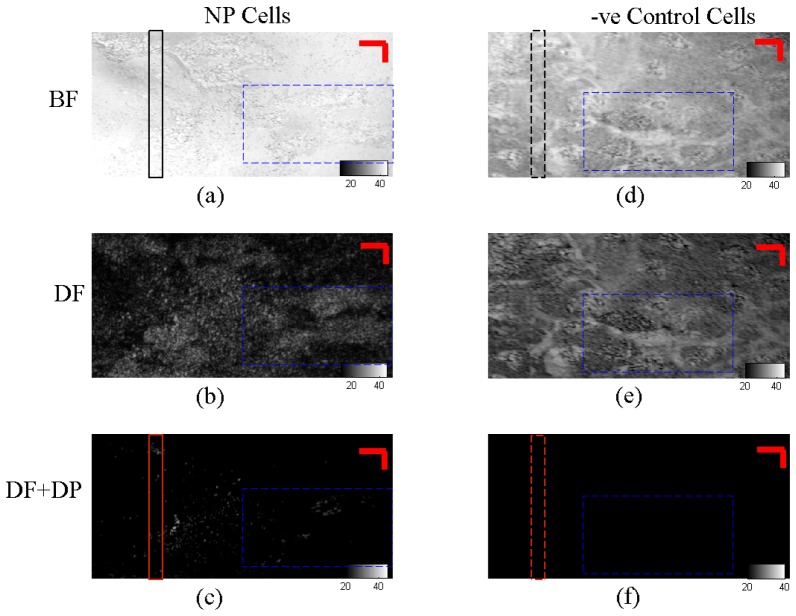
It is evident from the results of tissue phantom imaging that there is a significant improvement in signal to noise ratio with dark field circular depolarization OCM. This is mainly attributed to significant reduction in the background signal. We next apply this technique to cellular imaging to demonstrate improved contrast for gold nanorods. Melanoma carcinoma cells were dosed with gold nanorods (NP Cells) and imaged in the same manner as the tissue phantoms (Fig. 5 ).
Fig. 5.
En-face image of the cells obtained with BF = Bright field, DF = Dark field, DF + DP = Dark field + depolarization OCM setups, Scale bar = 10μm. The grayscale level indicates signal strength in dB
Under bright field imaging, the en-face images show that the signal from the cells mounted on glass slide is barely discernible from the strong background signal (Fig. 5(a) and 5(d)). This is true for both NP cells and negative control cells without any gold nanorods (-ve Control Cells). The cells become more discernible under dark field illumination and detection. There is a reduction in the background level of up to 25dB, which shows a clearer cell boundary (Fig. 5(b) and 5(e), blue dotted square). However, as the various cellular organelles such as mitochondria and cell nucleus also exhibit strong optical scattering, they interfere with the dark field signal from the gold nanorods (Fig. 5(b)).
These background signals from the cellular and sub-cellular structures can be further eliminated with polarization detection (Fig. 5(f)) to show only the signal arising from the gold nanorods in cells (Fig. 5(c)). In this case, the –ve Control Cells shows negligible background signal in the absence of gold nanorods. With this technique, it is possible to determine the specific localization of the gold nanorods in cells with negligible background interference.
We plotted the intensity fluctuation profile (red dotted line) along a selected region in the cellular image in Fig. 5 to illustrate the difference in the signal level (Fig. 6 ). It is clear that the dark field mode (red lines) show a significant reduction of up to 25dB in the background signal compared to bright field mode (black lines). Furthermore, with the inclusion of circular depolarization in dark field mode OCM, we are able to clearly differentiate the signal level in the presence of gold nanorods (red solid lines) versus the absence of gold nanorods (red dotted lines). It is possible to identify the back-scattered signal from gold nanorods with more than 10dB SNR in vitro. This difference is much less significant in bright field mode with gold nanorods (black solid lines) against the absence of gold nanorods (black dotted line). The specific contrast images arising from gold nanorods under dark field circular depolarization sensitive OCM could potentially be superimposed onto regular dark field images of cells to allow better visualization of the localization of these nanoparticles in cells for in vitro imaging experiments.
Fig. 6.
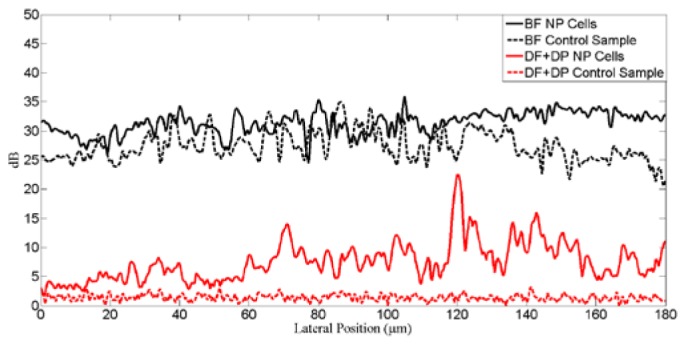
Intensity fluctuation along in the line profile region identified in the Fig. 4., for the BF, DF and DP + DF measurement setup
4. Conclusions
In summary, we have demonstrated that dark-field cross-polarization OCM can be setup efficiently using a simple implementation configuration. This method effectively reduces the background signals and provides enhancement in contrast from asymmetric nanoparticles such as gold nanorods. This method can potentially be used for high sensitive molecular detection with a simple modification in an OCM system.
Acknowledgments
We thank Dr Shakil Rehman for useful discussion. Kalpesh Mehta acknowledges financial support from NUS Graduate School of Integrative Science for funding his graduate study.
References and links
- 1.Izatt J. A., Hee M. R., Owen G. M., Swanson E. A., Fujimoto J. G., “Optical coherence microscopy in scattering media,” Opt. Lett. 19(8), 590–592 (1994). 10.1364/OL.19.000590 [DOI] [PubMed] [Google Scholar]
- 2.Schmitt J. M., Yadlowsky M. J., Bonner R. F., “Subsurface Imaging of Living Skin with Optical Coherence Microscopy,” Dermatology (Basel) 191(2), 93–98 (1995). 10.1159/000246523 [DOI] [PubMed] [Google Scholar]
- 3.Hettinger J. W., de la Peña Mattozzi M., Myers W. R., Williams M. E., Reeves A., Parsons R. L., Haskell R. C., Petersen D. C., Wang R., Medford J. I., “Optical Coherence Microscopy. A Technology for Rapid, in Vivo, Non-Destructive Visualization of Plants and Plant Cells,” Plant Physiol. 123(1), 3–16 (2000). 10.1104/pp.123.1.3 [DOI] [PMC free article] [PubMed] [Google Scholar]
- 4.Boppart S. A., Oldenburg A. L., Xu C., Marks D. L., “Optical probes and techniques for molecular contrast enhancement in coherence imaging,” J. Biomed. Opt. 10(4), 041208 (2005). 10.1117/1.2008974 [DOI] [PubMed] [Google Scholar]
- 5.Huang X., Neretina S., El-Sayed M. A., “Gold Nanorods: From Synthesis and Properties to Biological and Biomedical Applications,” Adv. Mater. 21(48), 4880–4910 (2009). 10.1002/adma.200802789 [DOI] [PubMed] [Google Scholar]
- 6.Jain P. K., Lee K. S., El-Sayed I. H., El-Sayed M. A., “Calculated absorption and scattering properties of gold nanoparticles of different size, shape, and composition: applications in biological imaging and biomedicine,” J. Phys. Chem. B 110(14), 7238–7248 (2006). 10.1021/jp057170o [DOI] [PubMed] [Google Scholar]
- 7.Skrabalak S. E., Au L., Lu X., Li X., Xia Y., “Gold nanocages for cancer detection and treatment,” Nanomedicine (Lond) 2(5), 657–668 (2007). 10.2217/17435889.2.5.657 [DOI] [PubMed] [Google Scholar]
- 8.Wax A., Sokolov K., “Molecular imaging and darkfield microspectroscopy of live cells using gold plasmonic nanoparticles,” Laser Photon. Rev. 3(1-2), 146–158 (2009). 10.1002/lpor.200810011 [DOI] [Google Scholar]
- 9.Kah J. C. Y., Olivo M., Chow T. H., Song K. S., Koh K. Z. Y., Mhaisalkar S., Sheppard C. J. R., “Control of optical contrast using gold nanoshells for optical coherence tomography imaging of mouse xenograft tumor model in vivo,” J. Biomed. Opt. 14, 054015 (2009). [DOI] [PubMed] [Google Scholar]
- 10.Villiger M., Pache C., Lasser T., “Dark-field optical coherence microscopy,” Opt. Lett. 35(20), 3489–3491 (2010). 10.1364/OL.35.003489 [DOI] [PubMed] [Google Scholar]
- 11.Oldenburg A. L., Toublan F. J.-J., Suslick K. S., Wei A., Boppart S. A., “Magnetomotive contrast for in vivo optical coherence tomography,” Opt. Express 13(17), 6597–6614 (2005). 10.1364/OPEX.13.006597 [DOI] [PubMed] [Google Scholar]
- 12.Song H.-M., Wei Q., Ong Q. K., Wei A., “Plasmon-Resonant Nanoparticles and Nanostars with Magnetic Cores: Synthesis and Magnetomotive Imaging,” ACS Nano 4(9), 5163–5173 (2010). 10.1021/nn101202h [DOI] [PMC free article] [PubMed] [Google Scholar]
- 13.Tucker-Schwartz J. M., Meyer T. A., Patil C. A., Duvall C. L., Skala M. C., “In vivo photothermal optical coherence tomography of gold nanorod contrast agents,” Biomed. Opt. Express 3(11), 2881–2895 (2012). 10.1364/BOE.3.002881 [DOI] [PMC free article] [PubMed] [Google Scholar]
- 14.Mehta K. B., Chen N., “Plasmonic chiral contrast agents for optical coherence tomography: numerical study,” Opt. Express 19(16), 14903–14912 (2011). 10.1364/OE.19.014903 [DOI] [PubMed] [Google Scholar]
- 15.Pache C., Bocchio N. L., Bouwens A., Villiger M., Berclaz C., Goulley J., Gibson M. I., Santschi C., Lasser T., “Fast three-dimensional imaging of gold nanoparticles in living cells with photothermal optical lock-in Optical Coherence Microscopy,” Opt. Express 20(19), 21385–21399 (2012). 10.1364/OE.20.021385 [DOI] [PubMed] [Google Scholar]
- 16.Khlebtsov B. N., Khanadeev V. A., Khlebtsov N. G., “Observation of Extra-High Depolarized Light Scattering Spectra from Gold Nanorods,” J. Phys. Chem. C 112(33), 12760–12768 (2008). 10.1021/jp802874x [DOI] [Google Scholar]
- 17.Khlebtsov B., Khanadeev V., Khlebtsov N., “Tunable depolarized light scattering from gold and gold/silver nanorods,” Phys. Chem. Chem. Phys. 12(13), 3210–3218 (2010). 10.1039/b925102b [DOI] [PubMed] [Google Scholar]
- 18.Aaron J., de la Rosa E., Travis K., Harrison N., Burt J., José-Yacamán M., Sokolov K., “Polarization microscopy with stellated gold nanoparticles for robust monitoring of molecular assemblies and single biomolecules,” Opt. Express 16(3), 2153–2167 (2008). 10.1364/OE.16.002153 [DOI] [PubMed] [Google Scholar]
- 19.M. Villiger, C. Pache, R. A. Leitgeb, and T. Lasser, “Coherent transfer functions and extended depth of field,” in BiOS, J. A. Izatt, J. G. Fujimoto, and V. V. Tuchin, eds. (International Society for Optics and Photonics, 2010), pp. 755417–755417–5. [Google Scholar]
- 20.Gong W., Si K., Sheppard C. J. R., “Optimization of axial resolution in a confocal microscope with D-shaped apertures,” Appl. Opt. 48(20), 3998–4002 (2009). 10.1364/AO.48.003998 [DOI] [PubMed] [Google Scholar]
- 21.Török P., Laczik Z., Sheppard C. J., “Effect of half-stop lateral misalignment on imaging of dark-field and stereoscopic confocal microscopes,” Appl. Opt. 35(34), 6732–6735 (1996). 10.1364/AO.35.006732 [DOI] [PubMed] [Google Scholar]
- 22.Chen Y., Otis L., Zhu Q., “Polarization memory effect in optical coherence tomography and dental imaging application,” J. Biomed. Opt. 16(8), 086005 (2011). 10.1117/1.3606573 [DOI] [PMC free article] [PubMed] [Google Scholar]
- 23.Di Ninni P., Bérubé-Lauzière Y., Mercatelli L., Sani E., Martelli F., “Fat emulsions as diffusive reference standards for tissue simulating phantoms?” Appl. Opt. 51(30), 7176–7182 (2012). 10.1364/AO.51.007176 [DOI] [PubMed] [Google Scholar]
- 24.Gold nanorods 10 nm diameter, absorption/850 nm, dispersion in H2O | Sigma-Aldrich,” http://www.sigmaaldrich.com/catalog/product/aldrich/716839?lang=en®ion=SG


