

Abstract
Reciprocal mechanical interactions between cells and the extracellular matrix (ECM) are thought to play important instructive roles in branching morphogenesis. However, most studies to date have failed to characterize these interactions on a length scale relevant to cells, especially in three-dimensional (3D) matrices. Here we utilized two complementary methods, spatio-temporal image correlation spectroscopy (STICS) and laser optical tweezers-based active microrheology (AMR), to quantify endothelial cell (EC)-mediated deformations of individual ECM elements and the local ECM mechanical properties, respectively, during the process of capillary morphogenesis in a 3D cell culture model. In experiments in which the ECM density was systematically varied, STICS revealed that the rate at which ECs deformed individual ECM fibers on the microscale positively correlated with capillary sprouting on the macroscale. ECs expressing constitutively active V14-RhoA displaced individual matrix fibers at significantly faster rates and displayed enhanced capillary sprouting relative to wild-type cells, while those expressing dominant-negative N19-RhoA behaved in an opposite fashion. In parallel, AMR revealed a local stiffening of the ECM proximal to the tips of sprouting ECs. By quantifying the dynamic physical properties of the cell-ECM interface in both space and time, we identified a correlation linking ECM deformation rates and local ECM stiffening at the microscale with capillary morphogenesis at the macroscale.
Introduction
Abnormal angiogenesis is present in a variety of pathological conditions ranging from cancerous tumors, psoriasis, blindness and arthritis, to heart and brain ischemia, neurodegeneration, hypertension, osteoporosis and heart disease.1 The ability to control angiogenic sprouting within affected tissues is important to generate therapeutic solutions to these conditions. Acquiring a fundamental understanding of the interdependence of angiogenesis, tissue structural properties, and cell-ECM interactions may significantly enhance efforts to develop new approaches that promote healthy vessel formation.
Previous studies have demonstrated that ECM compliance influences cell-generated contractile forces in two-dimensional (2D) cell cultures.2,3 These actin-mediated contractile forces are governed in part by the activity of the small GTPase RhoA, and appear to be a critical link between ECM mechanical properties and cell function in 2D.4 RhoA and its signaling partners have also been implicated in capillary morphogenesis.5,6 Previous 2D cell culture studies have shown that ECM ligand density can control growth and morphology of capillary formation7 and that mechanical cues affect tubulogenesis.8–10 In 3D tissues, we have studied how matrix density affects formation of blood vessels both in vitro and in vivo,11–16 adapting a model first described by Nehls and Drenckhahn where ECs are grown on microcarrier beads within a fibrin matrix.17 Fibrin is one of the major structural proteins involved in the provisional matrix during wound healing,18 and thus provides an appropriate substrate for an angiogenesis model.
To better understand the reciprocal and dynamic nature of the cell-ECM interface and its effects on capillary morphogenesis, here we have employed two relatively sophisticated physics-based methods, STICS and AMR. STICS revealed that the rates at which nascent vessels exerted forces on the ECM at the micron and submicron length scales correlated with the phenotypic responses observed on the larger length scale. Furthermore, both sprouting and the rates of matrix deformation were maximized in gels whose concentration matched the physiologic concentration of fibrin in a provisional blood clot. AMR revealed that the ECM is locally stiffened at the tips of sprouting capillaries. Collectively, these two methods revealed a predictive new correlation spanning multiple length scales that describes the mechanochemical regulation of capillary sprouting in 3D.
Materials and methods
Quantification of capillary morphogenesis
This study exploited a fibrin-based 3D cell culture model of angiogenesis assembled as described in the electronic supplementary information (ESI†). The model yields robust networks of capillary-like structures with hollow, well-defined lumens,13 and these structures are capable of forming functional anastomoses with host vessels upon implantation.14 High-resolution images of sprouting capillary-like networks were obtained with an Olympus IX51 microscope, and quantified using Image J software (National Institutes of Health) as previously described.15 A minimum of ten beads were randomly selected per condition, with only isolated beads quantified to avoid vessels anastomosing with neighboring networks. Total network lengths for each bead in each condition were then documented and averaged. The resulting plots of average total network length over time were generated using KaleidaGraph (Synergy Software, Reading, PA). A broad range of fibrin concentrations (1, 1.5, 2, 2.5, 5, 10 mg ml−1), spanning the physiologic value (∼2.5 mg ml−1) found in a provisional clot during wound healing,19 was explored in this study.
Spatio-temporal image correlation spectroscopy: imaging and analysis
ECM displacements surrounding the nascent vessel-like structures were quantified using spatio-temporal image correlation spectroscopy (STICS). Fibrin-based constructs were imaged after 6 days of culture as this time point allowed for sufficient vessel development in all conditions. Brightfield phase-contrast and confocal reflectance imaging were performed using an Olympus FluoView FV1000 confocal laser scanning microscope equipped with a 60X 1.2NA water immersion objective and an Argon Ion laser at 488 nm. The constructs were scanned every 15 s in a single focal plane for a total of 250 images for each condition, and these image stacks were sequentially compiled to generate videos of each data set. STICS was then applied to obtain velocity maps for individual fibers in a given ECM region of interest, and to derive the average velocity modulus of regions of ECM surrounding the sprouting vessels. STICS analysis was executed using an automated method within SimFCS software developed by the Laboratory for Fluorescence Dynamics (www.lfd.uci.edu). Complete mathematical derivation of the STICS analysis and extraction of velocity data has been published previously,20 but a summary of the method can be found in the Supporting Material section.
STICS data presented in this manuscript were analyzed in blocks of 32 pixels by 32 pixels that overlap by 16 pixels (unless otherwise noted). Using relatively small regions allowed high resolution to be achieved within the resulting flow maps. SimFCS software displayed vector arrows to represent the rates of ECM displacement for each block, such that one arrow was placed in the center of each block. The length of the arrow directly corresponds to the magnitude of the velocity and the direction of the arrow corresponds to the direction of flow. Numerical data of this representation could be easily extracted within the software and velocity values are reported in μm h−1 within the final figures.
Quantification of ECM mechanical properties via macro- and microrheology
Macroscale mechanical characterization of the fibrin gels was accomplished in situ on an AR G2 rheometer (TA Instruments, New Castle, DE) equipped with a Peltier stage and 20 mm stainless steel parallel plate geometry. The Peltier stage was cooled to 4 °C, and 320 μL of fibrinogen solution was injected into a 1050 μm gap between the plate and stage. The edge of the plate was sealed with silicone oil (Arcos Organics, Morris Plains, NJ) to prevent evaporation and the top plate was lowered to 1000 mm. The temperature was increased from 4 °C to 37 °C over 5 min and then held at 37 °C for 45 min while the clotting was monitored at 1% strain and 1 rad s−1. All gels fully clotted within 45 min as indicated by a plateau in G′. The viscoelastic properties of the hydrogel were examined by a frequency sweep from 1 to 100 rad s−1 at 1% strain, and the averages over the linear region (1 to 10 rad s−1) of both G′ and G″ were recorded. This procedure was repeated five times at each concentration.
Mechanical properties within fibrin gels near and away from sprouting vessels were measured by AMR using a previously described system.21 In AMR, we use a focused laser beam to optically trap a microbead that is embedded within a 3D matrix. The amplitude-phase response of the bead is recorded as the trapping beam is sinusoidally oscillated. For these experiments, the trapping beam was oscillated with an amplitude of 60 nm through frequencies 5, 10, 20 50, 75, and 100 Hz. The stiffness, G′, of the fibrin matrix was calculated as previously described.21 Silica beads of 2 μm diameter were mixed into fibrinogen solutions prior to polymerization and assembly of the angiogenesis model inside 35 mm diameter glass-bottom Petri dishes (No. 1.5 glass, MatTek). This resulted in a disperse distribution of silica beads within the fibrin-based angiogenesis model, where each bead could be manipulated by laser tweezers for AMR measurements. On day 6 (consistent with the STICS measurements), G′ was measured near to capillary tips (within 20 μm) and far from capillaries (greater than 500 μm away).
Modulation of EC-generated tractional forces
EC-generated tractional forces were modulated in two ways. The first involved the expression of genetic constructs expressing constitutively active (V14) or dominant negative (N19) mutants of the small GTPase RhoA. Cells expressing GFP were used as a control. HUVECs were treated with appropriate adenoviral supernatants 3 days prior to fibrin tissue assembly to yield cultures that were ∼70% infected as determined by GFP expression. A RhoA G-LISA assay (Cytoskeleton, Denver, CO) was performed using HUVEC lysates to confirm the expected up- or down-regulation of RhoA activity (ESI†, Fig. S2). The second approach involved direct application of one of the following compounds to the tissue constructs with every media change: Y27632 (30 μM; Calbiochem, La Jolla, CA), which inhibits the Rho-associated protein kinase (ROCK) and thus ROCK-mediated myosin light chain phosphorylation;22 BDM (10 mM; Calbiochem), which inhibits the myosin ATPase downstream of myosin light chain phosphorylation;23 ML-7 (10 μM; Sigma-Aldrich, St. Louis, MO), a potent and selective inhibitor of myosin light chain kinase;24 and blebbistatin (50 μM; Calbiochem), which preferentially binds to the myosin ATPase intermediate with ADP and phosphate bound at the active site and slows down phosphate release.25 Drug concentrations were based on previous literature, as well as dose-response studies performed in our lab.
Statistical analysis
Statistical analyses were performed using KaleidaGraph (Synergy Software). Data were represented as mean total network length ± standard deviation for angiogenesis quantification. ECM displacement data is represented as average velocity ± standard deviation. G-LISA data is shown as normalized RhoA activity levels ± standard deviation. A one-way analysis of variance (ANOVA) was performed to assess statistical significance among data sets. Statistical significance was assumed when p < 0.05.
Results
Characterizing ECM displacements via spatio-temporal image correlation spectroscopy
A major goal of this study was to determine if the effects of EC-mediated contractile forces could be quantified on a length scale relevant for individual cell-ECM interactions during capillary morphogenesis. To achieve this goal, we performed STICS analysis26 on sets of confocal reflectance images (Fig. 1A). Using SimFCS software (www.lfd.uci.edu), image correlation analysis was performed on each stack of images in space and time, where each image within the stack was divided into 225 analysis regions, or boxes, each 32 by 32 pixels. A velocity vector was calculated for each of the boxes, compiled and represented as a detailed velocity map (Fig. 1B and C). These velocity maps provided a representation of both the magnitude and rates of displacements of individual ECM fibers under the influence of cell-generated forces. In these experiments, the dynamic nature of individual filaments within the fibrin ECM was particularly striking (See ESI†, Movie S1, A–C).
Fig. 1.

STICS experimental set-up. (A) Typical data output set, image dimensions 105 × 105 μm. (B) Spatio-temporal image correlation spectroscopy analysis diagram, right image dimensions 52.5 × 52.5 μm. (C) Final velocity map obtained via STICS analysis; left image is 105 × 105 μm, right image is 52.5 × 52.5 μm. (D) Verification of minimal matrix displacement within acellular fibrin (left) and far away from a sprouting vessel (right); images are 52.5 × 52.5 μm. (E) Evidence of the surrounding matrix moving away (left) or towards (right) the vessel; images are 52.5 × 52.5 μm. All representative images are within 2.5 mg ml−1 fibrin.
To validate the method, STICS analysis was performed on acellular fibrin gels lacking EC-coated beads. Such experiments yielded extremely small velocity vectors, verifying that individual elements within the ECM move very little due to thermal fluctuations and environmental vibrations in the absence of any EC-generated tractional forces (Fig. 1D). Similarly, in tissues with EC-coated beads, STICS measurements far away from vessel sprouts showed very little matrix displacement (Fig. 1D). Another notable feature of the data was the observation that the direction of velocity vectors varied significantly within the 250-image stacks. This implies either that the cells both push or pull on the surrounding 3D matrix fibers within a relatively short period of time, or they do one or the other in a cyclic fashion (Fig. 1E).
After validating the STICS method in the context of capillary morphogenesis, we examined how changes in fibrin matrix density affect the rates at which ECs displace individual ECM elements and the effects of over-expressing constitutively-active (V14) and dominant-negative (N19) forms of RhoA in the ECs. (ECs expressing GFP were used as a vector control). We focused on areas of the ECM immediately adjacent to the tips of the vessels of interest, and tabulated average velocity moduli. The rates at which the ECs displaced individual ECM fibers depended heavily on fibrin concentrations, initially increasing as matrix density was increased from 1.0 mg ml−1 to 2.5 mg ml−1, and then decreasing as the matrix density was increased further to 5 and 10 mg ml−1 (Fig. 2; see also Fig. 4A). In 3D cultures containing ECs expressing V14-RhoA, ECM velocities were significantly elevated relative to wild-type controls; by contrast, those containing ECs expressing N19-RhoA showed significant reductions in ECM velocities (Fig. 2). These effects were similar in all fibrin concentrations. Cells expressing GFP alone displaced the ECM no differently than wild-type cells. Representative videos of raster scanned image stacks for tissue constructs containing ECs infected with each of the adenoviral vectors in 2.5 mg ml−1 fibrin are shown in the Supplementary Information (ESI†, Movie S1, A–C). Similar data were also acquired for tissue cultures treated with contractile inhibitors; constructs in which cell-generated forces were inhibited with BDM, ML-7, Y27632, or blebbistatin exhibited lower displacement rates of individual ECM elements compared to untreated controls (ESI†, Fig. S2).
Fig. 2.

STICS analysis of average matrix displacement velocity surrounding vessel tips in (A) 1.0 mg ml−1; (B) 1.5 mg ml−1;(C) 2.0 mg ml−1; (D) 2.5 mg ml−1; (E) 5 mg ml−1; (F) 10 mg ml−1 3D fibrin tissues and analyzed at day 6. The x-axis labels indicate the type of HUVECs used in the assay, with “C” = wild type controls, “V14” = cells expressing constitutively active V14-RhoA, “N19” = cells expressing dominant negative N19-RhoA, and “GFP” = cells expressing GFP (as a sham control). For each graph, N = 3. The error bars represent standard deviation, with the asterisks indicating statistical significance (p < 0.05) between the marked test sample and the wild type control.
Fig. 4.
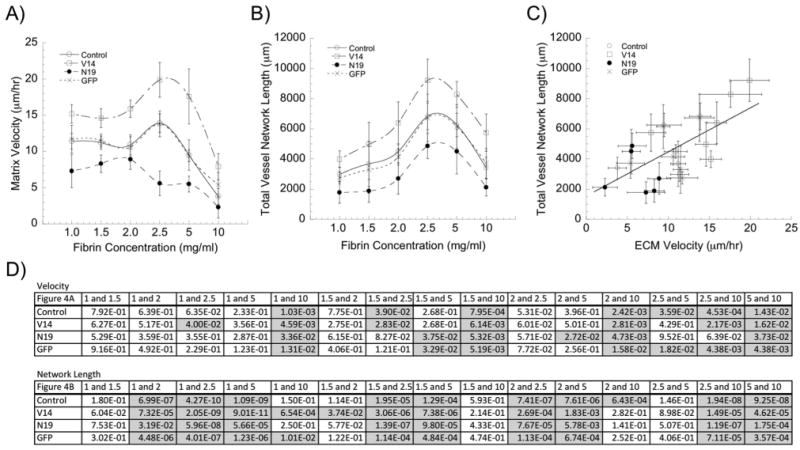
Matrix displacement rates correlate with the extent of angiogenic sprouting. (A) Matrix displacement rates are modulated by alterations in RhoA activity, and are typically maximized in 2.5 mg ml−1 fibrin gels (except in the ECs expressing N19-RhoA). (Data replotted from Fig. 3; statistics represented therein). (B) Total vessel network lengths are similarly modulated by alterations in RhoA activity, and are maximized in 2.5 mg ml−1 fibrin gels. (Data replotted from Fig. 4; statistics represented therein). (C) Combining these data reveals a positive correlation between the rates of matrix deformation and the extent of capillary sprouting. (D) Significance tables showing the p-values for each pairwise comparison within a given EC group (control, V14, N19, and GFP) across the range of fibrin concentrations (significant differences are shaded gray).
Rates of ECM displacement correlate with angiogenic vessel sprouting
To better understand how ECM displacement rates might relate to the overall outcome of capillary morphogenesis, we quantified the magnitude of capillary formation in our assay as a function of fibrin concentration and with ECs expressing mutant forms of RhoA. Across all matrix conditions, the trends show that capillary morphogenesis achieved by ECs over-expressing V14-RhoA was greater than that achieved by wild-type cells, with significant increases in 2, 2.5, 5, and 10 mg ml−1 fibrin gels (Fig. 3A–F). By contrast, morphogenesis decreased in cultures containing ECs expressing N19-RhoA, with significant reductions relative to wild-type cells in a subset of matrix compositions (Fig. 3A–F). Cells expressing GFP alone formed capillary networks to the same extent as wild-type cells. Furthermore, consistent with our published results,12,13 increasing fibrin concentration from 2.5 to 10 mg ml−1 caused a significant reduction in capillary sprouting (Fig. 3D–F; see also Fig. 4B and D). However, perhaps unexpectedly, fibrin concentrations lower than 2.5 mg ml−1 also caused significant reductions in capillary sprouting (Fig. 3A–C; see also Fig. 4B and D).
Fig. 3.

Quantification of total capillary network lengths by wild-type ECs (control) and ECs expressing V14-RhoA, N19-RhoA and empty vector GFP in (A) 1.0 mg ml−1; (B) 1.5 mg ml−1; (C) 2.0 mg ml−1; (D) 2.5 mg ml−1; (E) 5.0 mg ml−1; (F) 10 mg ml−1 3D fibrin tissues; N = 10 for each data point, error is represented as standard deviation, asterisk indicates statistical significance between associated control and test sample, such that p < 0.05.
When these macroscale metrics of morphogenesis were combined with the microscale STICs data shown in Fig. 2 and simply replotted, the data reveal that the fibrin concentration at which the rate of cell-mediated ECM deformation is maximized (Fig. 4A) is the same concentration found to be most optimal for angiogenic sprouting (Fig. 4B). The combination of the data reveals a positive and somewhat linear correlation between the rates of matrix deformation and the extent of capillary sprouting (Fig. 4C). Pairwise statistical comparisons for both ECM deformation rates and total network lengths as a function of ECM concentration for each EC condition (control, V14, N19, and GFP) are shown in tabular form in Fig. 4D, with significant differences (p < 0.05) highlighted in gray.
ECM Velocities are a function of vessel proximity and location
To define the limits within which the EC-generated contractile forces can propagate through the ECM, we again applied STICS to investigate the dependence of ECM velocity on vessel proximity and location relative to the vessel tip. These experiments were limited to the optimal 2.5 mg ml−1 matrices. The imaged regions spanned larger areas around the vessel tips as well as ECM lateral to the vessel stalks (Fig. S3A-B). Each set of images was divided into four quadrants, or fragments, which were then analyzed separately to make the STICs computations more tractable (Fig. S3A-B). In tissue constructs containing ECs expressing the mutant forms of RhoA, the results mirror those obtained only by looking proximal to the sprouting tips (Fig. 2). Specifically, the rates of ECM deformation lateral to the vessel stalks were highest in fragment 1 (closest to the vessel tip), elevated in conditions containing ECs expressing V14-RhoA, and diminished when ECs expressed N19-RhoA. The rates of ECM deformation dropped off significantly as the distance from the vessel tip increased (Fig. S3C). Similarly, ECM velocities decreased significantly as the distance from the vessel tip increased from fragment 4 to fragment 1 (Fig. S3D). These data suggest that the EC-generated contractile forces propagate into the surrounding ECM up to at least 200 μm (the size of the image analyzed in this part of the study). ECM displacements were observed even in locations lateral to the vessel stalk, suggesting significant cell-ECM interactions along the entirety of the vessel.
Microrheology reveals local stiffening of the matrix near the tips of sprouting capillaries
Finally, to complement our STICS-based methodology, we also utilized laser tweezers-based active microrheology (AMR) to quantify local changes in the mechanical properties of the ECM during the process of capillary morphogenesis. We first performed macroscale shear rheology to confirm that increasing the fibrin matrix density across the range from 1 to 10 mg ml−1 increased the bulk mechanical properties of our gels. As expected, the shear elastic modulus, G′, of the gels increased monotonically as the fibrin content of the gels increased (Fig. 5A). We then performed AMR experiments only in the 2.5 mg ml−1 fibrin gels based on our data showing this concentration optimally supported capillary sprouting (Fig. 4). The AMR methodology yielded two interesting results. First, the data showed that the presence of the cells significantly increased the baseline shear elastic modulus (G′) of the fibrin matrix (Fig. 5B), with values in the range from 100–700 Pa. By comparison, macroscale shear rheology of acellular gels showed that 2.5 mg ml−1 acellular fibrin gels have a shear elastic modulus of about 25 Pa (Fig. 5A). We have previously shown that the G′ values of acellular 2.5 mg ml−1 fibrin gels obtained from AMR are not statistically different than those obtained by macroscale shear rheology;21 therefore, we attribute the observed differences in G′ to pre-stress imposed by the presence of the cells, rather than due to differences in the scale of the two different measurements. Second, we observed significant differences in the magnitudes of the local shear elastic moduli of fibrin gels depending on the proximity of the measurements to the sprouting capillaries (Fig. 5B), with mean values of G′ close to the vessellike structures nearly 2x higher than those values obtained from locations more than 500 μm away from a nascent sprout. This latter observation suggests a very significant pericellular stiffening of the ECM proximal to the tips of the sprouting capillaries.
Fig. 5.

(A) Characterization of the macroscopic rheological properties of fibrin gels as a function of their concentration. The shear elastic (G′) and viscous (G″) moduli both increase with increasing fibrin concentration. N = 5 samples for each concentration; error is represented as standard deviation. All data points within a given data set (i.e., all G′ values) are significantly different from each other (p ≪ 0.01). (B) Active microrheology (AMR) in 2.5 mg ml−1 fibrin gel capillary morphogenesis model used to report local stiffness, G′, near to (<20 μm) and far from (> 500 μm) capillary tips. Each point is the averaged G′ value of one bead oscillated through a range of frequencies (5, 10, 20, 50, 75, and 100 Hz). G′ is calculated by tracking the bead's movement when a focused laser trap oscillates the bead at an amplitude of 60 nm at different frequencies. The solid lines represent the mean values of G′, which are highly significantly different (p = 8.74e-05).
Discussion
Endothelial cell-generated tractional forces, balanced by the ECM's resistance to those forces, have long been proposed to modulate angiogenesis.7 There is now strong experimental evidence to support this hypothesis, with traction forces linked to endothelial cell branching,27 the formation of capillary-like structures,8,9,15 and the transcriptional control of soluble proangiogenic molecules.28 In recent years, it has also been fairly well established that ECM physical property changes correlate with changes in single cell phenotype.29,30 However, most studies have relied on bulk mechanical property measurements to characterize the ECM, while only a few have attempted to characterize the local properties of the cell-ECM interface. In this study, we utilized a combination of methods to quantitatively investigate the local dynamics of the cell-ECM interface during angiogenic sprouting in a 3D ECM.
The first method we used, spatio-temporal image correlation spectroscopy, enabled the locations of individual matrix elements to be tracked as a function of time. This time- and position-dependent information provided quantification of the rates at which individual matrix fibers were displaced due to traction forces generated by sprouting ECs. We chose day 6 for our STICS analysis because there was sufficient vessel development in all conditions by this time point. The sprouting vessel tips were adequately separated from the microcarrier beads and could therefore be imaged and analyzed without the actual beads disrupting the measurements. Furthermore, ECs in this assay are actively forming capillaries at this time point, as we have shown previously.12,13,15 This is reinforced by the data in Fig. 3, which show that the total vessel network lengths across all matrix conditions more than double from day 6 to day 9. Combining STICS with our total network length metric of capillary morphogenesis revealed a surprising, and previously unobserved, correlation: that maximal capillary sprouting occurs in matrices that can be most rapidly displaced by cells. Particularly notable was the fact that maximal capillary sprouting (quantified on a millimeter length scale) and maximal matrix deformation rates (quantified on a micron length scale) occurred in fibrin gels whose concentration closely matched the physiological conditions found in native fibrin clots.19
This positive correlation between maximal sprouting and matrix deformation rates was identified by performing complementary experiments in which either cell generated tractional forces or the ECM's resistance to those forces was modulated. Tractional force generation was manipulated either genetically by expressing mutant forms of RhoA or pharmacologically through the use of several small molecule inhibitors of contractility. ECs expressing constitutively active RhoA reproducibly displayed increased capillary formation across a range of ECM conditions (as measured by total network length) when compared to wild-type controls (Fig. 3). By contrast, ECs expressing dominant negative RhoA showed reduced capillary morphogenesis. We have previously shown that inhibiting contractile force generation pharmacologically disrupts capillary growth and stability.15 The data here show that ECs expressing V14-RhoA displace the ECM at significantly faster rates than do wild-type or GFP-sham controls (Fig. 2). Cells expressing N19-RhoA (Fig. 2) and those treated with contractile inhibitors (Fig. S2, ESI†) showed reduced matrix displacement rates across all ECM conditions, with significant differences relative to control cells in a subset of conditions.
The ECM's mechanical resistance to cell generated tractional forces was modulated by varying the density of the fibrin gels (Fig. 5A). Optimal angiogenic sprouting and maximal rates of ECM displacement occurred in 2.5 mg ml−1 fibrin gel constructs. In lower density gels, angiogenic sprouting and the rates of ECM displacement were reduced; similar reductions were observed in gel concentrations above this 2.5 mg ml−1 threshold (Fig. 4). This same type of biphasic dependency was previously reported in 2D cell migration studies.31 Two possible explanations may account for the results in lower density gels. Either these mechanically weaker gels do not provide sufficient mechanical resistance to the cell-generated forces, or they lack sufficient cell binding sites to promote the formation and maintenance of the capillary networks. In the higher density gels, which are both mechanically stronger and theoretically provide an increased number of adhesive binding sites, diffusion limits imposed by the increased numbers of fibrin fibers may also play a significant role in decreased vessel formation.12 Our current study cannot discern between these different possibilities, but did not aim to do so, in part because these parameters are also lumped together in native clots in vivo. Instead, the positive correlation identified here between local matrix deformation rates on the microscale and morphogenesis on the macroscale suggests that both softer and stiffer matrices may be incapable of supporting maximal capillary sprouting in part because the rates at which cells displace them are suboptimal.
We also used the STICS methodology to characterize the distance over which EC-generated tractional forces can propagate within the surrounding ECM. Our data clearly indicate that as the distance from the side of the vessel and in front of the vessel tip is increased, the matrix displacement rates fall off significantly within the first 200 mm (Fig. S3). A recent study by Winer et al. demonstrated that tractional stress exerted on the ECM by a single cell can create a local ECM stiffness gradient and provide a means for mechanical interaction with other cells up to 5 cell lengths from their periphery.32 The distances over which EC-generated tractional forces propagate are of a similar magnitude. However, our current experimental set-up limits the amount of area surrounding the vessel that can be imaged and subjected to STICS. Analyzing greater areas might allow the actual propagation limit to be better pinpointed.
The STICS analysis utilized here was also limited to images generated from a single plane. Using 2D fibronectin-modified polyacrylamide gels substrates, Maskarinec et al. showed that cell-induced displacements in the z direction can be comparable to, or greater than, those in the xy plane.33 Thus, characterizing the movement of the matrix surrounding the entirety of the vessel in x, y, and z planes could conceivably provide even more insights regarding the role of cell-ECM mechanics, but implementing STICS in 3D is computationally challenging.
Complementing STICS, our experiments using AMR revealed a significant pericellular stiffening of the ECM proximal to the sprouting capillary-like structures (Fig. 5B). Gjorevski and Nelson reported something similar in the context of mammary epithelial morphogenesis, showing that branching initiates from sites of high mechanical strain.34 However, translating metrics of strain into measures of stress requires some simplifying assumptions about the mechanical properties of the matrix, many of which may be incorrect for fibrillar matrices derived from naturally-occurring biopolymers (e.g., Matrigel, collagen, fibrin). The most common assumption is that the ECM behaves largely in a homogeneous fashion. However, our AMR data here, sampling multiple different beads within a given gel, reveal that the local viscoelastic properties are highly heterogeneous (as demonstrated by the range of values in Fig. 5B). One approach to overcoming this issue is to use an amorphous synthetic gel whose properties are much more homogeneous. A recent study by Legant, et al. did just that, translating bead displacements in a 3D hydrogel with well-defined elastic properties into tractional forces and essentially achieving 3D traction force microscopy.35 However, our approach using AMR enables the local mechanical properties of individual filaments within a 3D ECM to be directly measured, an essential step towards achieving 3D traction force microscopy in fibrillar ECMs. In the future, we envision combining STICS (to quantify strain imposed by cells on the ECM) with AMR (to quantify local G′) to quantitatively assess the distribution of cell-generated stresses during capillary morphogenesis, without the need for any simplifying assumptions.
Finally, it is important to acknowledge that we have simplified this study by ignoring the impact of cell-mediated ECM remodeling on matrix deformation rates and local mechanical properties. We have previously examined the role of matrix remodeling in more detail in previous studies.13,15,36,37 Here, we chose to focus on a single time point, rather than assessing how these local matrix properties evolve as a function of culture time. Importantly, combining STICS and AMR in a future longitudinal study will enable us to better understand how local ECM remodeling alters the mechanical microenvironment in which a cell resides, something that existing macroscale methods cannot provide.
Conclusions
In conclusion, this study used a sensitive image correlation method and micro-scale rheology to quantitatively monitor ECM displacements and local mechanical properties within a 3D tissue during the complex multicellular process of capillary morphogenesis. The first of these methods uncovered a multiscale correlation linking fibrin concentration, cell-generated matrix displacement rates, and capillary sprouting, while the second revealed significant local stiffening of the ECM near the tips of the nascent capillaries. Quantifying the local mechanical information content of the cell-ECM interface in both space and time using the approaches developed here may enable the mechanochemical regulation of other complex morphogenetic processes in 3D to be carefully and systematically characterized.
Supplementary Material
Insight, innovation, integration.
The ECM's mechanical resistance to cell-generated forces is important for morphogenesis, but characterizing the mechanical interactions between cells and their environment in three-dimensional (3D) tissue models on a length scale relevant for cells has been technologically challenging. Here, we integrate a 3D in vitro model of angiogenesis with two innovative optical imaging methodologies. With the first, we discovered that when ECs displaced individual elements of the ECM via tractional forces at maximal rates, the overall lengths of capillary sprouts were also maximized. The second showed that ECs locally stiffen their surroundings during capillary morphogenesis. These insights underscore the importance of quantifying the mechanical dynamics of the cell-ECM interface, rather than focusing solely on the ECM's static mechanical properties.
Acknowledgments
We thank Dr Christopher Hughes (UC Irvine) for supplying fresh umbilical cords; Dr Christopher Chen (University of Pennsylvania) for the RhoA adenoviral constructs; and Abhishek Kurup for assistance with microrheology. Funding was provided by NIH R01-HL085339 (A.J.P.), NIH P41-RR003155 (E.G.), NIH P50-GM076516 (E.G.), NIH U54 GM064346 (Cell Migration Consortium grant to M.D. and E.G.), and the NSF (CAREER Award CBET-0968216 to A.J.P. and DMR-0805164 to E.B. and A.J.P.). E.K. was partially supported by a fellowship from the American Heart Association (0815322F).
Footnotes
Electronic supplementary information (ESI) available: See DOI: 10.1039/c2ib00120a
Published as part of an iBiology themed issue entitled “From Single Cells to Biology” Editors: Dr Mina Bissell, Distinguished Scientist, and Prof Luke Lee.
References
- 1.Carmeliet P. Nat Med. 2003;9:653–660. doi: 10.1038/nm0603-653. [DOI] [PubMed] [Google Scholar]
- 2.Lo CM, Wang HB, Dembo M, Wang YL. Biophys J. 2000;79:144–152. doi: 10.1016/S0006-3495(00)76279-5. [DOI] [PMC free article] [PubMed] [Google Scholar]
- 3.Reinhart-King CA, Dembo M, Hammer DA. Biophys J. 2005;89:676–89. doi: 10.1529/biophysj.104.054320. [DOI] [PMC free article] [PubMed] [Google Scholar]
- 4.Shiu YT, Li S, Marganski WA, Usami S, Schwartz MA, Wang YL, Dembo M, Chien S. Biophys J. 2004;86:2558–2565. doi: 10.1016/S0006-3495(04)74311-8. [DOI] [PMC free article] [PubMed] [Google Scholar]
- 5.Hoang MV, Whelan MC, Senger DR. Proc Natl Acad Sci U S A. 2004;101:1874–1879. doi: 10.1073/pnas.0308525100. [DOI] [PMC free article] [PubMed] [Google Scholar]
- 6.Bayless KJ, Davis GE. J Biol Chem. 2004;279:11686–11695. doi: 10.1074/jbc.M308373200. [DOI] [PubMed] [Google Scholar]
- 7.Ingber DE, Folkman J. Cell. 1989;58:803–805. doi: 10.1016/0092-8674(89)90928-8. [DOI] [PubMed] [Google Scholar]
- 8.Sieminski AL, Hebbel RP, Gooch KJ. Exp Cell Res. 2004;297:574–584. doi: 10.1016/j.yexcr.2004.03.035. [DOI] [PubMed] [Google Scholar]
- 9.Deroanne CF, Lapiere CM, Nusgens BV. Cardiovasc Res. 2001;49:647–658. doi: 10.1016/s0008-6363(00)00233-9. [DOI] [PubMed] [Google Scholar]
- 10.Vailhe B, Lecomte M, Wiernsperger N, Tranqui L. Angiogenesis. 1998;2:331–344. doi: 10.1023/a:1009238717101. [DOI] [PubMed] [Google Scholar]
- 11.Griffith CK, Miller C, Sainson RC, Calvert JW, Jeon NL, Hughes CC, George SC. Tissue Eng. 2005;11:257–266. doi: 10.1089/ten.2005.11.257. [DOI] [PubMed] [Google Scholar]
- 12.Ghajar CM, Chen X, Harris JW, Suresh V, Hughes CC, Jeon NL, Putnam AJ, George SC. Biophys J. 2008;94:1930–1941. doi: 10.1529/biophysj.107.120774. [DOI] [PMC free article] [PubMed] [Google Scholar]
- 13.Ghajar CM, Blevins KS, Hughes CCW, George SC, Putnam AJ. Tissue Eng. 2006;12:2875–2888. doi: 10.1089/ten.2006.12.2875. [DOI] [PubMed] [Google Scholar]
- 14.Chen X, Aledia AS, Ghajar CM, Griffith CK, Putnam AJ, Hughes CC, George SC. Tissue Eng A. 2009;6:1363–1371. doi: 10.1089/ten.tea.2008.0314. [DOI] [PMC free article] [PubMed] [Google Scholar]
- 15.Kniazeva E, Putnam AJ. Am J Physiol: Cell Physiol. 2009;297:179–187. doi: 10.1152/ajpcell.00018.2009. [DOI] [PubMed] [Google Scholar]
- 16.Kniazeva E, Kachgal S, Putnam AJ. Tissue Eng A. 2011;17:905–14. doi: 10.1089/ten.TEA.2010.0275. [DOI] [PMC free article] [PubMed] [Google Scholar]
- 17.Nehls V, Drenckhahn D. Microvasc Res. 1995;50:311–322. doi: 10.1006/mvre.1995.1061. [DOI] [PubMed] [Google Scholar]
- 18.Tonnesen MG, Feng X, Clark RAF. J Invest Dermatol Symp Proc. 2000;5:40–46. doi: 10.1046/j.1087-0024.2000.00014.x. [DOI] [PubMed] [Google Scholar]
- 19.Weisel JW. Science. 2008;25:456–457. doi: 10.1126/science.1154210. [DOI] [PubMed] [Google Scholar]
- 20.Rossow MJ, Mantulin WW, Gratton E. J Biomed Opt. 2009;14:024014. doi: 10.1117/1.3088203. [DOI] [PMC free article] [PubMed] [Google Scholar]
- 21.Kotlarchyk MA, Shreim SG, Alvarez-Elizondo MB, Estrada LC, Singh R, Valdevit L, Kniazeva E, Gratton E, Putnam AJ, Botvinick EL. PLoS One. 2011;6:e20201. doi: 10.1371/journal.pone.0020201. [DOI] [PMC free article] [PubMed] [Google Scholar]
- 22.Ishizaki T, Uehata M, Tamechika I, Keel J, Nonomura K, Maekawa M, Narumiya S. Mol Pharmacol. 2000;57:976–983. [PubMed] [Google Scholar]
- 23.Ostap EM. J Muscle Res Cell Motil. 2002;23:305–308. doi: 10.1023/a:1022047102064. [DOI] [PubMed] [Google Scholar]
- 24.Saitoh M, Ishikawa T, Matsushima S, Naka M, Hidaka H. J Biol Chem. 1987;262:7796–7801. [PubMed] [Google Scholar]
- 25.Kovacs M, Toth J, Hetenyi C, Malnasi-Csizmadia A, Sellers JR. J Biol Chem. 2004;279:35557–35563. doi: 10.1074/jbc.M405319200. [DOI] [PubMed] [Google Scholar]
- 26.Hebert B, Costantino S, Wiseman PW. Biophys J. 2005;88:3601–3614. doi: 10.1529/biophysj.104.054874. [DOI] [PMC free article] [PubMed] [Google Scholar]
- 27.Fischer RS, Gardel M, Ma X, Adelstein RS, Waterman CM. Curr Biol. 2009;19:260–265. doi: 10.1016/j.cub.2008.12.045. [DOI] [PMC free article] [PubMed] [Google Scholar]
- 28.Mammoto A, Connor KM, Mammoto T, Yung CW, Huh D, Aderman CM, Mostoslavsky G, Smith LEH, Ingber DE. Nature. 2009;457:1103–1108. doi: 10.1038/nature07765. [DOI] [PMC free article] [PubMed] [Google Scholar]
- 29.Engler A, Sen S, Sweeney H, Discher D. Cell. 2006;126:677–689. doi: 10.1016/j.cell.2006.06.044. [DOI] [PubMed] [Google Scholar]
- 30.Huebsch N, Arany P, Mao A, Shvartsman D, Ali O, Bencherif S, Rivera-Feliciano J, Mooney D. Nat Mater. 2010;9:518–526. doi: 10.1038/nmat2732. [DOI] [PMC free article] [PubMed] [Google Scholar]
- 31.Peyton SR, Putnam AJ. J Cell Physiol. 2005;204:198–209. doi: 10.1002/jcp.20274. [DOI] [PubMed] [Google Scholar]
- 32.Winer JP, Oake S, Janmey PA. PLoS One. 2009;4:6382. doi: 10.1371/journal.pone.0006382. [DOI] [PMC free article] [PubMed] [Google Scholar]
- 33.Maskarinec SA, Franck C, Tirrell DA, Ravichandran G. Proc Natl Acad Sci U S A. 2009;106:22108–22113. doi: 10.1073/pnas.0904565106. [DOI] [PMC free article] [PubMed] [Google Scholar]
- 34.Gjorevski N, Nelson CM. Integr Biol. 2010;2:424–34. doi: 10.1039/c0ib00040j. [DOI] [PMC free article] [PubMed] [Google Scholar]
- 35.Legant W, Miller J, Blakely B, Cohen D, Genin G, Chen C. Nat Methods. 2010;7:969–971. doi: 10.1038/nmeth.1531. [DOI] [PMC free article] [PubMed] [Google Scholar]
- 36.Ghajar CM, Kachgal S, Kniazeva E, Mori H, Costes SV, George SC, Putnam AJ. Exp Cell Res. 2010;316:813–25. doi: 10.1016/j.yexcr.2010.01.013. [DOI] [PMC free article] [PubMed] [Google Scholar]
- 37.Kachgal S, Putnam AJ. Angiogenesis. 2011;14:47–59. doi: 10.1007/s10456-010-9194-9. [DOI] [PMC free article] [PubMed] [Google Scholar]
Associated Data
This section collects any data citations, data availability statements, or supplementary materials included in this article.