

Abstract
NK cells recognize virus-infected cells with germline-encoded activating and inhibitory receptors that do not undergo genetic recombination or mutation. Accordingly, NK cells are often considered part of the innate immune response. The innate response comprises rapid early defenders that do not form immune memory. However, there is increasing evidence that experienced NK cells provide increased protection to secondary infection, a hallmark of the adaptive response. In this study, we compare the dynamics of the innate and adaptive immune responses by examining the kinetic profiles of the NK and T cell response tomurine CMV infection. We find that, unexpectedly, the kinetics of NK cell proliferation is neither earlier nor faster than the CD4 or CD8 T cell response. Furthermore, early NK cell contraction after the peak of the response is slower than that of T cells. Finally, unlike T cells, experienced NK cells do not experience biphasic decay after the response peak, a trait associated with memory formation. Rather, NK cell contraction is continuous, constant, and returns to below endogenous preinfection levels. This indicates that the reason why Ag-experienced NK cells remain detectable for a prolonged period after adoptive transfer and infection is in part due to the high precursor frequency, slow decay rate, and low background levels of Ly49H+ NK cells in recipient DAP12-deficient mice. Thus, the quantitative contribution of Ag-experienced NK cells in an endogenous secondary response, with higher background levels of Ly49H+ NK cells, may be not be as robust as the secondary response observed in T cells.
It is common in immunology to classify leukocytes into functional or phenotypic subsets when describing the immune response against infection. One of the most general of these classifications is a leukocyte’s contribution to the innate or adaptive immune response (1). Classic features of the innate immune response are: 1) rapid activation; 2) high precursor frequency; 3) germline-encoded receptors; and 4) the absence of immune memory. Thus, innate responses are typically rapid, stereotyped responses to infection that may act to slow early pathogen spread and prime the adaptive response (2). In contrast, the defining feature of the adaptive response is acquired protection. This is achieved by forming immunological memory, which provides an improved response against pathogens to which the host has previously been exposed. In addition to this, the adaptive response is often slow and delayed (when compared with the innate). This slow response is at least in part attributable to the extremely low precursor frequency of cells able to respond to any given pathogen. This low precursor frequency is in turn due to the large diversity of Ag receptors, produced by a recombination mechanism that produces high specificity, at the cost of low frequency (3–5).
Historically, the innate and adaptive classifications were considered as mutually exclusive. However, as functional capabilities become clearer, there are an increasing number of lymphocytes that display both innate and adaptive characteristics. For example, γ-δ T cells have innate functionality such as Ag presentation (6, 7) and the ability to recognize nonpeptide structures (8). However, their Ag receptor is generated via V(D)J recombination, and they have been shown to form immunological memory (9). Similarly, NKT cells recognize nonpeptide structures and use a stereotyped receptor produced by TCR recombination. Like γ-δ T and NKT cells, many lymphocytes are now considered to be both innate-like and adaptive-like, including CD8αα T cells, B1 B marginal cells, and marginal zone B cells (10).
NK cells are traditionally considered part of the innate immune response because they bear germline-encoded receptors and exist at relatively high precursor frequencies (compared with Ag-specific T cells). NK cells are important for the clearance of altered cells such as tumor cells and virus-infected cells. Unlike activation of the adaptive response, which requires a receptor recognizing an MHC– peptide complex, NK cell activation is mediated by an array of activating and inhibitory receptors (11, 12). Different combinations and expression levels of these receptors produce some level of selection and specificity in response to different targets (13–15). It follows that NK cell specificity can be described as a repertoire of these receptors. However, unlike TCRs, specificity is not derived from the presence of a single receptor, but rather a mixture of several receptors. Consistent with its classification as part of the innate system, NK cells have not been thought capable of generating immune memory. However, recent studies using a mouse adoptive transfer model suggest that transferred NK cells previously activated by cytokines or cognate recognition of ligand acquire effector functions more quickly than inexperienced naive NK cells and confer greater protection against pathogens, leading to the hypothesis that NK cells can form immunological memory (15–19).
Many features of the innate and adaptive response involve differences in the kinetics of the response to infection; the innate response is fast and does not form memory, whereas the acquired response is slow and leaves a pool of memory cells. Thus, we aim to compare the kinetics of the NK and T cell responses to murine CMV (MCMV) infection. We find that in contrast to our expectations, NK cells do not proliferate faster or earlier to MCMV infection than CD4 or CD8 T cells. But, the early contraction of NK cells after the peak of the response is slower than for CD4 and CD8 T cells. However, we also show that NK cells may not form a stable memory pool in the same way as T cells. This raises important questions about the nature of immune memory in the context of the high initial precursor frequency of NK cells.
Materials and Methods
Experimental data
The data analyzed have been previously published (19–21), and the reader is referred to the original publications for full details of the experimental protocols. Briefly, CD4 and CD8 T cells were collected from the lung, liver, and spleen of C57BL/6 mice various days postinfection with MCMV-Δm157. T cell populations are tracked with IFN-γ staining after stimulation with MCMV lysate (CD4 T cells) or peptides (CD4 and CD8 T cells) (21). In the endogenous NK dataset, NK cells were isolated from the spleen and liver of C57BL/6 mice various days postinfection with Smith strain MCMV (20). In this study, the inhibitory receptor killer cell lectin-like receptor G1 (KLRG1) was identified as a marker that can quantify the magnitude of the NK cell response to MCMV. As KLRG1+ to KLRG1− differentiation is minimal, it is also an appropriate marker to investigate NK contraction (20). As KLRG1 is also expressed on resting NK cells, the total KLRG1+ NK population also contains a background KLRG1+ NK cell population that may not be contributing to the response. Finally, in the adoptive transfer experiment, Ly49H+ NK cells were transferred from C57BL/6 CD45.1 congenic mice to recipient mice (that are DAP12-deficient [Tyrobp−/−], resulting in defective Ly49H receptor expression) that were subsequently infected with Smith strain MCMV. Transferred NK cells were then measured in the spleen and liver on various days postinfection.
Measuring growth and decay rates
Growth and decay rates are measured by performing a linear regression on the natural logarithm of the frequency of cells versus time. The average growth rate is calculated using all time points between and including the first day of measurement and the peak of the response. The average growth rate may be biased due to proliferation delay. To compensate for this, we calculate the growth rate between each pair of adjacent time points. The maximum of these rates is denoted as the fastest two-point growth rate. Similarly, the fastest two-point decay rate is the maximum decay rate measured between two adjacent time points. Both techniques of measuring growth and decay rates draw qualitatively identical conclusions, and for the sake of clarity, only the fastest two-point rates are presented in the figures. All growth and decay rates are calculated using the lm function in the r statistical computing software (version 2.7.1). Confidence intervals are calculated with r function confint.
Decay kinetics
To compare memory formation between NK cells, CD4 T cells, and CD8 T cells, we use three mathematical models of cell decay: exponential (total population decays to zero with constant t1/2), exponential with plateau (total population decays to nonzero level with constant t1/2), and biexponential (total population consists of two subpopulations, one with a fast and one with a slow t1/2) (Fig. 3). These models have equations as follows:
in which T is the total population of cells, A is the initial level of cells with decay rate r, P is the plateau level to which cell levels decay to in the exponential with plateau model, B is the initial level of cells with decay rate s, and t is time. Decay models were fit with the generalized least squares r function gnls in library nlme. The fit was weighted using var-Power. The three models are essentially nested versions of the complete biexponential model. Thus, we test which parameters give significantly better fits by using r function anova in like manner as an F test. This determines whether a more complicated model fits significantly better to justify the additional parameters. T cells responding to some MCMV peptides experience memory inflation (22–25), and this may decrease the virus-specific T cell decay rate measured after the peak. To minimize the effect of memory inflation, we remove the final data point (usually at day 351 postinfection) when its average value is over three times that of the previous data point (generally day 28 postinfection). This is a conservative approach so that T cell decay is not underestimated and does not affect the conclusions drawn in this paper.
FIGURE 3.
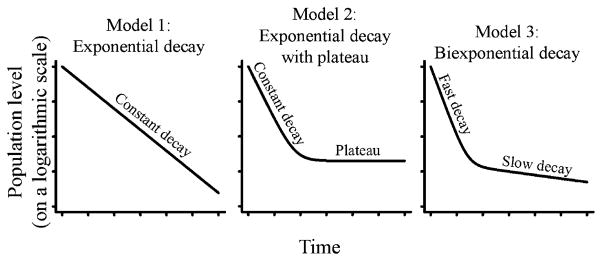
Decay profiles. Three possible models of decay and describe population contraction. Model 1, The population contraction to zero levels with constant t1/2. As the population will approach zero levels, this decay model is not indicative of stable memory formation. Model 2, The population contracts to nonzero levels with constant t1/2. If the plateau is higher than background levels, this indicates a stable memory population has formed. Model 3, Biphasic decay in which the total population consists of two subpopulations, one with a fast and one with a slow t1/2. This decay is indicative of a fast effector decaying population and a slowly decaying memory population.
Results
T cell growth kinetics in MCMV infection
To establish a basis for comparison of the NK cell response, we first studied the kinetics of CD4 and CD8 T cells. We analyzed the data from published work tracking the T cell populations in C57BL/6 mice postinfection with MCMV (21). The T cell populations are tracked with IFN-γ staining after stimulation with MCMV lysate (CD4 T cells) or peptides (CD4 and CD8 T cells). T cell frequencies (after background subtraction) are used for kinetic analysis. The CD4 T cell population in the lung and liver expand to their population peak on day 6 and 7, respectively, after which they begin to contract. The CD4 T cell kinetics of the spleen are less clear. Splenic CD4 T cells measured with MCMV lysate stimulation expand to day 6, thereafter remaining stable until day 14 (rate of change not significantly different to zero; p = 0.204). In contrast, CD4 T cell levels measured via peptide stimulation (peptides M112P8, M142P6, M14P28, M25P133, and M25P71) have comparable population levels on days 4 and 6 (levels not significantly different; p > 0.1 for all peptides, t test), after which the populations begin to contract (Fig. 1A).
FIGURE 1.

Kinetic profiles of endogenous CD4+ T cells, endogenous CD8+ T cells, endogenous NK cells, and adoptively transferred NK cells. For the endogenous response, C57BL/6 mice were infected with MCMV and CD4+ T cell (A), CD8+ T cell (B), or NK cell (C) numbers tracked at various time points postinfection. MCMV specificity was determined via IFN-γ staining after stimulation with MCMV lysate (CD4+ T cells, filled upright triangles) or peptides (CD4+ and CD8+ T cells; the stimulating peptides are indicated). The endogenous NK cells responding to MCMV are tracked with KLRG1+ expression. D, For NK adoptive transfer studies, LY49H+ CD45.1 NK cells were transferred into C57BL/6 DAP12-deficient CD45.2 congenic mice, after which recipient mice were infected. The transferred NK cell population was tracked on various days postinfection.
To quantify the rapidity at which the CD4 T cells respond to MCMV infection, we calculated the growth rate of CD4 T cells in these tissues. The growth rate is measured during population expansion and quantifies the cumulative effect of population division, death, and migration in and out of the tissue. We find that the CD4 T cell population grows at an average rate (between day of first measurement and peak of response, the only two time points before the peak of the response in this dataset) of 2.28, 2.46, and 1.04 per day in the lung, liver, and spleen (lysate), respectively (corresponding to a population doubling time of 7.3, 6.8, and 16 h, respectively; Fig. 2A, Table I).
FIGURE 2.

Growth and decay rates for NK, CD8, and CD4 T cells. A, The fastest two-point growth rates for CD4 T cells, CD8 T cells, and NK cells in the lung, liver, and spleen for various MCMVAgs. The fastest two-point growth rate is the fastest growth rate observed between adjacent time points during population expansion. NK growth rates are calculated for an endogenous infection and for the adoptive transfer models of 104 and 105 cells per mouse. B, The fastest two-point decay rates for CD4 T cells, CD8 T cells, and NK cells in the lung, liver, and spleen for various MCMVAgs. The fastest two-point decay rate is the fastest decay rate observed between adjacent time points during population contraction.
Table I.
Population doubling times and t1/2
| Cell Type | Organ | Average Population Doubling Time (h) | Fastest Population Doubling Time (Using Two Points) (h) | Shortest t1/2 (Using Two Points) | Day 14–28 t1/2 (d) | Best Model of Decay |
|---|---|---|---|---|---|---|
| CD4 | Lung | 7.3 | 7.3 | 13 h | 9 | Model 2 and Model 3 |
| Liver | 6.8 | 6.8 | 14 h | 8.6 | Model 3 | |
| Spleen | 16 | 16 | 13 h | 36 | Model 2 | |
| CD8 | Lung | 7.5 | 6.2 | 14 h | 13.9 | Model 2 |
| Liver | 10 | 9.1 | 11 h | 6.9 | Model 3 | |
| Spleen | 12 | 10 | 16 h | 43 | Model 2 | |
| Endogenous NK | Liver | 32 | 23 | 40 h | 7.8 | Model 2 |
| Spleen | 49 | 46 | 48 h | 13.6 | Model 3 | |
| Transferred NK | Liver | 17 | 14 | 5.5 d | 5.5 | Model 1 |
| Spleen | 26 | 20 | 7.9 d | 8.1 | Model 1 |
We measure the average growth rate, fastest growth rate, fastest decay rate, and decay rate of latest common time points (day 14–28) of CD4 T cells, CD8 T cells, endogenous NK cells, and adoptively transferred NK cells. Average growth rates represent the growth rate measured over all days between the first day of measurement and the peak of the response. Fastest growth/decay rates represent the fastest growth/decay observed between two adjacent time points over entire response.
Similar to the CD4 T cell population, CD8 T cells expand to their population peak 7 d postinfection for both the lung and liver before beginning contraction. Splenic CD8 T cells expand to their population peak between 6 and 7 d postinfection and also begin contraction immediately afterward (Fig. 1B). We measure the average growth rate of CD8 T cells responding to MCMV infection to be 2.21, 1.67, and 1.39 per day in the lung, liver and spleen, respectively [corresponding to a population doubling time of 7.5, 10, and 12 h, respectively; times similar to previously published estimates (26, 27)] (Table I). We note that the different growth rates in different tissues suggest that there is not a perfect equilibration between different tissues during T cell expansion.
It is possible that by measuring the average slope between the first day of measurement and the peak of the response, the growth rate may be underestimated due to delays in population expansion. As there are additional time points between the first and peak days of the CD8 T cell response, we calculate the fastest two-point growth rate to overcome any possible bias from population expansion delay. This rate is the fastest growth rate observed between two adjacent time points and represents a maximal growth rate experienced by the population. We measure the fastest two-point growth rate for the CD8 T cell population to be 2.67, 1.83, and 1.64 per day in the lung, liver, and spleen, respectively (corresponding to a population doubling time of 6.2, 9.1, and 10 h; Fig. 2A, Table I). These rates were not significantly different from the average growth rates indicated above.
T cells decay to form a stable memory population
To quantify the contraction phase of the MCMV T cell response, we fit and compared three mathematical models of population decay. Model 1 is an exponential decay model. This model describes continuous decay in which the entire population shares a constant t1/2 (Fig. 3A). This model implies that the population will eventually die out. Model 2 is an exponential decay with plateau model. In this model, a proportion of the population decays at a continuous and constant rate (as in model 1), and the remainder do not experience decay at all (the plateau population) (Fig. 3B).
Model 2 can represent a decaying population returning to baseline levels or, when the plateau is higher than baseline, a decaying population forming memory. Model 3 is a two-phase exponential decay model. The model represents biphasic decay in which the total population is divided into two subpopulations, one quickly and one slowly decaying population (Fig. 3C). Although population levels in this model eventually approach zero, the slowly decaying (memory) population often prevents this from occurring during a reasonable time frame. Model 3 represents cell decay in which the fast decaying population represents effector cells that quickly die out. The slowly decaying population represents the formation of a slowly declining memory population. For all models, the decay rates measure the cumulative effect of population growth, death, and migration in and out of the tissues. The best fit between two models is decided by determining whether additional model complexity (parameters) is justified by the corresponding decrease in model error. Thus, for comparisons between two models, nonsignificant p values indicate the simpler model is more appropriate, whereas significant p values indicate the more complex model is more appropriate.
We first measure the maximum rate of contraction observed for CD4 T cells. We calculate the maximum two-point decay rate (t1/2) in each tissue. This represents the maximal decay rate observed during contraction. We find that on average CD4 T cells decay at a maximum rate of −1.24, −1.16, and −1.29 per day in the lung, liver, and spleen (for peptide stimulation), respectively (corresponding to a net t1/2 of 13, 14, and 13 h, respectively; Fig. 2B, Table I).
We next sought to determine the mathematical model of decay that best described the CD4 T cell population contraction. The CD4 population does not experience constant exponential decay (model 1). This is evident, as on a graph of CD4 T cell frequency (on a log scale) versus time, when the decay after the peak is nonlinear (Figs. 1A, 3). To determine the best-fitting decay model, we fit and compare a simple plateau model (model 2) and a more complex biexponential model (model 3) to the population data after (and including) the peak. As some T cell populations experience memory inflation after the acute response (23, 28), we exclude some late time points in which memory inflation is evident (see Materials and Methods section). We find that MCMV-specific CD4 T cell levels in the lung fit well to both model 2 (peptides M112P8, M14P28, M25P71, and MCMV lysate; p values for model 2 versus model 3 are 0.78, 0.07, 0.10, and 0.27, respectively; Table I) and model 3 (peptides M142P6 and M25P133; p values for model 2 versus model 3 are 0.03 and 0.02, respectively) of decay, indicating that some form of stable memory population is being formed. The splenic CD4 T cell population decays to a plateau (model 2), also indicating that a stable memory population has formed. The biexponential model fits the decaying population in the liver, indicating a slowly declining memory population has formed (Fig. 4).
FIGURE 4.

Representative decay model fits to data. We fit all of the three possible models (Fig. 3) of population decay to the experimental data after the peak of the response to determine which of these models best describes the data. More complex models must fit significantly better to justify the additional parameters to be considered the best fit. A representative plot of the fits for the lung, liver, and spleen (columns 1, 2, and 3, respectively), for CD4+ T cells, CD8+ T cells, endogenous NK cells, and adoptively transferred NK cells (rows 1, 2, 3, and 4, respectively) are shown. The title above each plot describes the model of best fit and/or the representative epitope shown. CD4+ T cells, CD8+ T cells, and endogenous NK cells fit well to both the exponential with plateau model and the biexponential model (models 2 and 3, respectively, from Fig. 3). Importantly, the endogenous NK cell population has returned to preinfection levels 20 d after the peak. The adoptively transferred NK cell population fits best to a simple exponential model (model 1 from Fig. 3).
To complete our study of the kinetics of the T cell immune response to MCMV, we investigate the CD8 T cell population decay. We measure the rapidity of contraction observed for CD8 T cells (maximum two-point decay) and find that on average CD8 T cells decay at a maximum rate of −1.17, −1.55, and −1.04 per day in the lung, liver, and spleen, respectively (corresponding to a net t1/2 of 14, 11, and 16 h, respectively; Fig. 2B).
Similar to the CD4 T cell population, CD8 T cell decay is not constant (model 1). Rather, CD8 T cell decay is consistent with memory formation. CD8 T cell levels plateau in the lung and spleen (model 2; p values >0.05 for model 2 versus model 3 comparison), and we find that this memory plateau is higher than the levels on the first day of measurement. The CD8 T cell population experiences biphasic decay (model 3; p values <0.05 for model 2 versus model 3 comparison) in the liver (Fig. 4).
The endogenous NK cell population decays to preinfection levels after acute infection
After MCMV infection, all NK cells initially experience cytokine-driven proliferation (29, 30). From 2 d onwards, NK proliferation is mostly restricted Ly49H+ NK cells recognizing m157 (29), a subset critical for MCMV viral control (31). To compare the CD4 and CD8 T cell kinetics against an endogenous NK cell response, we analyzed the data from Robbins et al. (20). In this study, liver and splenic NK cells were harvested from C57BL/6 mice postinfection with MCMV and analyzed for KLRG1 expression. Robbins et al. (20) argues that the kinetics of KLRG1+ NK cells (of which >96% are Ly49H+) reflect that of the responding NK population superimposed on the background level of KLRG1+ NK cells seen in uninfected mice and thus suitably characterize the expansion and contraction of the NK response to MCMV. Splenic NK cells, after an initial contraction to day 1.5 postinfection, expand and peak on day 7, similar to that of CD4 and CD8 T cells. The NK population in the liver peaks 2 d earlier on day 5 before beginning contraction (Fig. 1C). We next measured the average growth rate of the responding NK cells and find that this population experiences an average growth rate of 0.34 per day in the spleen and 0.52 per day in the liver (population doubling times of 49 and 32 h, respectively), which is on average slower than CD8 T cells in the spleen and liver and slower than CD4 T cells in the liver but not the spleen. To verify that these rates were not biased by delayed population expansion, we also calculated the fastest two-point growth rates. These rates were 0.36 per day in the spleen and 0.71 per day in the liver (population doubling times of 46 and 23 h, respectively, Table I) and not significantly different from that of the average rates (Fig. 2A).
We next measure the fastest decay experienced by the MCMV-specific NK cell population. We find that the responding NK cell population decays at a rate of −0.35 per day in the spleen and −0.42 per day in the liver (net t1/2 of 48 and 40 h, respectively; Table I), which is on average slower than both CD8 and CD4 T cells in these tissues. To decide whether the NK cell population is forming a stable memory population, we determine the mathematical model of decay that best describes the NK cell population contraction. We find that the best model of contraction is the biexponential model (model 3, comparison with model 2, p = 0.01) for the spleen and plateau model (model 2, comparison with model 3, p = 0.10) for the liver (Fig. 4). At first, this may suggest evidence for the formation of a stable memory NK population. However, unlike the CD4 and CD8 T cell data, the background frequency of KLRG1+ NK cells has not been subtracted. In fact, the NK cell population contracts to below initial (preinfection) levels in both the liver and spleen by day 28, implying that the NK cell population may just be returning to preinfection background levels.
The endogenous NK cell response does show memory-like decay after the peak of the response. However, as levels return to (below) their initial level, the endogenous response does not distinguish between the following three scenarios: 1) significant NK memory is forming, and this memory replaces the basal NK cell levels; 2) NK memory forms, but at a level low enough to be indistinguishable from initial NK cell levels; and 3) the KLRG1+ NK cells that respond to MCMV experience constant decay do not have preferential survival over naive KLRG1+ NK cells and do not form long-lived memory. To further distinguish between these scenarios, we study the kinetics of an adoptively transferred NK cell population after MCMV infection.
Adoptively transferred NK cells decay continuously after acute infection
In data from Sun et al. (19), wild-type Ly49H+ NK cells (CD45.1) were transferred into DAP12-deficient mice (CD45.2), and MCMV specificity was determined by Ly49H staining. As Ly49H is not expressed at high levels in NK cells from DAP12-deficient mice (32), there are few endogenous Ly49Hhi+ host NK cells to interfere with the transferred Ly49H+ NK cells. Thus, background levels will not interfere with the decay analysis, and it will be possible to distinguish between scenarios 1, 2, and 3 above.
The responding NK cell population peaks on day 7 in both the spleen and liver, similar to that of CD4 and CD8 T cells (Fig. 1D). We calculate the average growth rate of the adoptively transferred NK cells after MCMV infection and find that the Ly49H+ CD45.1+ population grew at a rate of 0.63 per day in the spleen and 0.99 per day in the liver (population doubling times 26 and 17 h, respectively). As with the endogenous NK response, this was on average slower than the CD4+ and CD8+ T cell populations in the liver, slower than the CD8+ T cell population in the spleen, and about the same for the CD4 T cell population in the spleen. We also calculate the fastest two-point growth rate to be on average 0.81 per day and 1.15 per day (population doubling times of 20 and 14 h, respectively); however, this was not significantly different from the average rates (Fig. 2A). Similar to the endogenous NK cell population, we measure the decay rates as −0.088 per day in spleen and −0.125 per day in liver (net t1/2 7.9 and 5.5 d, respectively; Table I), on average slower than that of the CD4 or CD8 T cell populations (Fig. 2B).
Unlike the CD4 and CD8 T cell populations, and unlike the endogenous NK cell response, the transferred NK cell population experiences constant, exponential decay after the peak as indicated by the linear relationship on a logarithmic scale (model 1, Fig. 4). As this decay is relatively slow, Ag-experienced NK cells remain detectable for at least 50 d postinfection. However, as the nature of the decay is constant, the presence of Ag-experienced NK cells long after the peak of the response may be in part due to the high precursor frequency of NK cells, as opposed to the specific, preferential survival of a subset of NK cells (which would have been indicated by biphasic decay). Our analysis does not exclude the possibility that some small population of NK cells (at levels <1% of the peak and <10% of the preinfection endogenous levels) is experiencing some level of preferential survival that is undetectable during this time frame.
To investigate the NK cell decay further, we calculate the decay rate of cells in all datasets between days 14 and 28 (the latest time period shared by all cell types) and find that CD4 T cells and CD8 T cells have a decay rate of −0.043 per day and −0.044 per day, respectively (approximate net t1/2 = 16 d). In contrast, the adoptively transferred NK cell decay rate during this period is −0.106 per day (net t1/2 = 6.5 d), faster than the CD4 T cell and CD8 T cell rates. However, this difference was only significant for CD4 T cells (CD4: p = 0.048, n = 10; CD8: p = 0.076, n = 6; NK: n = 6; t test with unequal variance). Thus, although NK cells initially decayed more slowly than T cells, by days 14–28, T cell decay had slowed, whereas NK cell decay remained constant. Therefore, the Ag-experienced NK cells decay at a faster rate than T cell memory. This decay rate is slow enough to allow the long-term detection of Ag-experienced NK cells in mice with artificially low background levels (DAP12-deficient mice). However, our decay analysis predicts that by day 50, the Ag-experienced NK population will have decayed to <10% of the endogenous naive preinfection level (Fig. 5). As Ag-experienced NK cells have similar proliferation kinetics to naive NK cells (19), their contribution to a secondary response may, from a purely quantitative perspective, be small after this time point.
FIGURE 5.
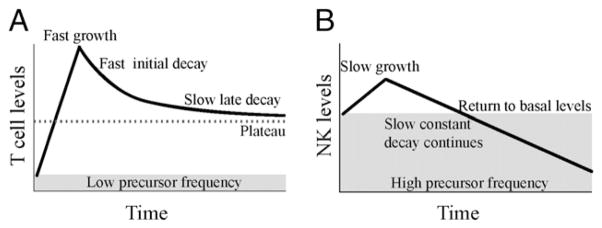
T cell and NK cell immune response kinetics. A, From a very low precursor frequency, T cells quickly expand to their population peak, after which the population begins to contract. T cell contraction is multiphasic, with a fast initial decay and either a slow late decay or plateau. The T cell memory population level is high compared with the naive precursor frequency, providing long-term protection. B, From a high precursor frequency (~40% of all NK cells), responding Ly49H+ NK cells slowly grow to their population peak, which occurs at around the same time as the peak in T cells. After this peak, the responding NK cell population experiences constant, continuous decay and quickly returns to below basal levels. As these Ag-experienced or memory NK cells continue to decay, they will eventually comprise an insignificant proportion of the basal NK levels. Thus, memory NK cells may only provide increased protection for the short term when compared with T cells.
Discussion
A major hallmark of the innate immune response is rapid reaction to infection and the absence of immunological memory. There is growing evidence that NK cells do form immunological memory (15, 16, 19); however, the nature of this memory is unclear. In this study, we observe that activated NK cells do not proliferate faster than T cells and that NK cell memory is not as long lived as that of T cells. The rate of NK cell growth appears slower than that of CD8+ T cells (although this was not significant for all epitopes) and not different from that of CD4 T cells. NK cell numbers also peaked around the same time as CD4 and CD8 T cell numbers. In the early phase of population decay after this peak, NK cells decay more slowly than T cells. However, whereas CD4 and CD8 T cells soon reach a plateau of constant or slowly declining T cell numbers, NK cells continue to decay at the same rate for a prolonged period. Additionally, after an endogenous response, NK cells quickly returned to preinfection levels, indicating that the longterm detection of memory NK cells may be in part due to the high precursor frequency of Ly49H+ NK cells and artificially low background levels in DAP-12 deficient mice. Consequently, the numerical contribution of Ag-experienced NK cells in an endogenous secondary infection, in mice with normal background levels of Ly49H+ NK cells, may be small.
Immunological memory in T cells has been shown to provide protection in a number of ways. These include faster acquisition of effector functions, high precursor frequencies, and greater proliferation potential or rapidity, although this last feature has been questioned (33, 34). However, effective long-term protection also relies on memory lymphocytes to form a stable or very slowly declining population. Thus, it is important to study and understand the kinetics of an acute immune response to infection. Sun et al. and others (15–17, 19) show that NK cells that have experienced infection have more robust activation and provide increased protection to pathogens. However, although experienced NK cells show increased function on a per-cell level, we show in this study that NK cells decay in a slow, but continuous manner and that the endogenous NK population quickly returns to preinfection levels (Fig. 5). Interestingly, recent work suggests that NK cells undergo extensive homeostatic expansion in RAG knockout, IL-2R knockout mice (35). These homeostatically expanded cells undergo a slight contraction and form a stable memory-like population by 30 d posttransfer in this environment. It is unclear whether this different memory behavior occurs as a result of the altered expansion dynamics (Ag-experienced NK cells may have a different survival from homeostatically expanded cells) or from the different host environment of wild-type versus RAG knockout, IL-2R knockout mice. Interestingly, homeostatic memory cells continue to decay out to day 60 after transfer into an irradiated wild-type C57/BL6 mice at a rate that appears similar to that seen in Ag-experienced cells (35). This suggests that the finite lifespan of Ag-experienced NK memory cells that we observe may be at least in part a function of competition with other lymphocytes in the host environment.
The role of this NK cell memory is unclear in the context of a high initial level of responding cells: for most T cell responses, the preinfection number of epitope-specific cells may be of the order of below 50–1000 in the spleen (36, 37). The memory population remaining postinfection may be 100–1000-fold greater than these preinfection levels, giving population growth a minimum 1-d advantage (using conservative estimates of a 4-h division time and 100-fold greater precursor level). However, in our endogenous dataset, the responding Ly49H+ NK cells constitute 40% of total NK cells in the uninfected mouse. Following infection and the acute response, the number of total KLRG1+ NK cells (consisting of responding and resting NK cells) drops below the preinfection level relatively quickly. Furthermore, the adoptive transfer model predicts that by 50 d postinfection, the Ag-experienced NK population will represent <10% of the endogenous naive NK cell preinfection level. Even if the NK cell memory population did plateau at this level, as they do not proliferate more quickly than naive NK cells (19), their proportional contribution to the response of a secondary infection may be small. Thus, although memory NK cells may be more active on a per-cell basis, their contribution to a secondary response may eventually wane due to the presence of so many naive NK cells.
An important caveat of our studies is that MCMV is a latent infection, and thus, the term “memory” should be used advisedly. Both the CD4 and CD8 T and NK cells may be exposed to persistent Ag during the latent phase of infection and are not truly Ag-independent memory cells. However, we note that a number of studies have shown similar kinetics of memory formation in acute and persistent infections (27, 34, 38, 39). Additionally, the unique interactions between virus-specific NK cells and MCMV make it possible to directly track these cells. The advantages of comparing the dynamics of CD4 T, CD8 T, and NK cells in a single infection outweigh the potential issue of persistent Ag. Moreover, as this analysis uses a modeling approach to interpret previous data on NK cell memory, it is important that the comparison is made on the same dataset.
The definition of immune memory can either be considered on the basis of cellular function (higher function of Ag-experienced cells), on the basis of precursor number (high number of cells able to respond to secondary challenge), or on the basis of immune function (better control of secondary infection). In the case of T cells, all three definitions fit well with the underlying dynamics. However, in the case of NK cells, the concept of memory is more difficult. Most importantly, Ag-experienced NK cells have been shown to have increased cellular function (16, 19) and increased immune function over a period of at least a month (17). However, our kinetic studies suggest that NK memory may not be as stable or long-lived as the T cell memory pool. Given the high precursor levels of NK in the resting animal, this suggests that memory NK cells may not remain elevated in the long term. Further studies of the duration of this NK mediated protection and the relative contribution of increased cellular functionality and increased precursor number will better elucidate whether NK memory can be harnessed for vaccination against infection.
Acknowledgments
M.P.D. is a National Health and Medical Research Council Senior Research Fellow. T.E.S. is supported by an Australian Postgraduate Award.
We thank Lewis Lanier for providing experimental data and critical reading of the manuscript.
Abbreviations used in this article
- KLRG1
killer cell lectin-like receptor G1
- MCMV
murine CMV
Footnotes
Disclosures
The authors have no financial conflicts of interest.
References
- 1.Medzhitov R. Recognition of microorganisms and activation of the immune response. Nature. 2007;449:819–826. doi: 10.1038/nature06246. [DOI] [PubMed] [Google Scholar]
- 2.Takeuchi O, Akira S. Innate immunity to virus infection. Immunol Rev. 2009;227:75–86. doi: 10.1111/j.1600-065X.2008.00737.x. [DOI] [PMC free article] [PubMed] [Google Scholar]
- 3.Arstila TP, Casrouge A, Baron V, Even J, Kanellopoulos J, Kourilsky P. A direct estimate of the human alphabeta T cell receptor diversity. Science. 1999;286:958–961. doi: 10.1126/science.286.5441.958. [DOI] [PubMed] [Google Scholar]
- 4.Davis MM, Bjorkman PJ. T-cell antigen receptor genes and T-cell recognition. Nature. 1988;334:395–402. doi: 10.1038/334395a0. [DOI] [PubMed] [Google Scholar]
- 5.Venturi V, Price DA, Douek DC, Davenport MP. The molecular basis for public T-cell responses? Nat Rev Immunol. 2008;8:231–238. doi: 10.1038/nri2260. [DOI] [PubMed] [Google Scholar]
- 6.Brandes M, Willimann K, Moser B. Professional antigen-presentation function by human gammadelta T cells. Science. 2005;309:264–268. doi: 10.1126/science.1110267. [DOI] [PubMed] [Google Scholar]
- 7.Wu Y, Wu W, Wong WM, Ward E, Thrasher AJ, Goldblatt D, Osman M, Digard P, Canaday DH, Gustafsson K. Human gamma delta T cells: a lymphoid lineage cell capable of professional phagocytosis. J Immunol. 2009;183:5622–5629. doi: 10.4049/jimmunol.0901772. [DOI] [PubMed] [Google Scholar]
- 8.Porcelli SA, Morita CT, Modlin RL. T-cell recognition of nonpeptide antigens. Curr Opin Immunol. 1996;8:510–516. doi: 10.1016/s0952-7915(96)80039-2. [DOI] [PubMed] [Google Scholar]
- 9.Shen Y, Zhou D, Qiu L, Lai X, Simon M, Shen L, Kou Z, Wang Q, Jiang L, Estep J, et al. Adaptive immune response of Vgamma2Vdelta2+ T cells during mycobacterial infections. Science. 2002;295:2255–2258. doi: 10.1126/science.1068819. [DOI] [PMC free article] [PubMed] [Google Scholar]
- 10.Borghesi L, Milcarek C. Innate versus adaptive immunity: a paradigm past its prime? Cancer Res. 2007;67:3989–3993. doi: 10.1158/0008-5472.CAN-07-0182. [DOI] [PubMed] [Google Scholar]
- 11.Bryceson YT, March ME, Ljunggren HG, Long EO. Activation, coactivation, and costimulation of resting human natural killer cells. Immunol Rev. 2006;214:73–91. doi: 10.1111/j.1600-065X.2006.00457.x. [DOI] [PMC free article] [PubMed] [Google Scholar]
- 12.Lanier LL. NK cell recognition. Annu Rev Immunol. 2005;23:225–274. doi: 10.1146/annurev.immunol.23.021704.115526. [DOI] [PubMed] [Google Scholar]
- 13.Arase H, Mocarski ES, Campbell AE, Hill AB, Lanier LL. Direct recognition of cytomegalovirus by activating and inhibitory NK cell receptors. Science. 2002;296:1323–1326. doi: 10.1126/science.1070884. [DOI] [PubMed] [Google Scholar]
- 14.Pende D, Spaggiari GM, Marcenaro S, Martini S, Rivera P, Capobianco A, Falco M, Lanino E, Pierri I, Zambello R, et al. Analysis of the receptor-ligand interactions in the natural killer-mediated lysis of freshly isolated myeloid or lymphoblastic leukemias: evidence for the involvement of the Poliovirus receptor (CD155) and Nectin-2 (CD112) Blood. 2005;105:2066–2073. doi: 10.1182/blood-2004-09-3548. [DOI] [PubMed] [Google Scholar]
- 15.O’Leary JG, Goodarzi M, Drayton DL, von Andrian UH. T cell- and B cell-independent adaptive immunity mediated by natural killer cells. Nat Immunol. 2006;7:507–516. doi: 10.1038/ni1332. [DOI] [PubMed] [Google Scholar]
- 16.Cooper MA, Elliott JM, Keyel PA, Yang LP, Carrero JA, Yokoyama WM. Cytokine-induced memory-like natural killer cells. Proc Natl Acad Sci USA. 2009;106:1915–1919. doi: 10.1073/pnas.0813192106. [DOI] [PMC free article] [PubMed] [Google Scholar]
- 17.Paust S, Gill HS, Wang BZ, Flynn MP, Moseman EA, Senman B, Szczepanik M, Telenti A, Askenase PW, Compans RW, von Andrian UH. Critical role for the chemokine receptor CXCR6 in NK cell-mediated antigen-specific memory of haptens and viruses. Nat Immunol. 2010;11:1127–1135. doi: 10.1038/ni.1953. [DOI] [PMC free article] [PubMed] [Google Scholar]
- 18.Sun JC, Beilke JN, Lanier LL. Immune memory redefined: characterizing the longevity of natural killer cells. Immunol Rev. 2010;236:83–94. doi: 10.1111/j.1600-065X.2010.00900.x. [DOI] [PMC free article] [PubMed] [Google Scholar]
- 19.Sun JC, Beilke JN, Lanier LL. Adaptive immune features of natural killer cells. Nature. 2009;457:557–561. doi: 10.1038/nature07665. [DOI] [PMC free article] [PubMed] [Google Scholar]
- 20.Robbins SH, Tessmer MS, Mikayama T, Brossay L. Expansion and contraction of the NK cell compartment in response to murine cytomegalovirus infection. J Immunol. 2004;173:259–266. doi: 10.4049/jimmunol.173.1.259. [DOI] [PubMed] [Google Scholar]
- 21.Walton SM, Wyrsch P, Munks MW, Zimmermann A, Hengel H, Hill AB, Oxenius A. The dynamics of mouse cytomegalovirus-specific CD4 T cell responses during acute and latent infection. J Immunol. 2008;181:1128–1134. doi: 10.4049/jimmunol.181.2.1128. [DOI] [PubMed] [Google Scholar]
- 22.Munks MW, Cho KS, Pinto AK, Sierro S, Klenerman P, Hill AB. Four distinct patterns of memory CD8 T cell responses to chronic murine cytomegalovirus infection. J Immunol. 2006;177:450–458. doi: 10.4049/jimmunol.177.1.450. [DOI] [PubMed] [Google Scholar]
- 23.Karrer U, Sierro S, Wagner M, Oxenius A, Hengel H, Koszinowski UH, Phillips RE, Klenerman P. Memory inflation: continuous accumulation of antiviral CD8+ T cells over time. J Immunol. 2003;170:2022–2029. doi: 10.4049/jimmunol.170.4.2022. [DOI] [PubMed] [Google Scholar]
- 24.Arens R, Wang P, Sidney J, Loewendorf A, Sette A, Schoenberger SP, Peters B, Benedict CA. Cutting edge: murine cytomegalovirus induces a polyfunctional CD4 T cell response. J Immunol. 2008;180:6472–6476. doi: 10.4049/jimmunol.180.10.6472. [DOI] [PMC free article] [PubMed] [Google Scholar]
- 25.Sierro S, Rothkopf R, Klenerman P. Evolution of diverse antiviral CD8+ T cell populations after murine cytomegalovirus infection. Eur J Immunol. 2005;35:1113–1123. doi: 10.1002/eji.200425534. [DOI] [PubMed] [Google Scholar]
- 26.De Boer RJ, V, Ganusov V, Milutinović D, Hodgkin PD, Perelson AS. Estimating lymphocyte division and death rates from CFSE data. Bull Math Biol. 2006;68:1011–1031. doi: 10.1007/s11538-006-9094-8. [DOI] [PubMed] [Google Scholar]
- 27.De Boer RJ, Homann D, Perelson AS. Different dynamics of CD4 + and CD8+ T cell responses during and after acute lymphocytic choriomeningitis virus infection. J Immunol. 2003;171:3928–3935. doi: 10.4049/jimmunol.171.8.3928. [DOI] [PubMed] [Google Scholar]
- 28.Munks MW, Pinto AK, Doom CM, Hill AB. Viral interference with antigen presentation does not alter acute or chronic CD8 T cell immuno-dominance in murine cytomegalovirus infection. J Immunol. 2007;178:7235–7241. doi: 10.4049/jimmunol.178.11.7235. [DOI] [PubMed] [Google Scholar]
- 29.Dokun AO, Kim S, Smith HR, Kang HS, Chu DT, Yokoyama WM. Specific and nonspecific NK cell activation during virus infection. Nat Immunol. 2001;2:951–956. doi: 10.1038/ni714. [DOI] [PubMed] [Google Scholar]
- 30.Nguyen KB, Salazar-Mather TP, Dalod MY, Van Deusen JB, Wei XQ, Liew FY, Caligiuri MA, Durbin JE, Biron CA. Coordinated and distinct roles for IFN-alpha beta, IL-12, and IL-15 regulation of NK cell responses to viral infection. J Immunol. 2002;169:4279–4287. doi: 10.4049/jimmunol.169.8.4279. [DOI] [PubMed] [Google Scholar]
- 31.Daniels KA, Devora G, Lai WC, O’Donnell CL, Bennett M, Welsh RM. Murine cytomegalovirus is regulated by a discrete subset of natural killer cells reactive with monoclonal antibody to Ly49H. J Exp Med. 2001;194:29–44. doi: 10.1084/jem.194.1.29. [DOI] [PMC free article] [PubMed] [Google Scholar]
- 32.Bakker AB, Hoek RM, Cerwenka A, Blom B, Lucian L, McNeil T, Murray R, Phillips LH, Sedgwick JD, Lanier LL. DAP12-deficient mice fail to develop autoimmunity due to impaired antigen priming. Immunity. 2000;13:345–353. doi: 10.1016/s1074-7613(00)00034-0. [DOI] [PubMed] [Google Scholar]
- 33.Zimmermann C, Prévost-Blondel A, Blaser C, Pircher H. Kinetics of the response of naive and memory CD8 T cells to antigen: similarities and differences. Eur J Immunol. 1999;29:284–290. doi: 10.1002/(SICI)1521-4141(199901)29:01<284::AID-IMMU284>3.0.CO;2-C. [DOI] [PubMed] [Google Scholar]
- 34.Davenport MP, Ribeiro RM, Perelson AS. Kinetics of virus-specific CD8+ T cells and the control of human immunodeficiency virus infection. J Virol. 2004;78:10096–10103. doi: 10.1128/JVI.78.18.10096-10103.2004. [DOI] [PMC free article] [PubMed] [Google Scholar]
- 35.Sun JC, Beilke JN, Bezman NA, Lanier LL. Homeostatic proliferation generates long-lived natural killer cells that respond against viral infection. J Exp Med. 2011;208:357–368. doi: 10.1084/jem.20100479. [DOI] [PMC free article] [PubMed] [Google Scholar]
- 36.Moon JJ, Chu HH, Pepper M, McSorley SJ, Jameson SC, Kedl RM, Jenkins MK. Naive CD4(+) T cell frequency varies for different epitopes and predicts repertoire diversity and response magnitude. Immunity. 2007;27:203–213. doi: 10.1016/j.immuni.2007.07.007. [DOI] [PMC free article] [PubMed] [Google Scholar]
- 37.Badovinac VP, Haring JS, Harty JT. Initial T cell receptor transgenic cell precursor frequency dictates critical aspects of the CD8(+) T cell response to infection. Immunity. 2007;26:827–841. doi: 10.1016/j.immuni.2007.04.013. [DOI] [PMC free article] [PubMed] [Google Scholar]
- 38.Althaus CL, V, Ganusov V, De Boer RJ. Dynamics of CD8+ T cell responses during acute and chronic lymphocytic choriomeningitis virus infection. J Immunol. 2007;179:2944–2951. doi: 10.4049/jimmunol.179.5.2944. [DOI] [PubMed] [Google Scholar]
- 39.De Boer RJ, Oprea M, Antia R, Murali-Krishna K, Ahmed R, Perelson AS. Recruitment times, proliferation, and apoptosis rates during the CD8(+) T-cell response to lymphocytic choriomeningitis virus. J Virol. 2001;75:10663–10669. doi: 10.1128/JVI.75.22.10663-10669.2001. [DOI] [PMC free article] [PubMed] [Google Scholar]