

Abstract
Distinguishing between low-grade oligodendrogliomas (ODs) and astrocytomas (AC) is of interest for defining prognosis and stratifying patients to specific treatment regimens. The purpose of this study was to determine if the apparent diffusion coefficient (ADC) and fractional anisotropy (FA) from diffusion imaging can help to differentiate between newly diagnosed grade II OD and AC subtypes and to evaluate the ADC and FA values for the mixed population of oligoastrocytomas (OA). Fifty-three patients with newly diagnosed grade II gliomas were studied using a 1.5T whole body scanner (23 ODs, 16 ACs, and 14 OAs). The imaging protocol included post-gadolinium T1-weighted images, T2-weighted images, and either three and/or six directional diffusion imaging sequence with b = 1000 s/mm2. Diffusion-weighted images were analyzed using in-house software to calculate maps of ADC and for six directional acquisitions, FA. The intensity values were normalized by values from normal appearing white matter (NAWM) to generate maps of normalized apparent diffusion coefficient (nADC) and normalized fractional anisotropy (nFA). The hyperintense region in the T2 weighted image was defined as the T2All region. A Mann–Whitney rank-sum test was performed on the 25th, median, and 75th nADC and nFA among the three subtypes. Logistic regression was performed to determine how well the nADC and nFA predict subtype. Lesions diagnosed as being OD had significantly lower nADC and significantly higher nFA, compared to AC. The nADC and nFA values individually classified the data with an accuracy of 87%. Combining the two did not enhance the classification. The patients with OA had nADC and nFA values between those of OD and AC. This suggests that ADC and FA may be helpful in directing tissue sampling to the most appropriate regions for taking biopsies in order to make a definitive diagnosis.
Keywords: grade 11 gliomas, oligodendroglioma, astrocytoma, oligoastrocytoma, diffusion imaging, apparent diffusion coefficient, fractional anisotropy
INTRODUCTION
The World Health Organization (WHO) categorizes low-grade gliomas into grades I and II tumors. Grade II gliomas are slow-growing malignant tumors that with time can progress to grades III or IV tumors. The most common histologic subtypes are the more homogeneous oligodendroglioma (OD) and astrocytoma (AC); and the more heterogeneous oligoastrocytoma (OA) (1). OD and ACs have distinct biological characteristics that have been shown to influence response to therapy and outcome. OAs contain a mixture of both OD and AC and it is thought that their biological behavior depends on the relative amounts of the OD and AC components. The prognosis for patients with ODs is significantly better than patients with ACs, averaging survival times of 10 years or more as compared to 4 years. (2,3). ODs also tend to be more responsive to chemotherapy (4–7). The current gold standard for differentiation between the glioma subtypes is surgical biopsy, which imparts substantial risk to the patient and is prone to tissue sampling error (8,9). Knowing that gliomas are heterogeneous tumors, the accuracy of glioma classification and grading through biopsies is highly dependent on the extent of sampling, especially since these tumors often do not enhance, therefore there is no specific biopsy target. Therefore, finding non-invasive imaging techniques capable of differentiating these low-grade tumors is critical, especially for tumors that have subregions with both phenotypes, but that may not have otherwise been diagnosed as such because the tissue samples used for histological analysis were unable to represent the entire tumor.
Microscopic molecular movement of water in tumor tissue reflects tissue properties that include varying levels of structural alterations, tumor cellularity, and vasogenic edema. Diffusion-weighted magnetic resonance imaging (DWI) uses strong gradients to probe the structure of biologic tissues at a microscopic level by measuring the Brownian motion of water molecules, and has therefore been used for in vivo tissue characterization (10). Acquiring data with gradients in three directions allow the calculation of the apparent diffusion coefficient (ADC), while acquiring data with gradients in six or more directions allow the calculation of the ADC and the fractional anisotropy (FA).
The ADC can be calculated from images with any number of gradients applied (11). The directional restriction of water diffusibility can be measured as the FA and has been shown to correlate to integrity of myelinated fiber tracts (12,13). Previous studies are discordant with regards to the use of ADC and FA in distinguishing low-grade ODs and low-grade ACs. Bulakbasi et al. (14) reported the ADC within the tumoral or peritumoral regions cannot differentiate low-grade ACs from low-grade ODs in 33 patients, while Tozer et al. (15) suggested an ADC histogram analysis as a possible method for predicting low-grade glioma subtypes in 27 patients.
The goal of this study was to determine if the ADC and FA from DWI can help differentiate grade II OD and AC subtypes and to examine the ADC and FA for the mixed OA subtype, in a larger patient population that had been considered in previous studies.
MATERIALS AND METHODS
Study population
A total of 53 patients with newly diagnosed grade II glioma were included in this study. Tissue diagnosis was based upon histologic examination using criteria defined by the WHO. Twenty-three patients had grade II ODs (9 females, 14 males) and ranged in age from 21 to 71 years, with a mean of 43 years. Sixteen patients had grade II ACs (6 females, 10 males) and ranged in age from 22 to 52 years with a mean of 36 years. Fourteen patients had grade II OA (6 females, 8 males) and ranged in age from 18 to 62 with a mean of 40 years. Patients provided informed consent as approved by the Committee on Human Research at our institution.
Conventional MRI
MR exams were performed with a 1.5T GE Signa Echospeed scanner (GE Healthcare Technologies Milwaukee, WI, USA), using a standard quadrature head coil. The MRI examination included axial T1-weighted pre- and post-gadolinium three-dimensional spoiled gradient echo (SPGR) images (TR = 34 ms, TE = 3 ms, slice thickness = 1.5 mm, matrix = 256 × 192, FOV = 260 × 195 mm2, flip angle = 40°) and axial T2-weighted 3D fast spin echo (FSE) (TR = 4000 ms, TE = 104 ms, slice thickness = 1.5 mm, matrix = 256 × 192, FOV = 260 × 195 mm2). After each examination, the images were transferred to a SUN Ultra 10 workstation (Sun Microsystems, CA, USA) for post-processing.
Diffusion-weighted imaging
Patients were scanned with three directional DWI (TR = 10 000 ms, TE = 110 ms, matrix size = 256 × 256, slice thickness = 5 mm, b = 1000 s/mm2, or six directional diffusion tensor imaging (TR = 10 000 ms, TE = 108 ms, matrix size = 256 × 256, slice thickness = 3 mm, b = 1000 s/mm2), or both. Table 1 shows the number of patients scanned with three, six and both three and six directional data. DWI was performed before gadolinium injection in all cases except for eight-patient scans. Some studies report no difference in normal tissue or lesions (16) while others report a very small decrease in ADC of 1–1.3% in normal tissue (17,18) and 3% difference in lesions (17). This difference is significantly smaller than the observed differences between the subgroups. The ADC and FA were calculated on a pixel-by-pixel basis using software developed in-house, based on published algorithms (19). The ADC and FA maps were registered to anatomical imaging by rigidly aligning the T2-weighted (b = 0) diffusion image to the T2-weighted FSE and applying the transformation to the ADC and FA maps (20), see Figure 1.
Table 1.
Number of diffusion data sets per subtype, separated into only three directional diffusion-weighted imaging, only six directional diffusion tensor imaging, patients scanned with both three and six directional diffusion imaging and total number of diffusion imaging data sets per subtype
| Low-grade subtype | Only three direction DWI | Only six direction DTI | Both three and six directions | Total |
|---|---|---|---|---|
| Oligodendroglioma | 8 | 4 | 11 | 23 |
| Astrocytoma | 8 | 5 | 3 | 16 |
| Oligoastrocytoma | 6 | 2 | 6 | 14 |
| Total | 22 | 11 | 20 | 53 |
Figure 1.

Example patient with an astrocytoma: (a) T1-weighted SPGR (reference image) with T2ALL mask applied, (b) T1-weighted SPGR with NAWM mask applied, (c) T2-FSE aligned to T1-weighted SPGR from which the T2ALL mask is segmented, (d) T2 (b = 0) from diffusion imaging aligned to the T2-weighted images through a transformation, (e) transformation applied to ADC map, and (f) FA map with T2ALL mask applied.
Data processing
The FSE and pre-gadolinium SPGR images were aligned to the post-gadolinium SPGR using software developed in our laboratory (21). An in-house semi-automated segmentation method was used to define the T2 hyperintense region (T2ALL) on the T2-weighted FSE image (22). The T1-weighted post-Gd SPGR image was checked for any contrast enhancement. If small regions of contrast enhancement was present (6/53 patients), the non-enhancing region was contoured as NEL = T2ALL − CEL. Normalized apparent diffusion coefficient (nADC) maps were generated by dividing the ADC maps by the median ADC value within the normal appearing white matter (NAWM) mask, which was segmented using FAST (FMRIB’s Automated Segmentation Tool) Software on the T2-weighted FSE image (23). The same method was applied to the FA maps to generate the normalized fractional anisotropy (nFA) maps, see Figure 1.
Statistical analysis
The ADC values from three versus six directional data sets were compared using a Wilcoxon signed-rank test and a correlation coefficient for the median ADC values from the three and six directional data sets was calculated. These analyses were performed to verify that the three and six directional data sets show the same results and therefore could be combined.
A Mann–Whitney rank-sum test was performed on OD, AC, and OA median, 25th, and 75th percentile ADC, nADC, and nFA values. Logistic regression analysis was used to estimate the accuracy of subtyping patients with OD versus AC using nADC and nFA values. Due to multiple comparisons, the p-value chosen to be significant is p <0.01.
RESULTS
Twenty patients were scanned with three directional DWI and six directional DTI. The Wilcoxon signed-rank test for the three directional and six directional median nADC values showed no significant difference for the median (p = 0.94), 25th (p = 0.55), or 75th (p = 0.60) percentile nADC values within the non-enhancing region. There was also a very strong correlation between the three and six directional median ADC (r = 0.97, p <0.001) and nADC (r = 0.964, p <0.001) values. Therefore, the patients scanned with three directional DWI and the patients scanned with the six directional DTI were analyzed together.
The median, 25th, and 75th percentiles were calculated for the nADC and nFA values, within the NEL. Normalization was performed in order to combine three and six directional data. The differences between the groups were maintained whether or not the normalization was performed. The correlation coefficient between the ADC and nADC values was r = 0.9725, p <0.0001. Other studies have suggested ADC varies with age (24) and brain or tumor volume (25). In this study, the correlation between ADC and age showed a weak but significant correlation for all patient data combined (r = −0.315, p <0.022), but no significant correlation for patients with ODs (r = −0.352, p <0.099), patients with ACs (r = −0.192, p <0.477), or patients with OAs (r = 0.025, p <0.932). The correlation between age and ADC values in NAWM was also assessed for any of the subtypes separately and gave OD (r = 0.0608, p <0.78), AC (r = −0.337, p <0.20), OA (r = −0.154, p <0.60) or for all patients combined (r = −0.099, p <0.48) showing no correlation. The correlation was also assessed for the FA values in NAWM with OD (r = 0.076, p <0.79), AC (r = −0.126, p <0.77), OA (r = 0.383, p <0.35) and all patients combined (r = 0.119, p <0.53) showing no correlation. There was no correlation between ADC and tumor volume for patients with ODs (r = −0.01, p <0.96), AC (r = −0.30, p <0.23), OA (r = 0.29, p <0.32) and all subtypes combined (r = 0.045, p <0.73). The tumor volume mean ± standard deviation (std) were 56.6 ± 63.3, 49.7. ± 39.7, and 47.1 ± 33.6 cc for patients with OD, AC, and OAs. A Wilcoxon rank-sum test shows no significant difference in volume between the groups, OD versus AC (p = 0.7426), OD versus OA (p = 0.9127), and AC versus OA (p = 0.9834).
There was a larger variation in the NAWM values for the FA than the ADC, with a variation of 25% in FA as compared to 13% in ADC. The variation in FA likely arose from the difference in noise from three to six directions and field strengths and the known variation across patients. Therefore, normalization was more important for FA values than for ADC values. Notably, although there was a larger variation in the NAWM FA, there was no significant difference between subtypes (see Table 2) within the NAWM.
Table 2.
Descriptive statistics for the NAWM ADC values and non-enhancing lesion nADC values for patients with oligodendroglioma (OD), astrocytoma (AC), and oligoastrocytoma (OA) subtypes followed by the p-value from the Wilcoxon rank-sum test
| n | NAWM ADC
|
Non-enhancing lesion nADC
|
|||
|---|---|---|---|---|---|
| Median | 25th | Median | 75th | ||
| OD | 23 | 751 ± 36 | 1.42 ± 0.18 | 1.60 ± 0.22 | 1.75 ± 0.25 |
| AC | 16 | 762 ± 24 | 1.75 ± 0.26 | 2.04 ± 0.29 | 2.29 ± 0.33 |
| OA | 14 | 767 ± 20 | 1.64 ± 0.13 | 1.87 ± 0.18 | 2.07 ± 0.21 |
| OD versus AC | 0.484 | <0.0003 | <0.0001 | <0.0001 | |
| OD versus OA | 0.324 | <0.0009 | <0.0005 | 0.0016 | |
| AC versus OA | 0.480 | 0.129 | 0.0586 | 0.0586 | |
| n | NAWM FA
|
Non-enhancing lesion nFA
|
|||
| Median | 25th | Median | 75th | ||
|
| |||||
| OD | 14 | 513 ± 62 | .395 ± .065 | .475 ± .073 | .580 ± .070 |
| AC | 8 | 525 ± 18 | .290 ± .029 | .375 ± .037 | .480 ± .063 |
| OA | 8 | 518 ± 49 | .345 ± .042 | .440 ± .050 | .560 ± .060 |
| OD versus AC | 0.517 | 0.003 | 0.0019 | 0.0012 | |
| OD versus OA | 0.973 | 0.109 | 0.207 | 0.183 | |
| AC versus OA | 0.800 | 0.010 | 0.0148 | 0.0379 | |
NAWM ADC, NAWM FA, non-enhancing lesion nADC and non-enhancing lesion nFA values.
The median, 25th, and 75th percentiles for nADC and nFA for the NEL region are shown in Table 2. The median nADC OD values were significantly lower (p <0.0001) than the median nADC AC values, with the OAs falling in the middle range, as shown in Figure 2a. This also held true for the 25th and 75th percentile nADC values showing significant differences with p <0.0004 and p <0.0001, respectively. The median nFA OD values were significantly higher (p = 0.005) than the median nFA AC values, with the OA nFA values falling in the middle range, as shown in Figure 2b. This also held for the 25th and 75th percentile nFA values with significant differences of p = 0.004 and p = 0.006, respectively.
Figure 2.

Boxplots of the median (a) nADC values and (b) nFA values within the NEL for patients with grade II oligodendroglioma (OD), astrocytoma (AC), and oligoastrocytoma (OA).
In addition to the median, 25th, and 75th percentiles the std and the coefficient of variability (cvb) defined here as the (std/median).*100 were analyzed. The median stds and cvb for the ADC within the NEL of grade II ODs, ACs, and OAs were 230, 283, 265 × 10−3 mm2/s and 19, 20, 18%, respectively. The OD has a significantly lower std than that of the AC (p = 0.015), but when normalized by the median, there are no significant differences between any of the subtypes.
The data were also analyzed by summing the nADC histograms and nFA histograms of each patient per subtype, shown in Figure 3, along with the NAWM histograms which overlap for nADC and nFA. The grade II OD nADC values were lower than the grade II AC, with the grade II OA falling in between. The nFA values in the grade II ODs were higher than those in the grade II OAs and ACs. The overlap of the histograms between subtypes was greater in the nFA than in the nADC.
Figure 3.

Sum of (a) nADC histograms and (b) nFA histograms within the NAWM of all patients and the NEL of all the patients with oligodendrogliomas (OD), astrocytoma (AC), and oligoastrocytoma (OA).
The data were also analyzed by examining the median nFA and the median nADC. There appears to be a significant correlation of all subtypes (r = −0.80, p <0.0001, n = 33), and separately for patients with OD (r = −0.739, p = 0.0025, n = 14) and AC (r = −0.9227, p = 0.0011, n = 8) but no correlation for OA (r = −0.2621, p <0.530, n = 8). High FA values were found to correlate to low ADC values for all subtypes (r = −0.791, p <00001), and separately for patients with OD (r = −0.585, p = 0.0172) and AC (r = −0.876, p = 0.002) but no correlation for OA (r = −0.427, p = 0.2912). Visual inspection of maps of the 25th, 50th, and 75th percentiles revealed that the median values typically reflected the central tumor while the edge of the tumor contained the 25th percentile nADC and 75th percentile nFA values. Although the correlation across patients was strong, the correlation within patients was not as strong. There was a large range of correlation coefficient values, ranging from −0.12 to −0.81, with a median correlation of −0.43, −0.49, −0.45, and −0.44 for patients with ODs, ACs, OAs, and all subtypes, respectively. The within-patient NAWM correlation coefficients were significantly lower than those within the tumor, with a median correlation of −0.17, −0.18, −0.23, and −0.18 for patients with ODs, ACs, OAs, and all subtypes, respectively.
Logistic regression analysis was used to examine the ability of the nADC and nFA in subtyping patients with OD versus AC. The most optimal cutoff value for the median nADC was 1.84, misclassifying 2 of 23 ODs, 3 of 16 ACs with an overall accuracy of 87%. The most optimal cutoff value for the median nFA was 0.41, misclassifying 1 of 14 ODs, 1 of 9 ACs, with an overall accuracy of 91%. The same two patients misclassified from the nFA analysis alone were misclassified when both the nADC and nFA were both included in the analysis.
DISCUSSION
Non-invasive methods for distinguishing between patients who have grade II AC and ODs are important because they have different prognostic factors and response to treatment. This study shows a significant difference in the ADC and FA values between newly diagnosed patients with grade II OD and AC lesions, while patients with the heterogeneous grade II OA had values that fell in between those of ODs and ACs.
The 23 patients with grade II OD and 16 patients with grade II AC had a significant difference in the ADC and nADC values with mean ± std ADC values of 1221 ± 165 and 1562 ± 204 × 10−3 mm2/s, respectively. Tozer et al. (15) was able to show a significant difference between 9 patients with grade II OD and 15 patients with grade II AC with mean ± std ADC values of 1360 ± 150 and 1510 ± 250 × 10−3 mm2/s, respectively, using a histogram analysis of ADC. Although the mean values obtained were similar, Bulakbasi et al. (14) reported no significant difference in the ADC peritumoral values between 10 patients with grade II ODs and 23 patients with grade II ACs (mean ± std ADC values of 1360 ± 220 vs. 1560 ± 390 × 10−3 mm2/s). In the current study, the ADC values for patients with grade II ACs are similar, while the ADC values for OD were lower. This may reflect a difference in the histopathologic classification of patients at UCSF versus other institutions due to variations in practices, as well as differences in pathologist training.
Although there was a significant difference in the nFA values for patients with grade II OD and AC, the patients with grade II OA had values that fell between those of the ODs and ACs. To our knowledge, this is the first paper to examine the FA values and find a separation in values for patients with OD and AC. Patients with OD showed higher FA values than patients with AC. This may be explained by the more disruptive pattern of infiltration of ACs as compared to perineuronal satelitosis in ODs.
Yamasaki et al. (26) presented the logistic regression to discriminate between ADC values for OD and AC tumors for separating 2 patients (one grade II OD and one grade II OA) from 17 patients with grade II AC with 94% accuracy. Tozer et al. (15) classified 15 grade II ACs and 9 grade II ODs using ADC histograms with an accuracy of 83%. This study showed 87% accuracy in separating 23 patients with grade II ODs from 16 patients with grade II ACs. Patients with grade II OAs have tumor mixtures and were then expected to have intermediate ADC and FA values depending on how close they resembled one or the other type of the more homogeneous subtypes.
The use of FA values to discriminate between OD and AC tumors has not previously been shown. This study was able to distinguish between 14 grade II ODs and 8 grade II ACs with 91% accuracy. Using the same patients (i.e. six directional data set), the ADC misclassifies the same two patients as the FA. There is a significant correlation between nFA and nADC, which would explain why the same patients were misclassified and suggests that combining the ADC and FA does not enhance the classification.
Visual inspection indicated that the median ADC and median FA values were within the center of the tumor, whereas the lower 25th percentile ADC and 75th percentile FA values were typically at the edge of the tumor. The data shows a similar significant correlation between nADC and nFA in the periphery. The variation between the median nADC and median nFA may reflect the biology of the tumor, since no significant correlation was found between values within individual patients. This distribution of values, border and central, was seen in both patients with OD and AC and was not found to distinguish between them.
We expect the differences in ADC and FA for OD and AC to arise from biological differences and not from confounding factors. There was no significant correlation between age and ADC in any of the subgroups separately, but there was a weak significant correlation when all of the patients were analyzed together. Patients with OD tended to be older with lower ADC, while patients with AC tended to be younger and have higher ADC values. This weak correlation observed could be due to the difference in age and ADC values between the groups. Interestingly, there was no correlation between NAWM ADC values and age for any of the group separately or when combined. This suggests that age is not a confounding factor. Berger et al. (25) suggests that the biology of large low-grade gliomas is quite different from smaller tumors. These data suggest no correlation between tumor volume and ADC values for any of the groups. There were no differences between the tumor volumes for patients with different grade II subtypes. Therefore, as expected the significant difference cannot be attributed to confounding factors and therefore, it can be deduced that the variation is due to a biological difference between the tumors, especially since the mixed OAs had values in between those of OD and AC.
The pattern of infiltration varies in ACs and ODs. ODs tend to infiltrate by perineuronal satelitosis (clustering of neoplastic oligodendrocytes around neurons) (see Figure 4). ODs tend to have more persistent neurons as seen in pathology, which may explain the higher FA values. By sparing the neurons and less volume of invasion, one would speculate that less edema is expected, which may explain the lower ADC values in ODs.
Figure 4.
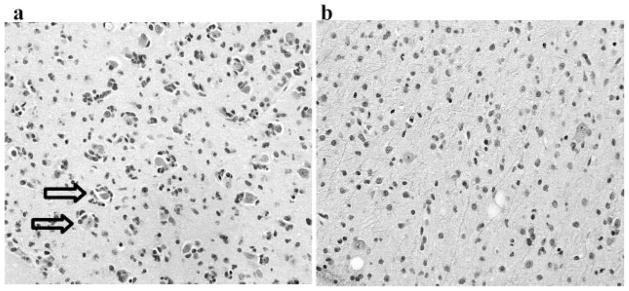
H&E staining for patient with (a) grade II oligodendroglioma, which tend to have an infiltration pattern of perineuronal satelitosis and more persistent neurons as shown by the arrows, whereas patients with (b) grade II astrocytoma tend to have a diffuse infiltration pattern. This may help explain the lower ADC and higher FA values in oligodendrogliomas and higher ADC and lower FA values in astrocytomas.
Another biological effect that may enhance the separation between OD and AC in ADC and FA is calcification. Calcification has been reported in 20–91% of patients (27–29), while micro-calcifications are seen in 90% of tumors (30). Patients with calcification are expected to have lower ADC values due to the expected lack of water movement in the calcified region. The previous studies do not report the number of patients with observed calcification. In this study, calcification was present in at least 40% of the patients with OD. The patients with calcification tended to have the lower nADC values.
ADC has been suggested to correlate to cell density in a mixed population of patients with gliomas (31,32), but it is not entirely clear how much of a role it has in this analysis. Cell density has not been shown to have a significant difference between OD and AC. But, it is expected that the same cell density in these groups would show a difference in FA and ADC because of the difference in the infiltration patterns (see Figure 4).
Histopathology of the 23 patients with grade II OD and 16 patients with grade II AC were reviewed by a single pathologist in a systematic method to analyze the biological features of the available tissue. Of the 23 patients with grade II OD, 4 patients were determined to also have some features of AC; of the 16 patients with AC, 6 patients were determined to have some component of OD and of the 14 patients with grade II OA, 1 patient was determined to be an AC. The original patient classification based on nADC is shown in Figure 5 and the adjusted classification is shown in Figure 5. Most of the patients overlapping in the nADC values were re-classified to OAs. It is important to mention that some of these patients with mixed features had different focal areas exhibiting features of AC and OD. This would lead us to believe that low-grade gliomas are more heterogeneous than once believed and that biopsy location is an important aspect of accurate classification.
Figure 5.

(a) The original patient classification based on nADC and (b) the adjusted classification based on re-evaluation of histopathology from a single pathologist. Most of the patients that were overlapping were re-classified as patients with oligoastrocytomas. This figure is available in color online at www.interscience.wiley.com/journal/nbm
Diffusion parameters can be used to limit the sampling errors of biopsies and therefore image-guided biopsies of the higher and lower values of the tumor may help sample the more definitive regions, especially when trying to determine a mixed OA from the more homogeneous OD and AC.
In conclusion, this study suggests a significant difference in ADC and FA values between patients with grade II OD and AC subtypes. Therefore, nADC and nFA from diffusion tensor imaging could be utilized as a non-invasive biomarker for subtyping low grades.
Acknowledgments
The authors thank Niles Bruce and Bert Jimenez of the Department of Radiology at UCSF for their assistance with data acquisition. This work was supported by grants from the National Institutes of Health (P50 CA97297), UC Discovery Grants (LSIT01-10107 and ITL-Bio 04-10148) sponsored jointly with GE Healthcare and the UCB Graduate Opportunity Program Fellowship.
Abbreviations
- DWI
diffusion-weighted imaging
- ADC
apparent diffusion coefficient
- nADC
normalized apparent diffusion coefficient
- FA
fractional anisotropy
- nFA
normalized fractional anisotropy
- OD
oligodendroglioma
- AC
astrocytoma
- OA
oligoastrocytoma
Footnotes
Presented in part at the 15th Annual Meeting of ISMRM, Berlin, Germany, 2007.
References
- 1.Lopes MB, Laws ER., Jr Low-grade central nervous system tumors. Neurosurg Focus. 2002;12:E1. doi: 10.3171/foc.2002.12.2.2. [DOI] [PubMed] [Google Scholar]
- 2.Olson JD, Riedel E, DeAngelis LM. Long-term outcome of low-grade oligodendroglioma and mixed glioma. Neurology. 2000;54:1442–1448. doi: 10.1212/wnl.54.7.1442. [DOI] [PubMed] [Google Scholar]
- 3.Shaw EG, Scheithauer BW, O’Fallon JR, Tazelaar HD, Davis DH. Oligodendrogliomas: the Mayo Clinic experience. J Neurosurg. 1992;76:428–434. doi: 10.3171/jns.1992.76.3.0428. [DOI] [PubMed] [Google Scholar]
- 4.Fortin D, Macdonald DR, Stitt L, Cairncross JG. PCV for oligodendroglial tumors: in search of prognostic factors for response and survival. Can J Neurol Sci. 2001;28:215–223. doi: 10.1017/s0317167100001359. [DOI] [PubMed] [Google Scholar]
- 5.Glass J, Hochberg FH, Gruber ML, Louis DN, Smith D, Rattner B. The treatment of oligodendrogliomas and mixed oligodendroglioma-astrocytomas with PCV chemotherapy. J Neurosurg. 1992;76:741–745. doi: 10.3171/jns.1992.76.5.0741. [DOI] [PubMed] [Google Scholar]
- 6.Kitange GJ, Smith JS, Jenkins RB. Genetic alterations and chemotherapeutic response in human diffuse gliomas. Expert Rev Anticancer Ther. 2001;1:595–605. doi: 10.1586/14737140.1.4.595. [DOI] [PubMed] [Google Scholar]
- 7.Mason WP, Krol GS, DeAngelis LM. Low-grade oligodendroglioma responds to chemotherapy. Neurology. 1996;46:203–207. doi: 10.1212/wnl.46.1.203. [DOI] [PubMed] [Google Scholar]
- 8.Sasaki H, Zlatescu MC, Betensky RA, Johnk LB, Cutone AN, Cairncross JG, Louis DN. Histopathological-molecular genetic correlations in referral pathologist-diagnosed low-grade “oligodendroglioma”. J Neuropathol Exp Neurol. 2002;61:58–63. doi: 10.1093/jnen/61.1.58. [DOI] [PubMed] [Google Scholar]
- 9.van den Bent MJ. New perspectives for the diagnosis and treatment of oligodendroglioma. Expert Rev Anticancer Ther. 2001;1:348–356. doi: 10.1586/14737140.1.3.348. [DOI] [PubMed] [Google Scholar]
- 10.Le Bihan DJ. Differentiation of benign versus pathologic compression fractures with diffusion-weighted MR imaging: a closer step toward the “holy grail” of tissue characterization? Radiology. 1998;207:305–307. doi: 10.1148/radiology.207.2.9577472. [DOI] [PubMed] [Google Scholar]
- 11.Le Bihan D, Breton E, Lallemand D, Grenier P, Cabanis E, Laval-Jeantet M. MR imaging of intravoxel incoherent motions: application to diffusion and perfusion in neurologic disorders. Radiology. 1986;161:401–407. doi: 10.1148/radiology.161.2.3763909. [DOI] [PubMed] [Google Scholar]
- 12.Chenevert TL, Brunberg JA, Pipe JG. Anisotropic diffusion in human white matter: demonstration with MR techniques in vivo. Radiology. 1990;177:401–405. doi: 10.1148/radiology.177.2.2217776. [DOI] [PubMed] [Google Scholar]
- 13.Hansen JR. Pulsed NMR study of water mobility in muscle and brain tissue. Biochim Biophys Acta. 1971;230:482–486. doi: 10.1016/0304-4165(71)90177-2. [DOI] [PubMed] [Google Scholar]
- 14.Bulakbasi N, Guvenc I, Onguru O, Erdogan E, Tayfun C, Ucoz T. The added value of the apparent diffusion coefficient calculation to magnetic resonance imaging in the differentiation and grading of malignant brain tumors. J Comput Assist Tomogr. 2004;28:735–746. doi: 10.1097/00004728-200411000-00003. [DOI] [PubMed] [Google Scholar]
- 15.Tozer DJ, Jager HR, Danchaivijitr N, Benton CE, Tofts PS, Rees JH, Waldman AD. Apparent diffusion coefficient histograms may predict low-grade glioma subtype. NMR Biomed. 2006 doi: 10.1002/nbm.1091. [DOI] [PubMed] [Google Scholar]
- 16.Fitzek C, Mentzel HJ, Fitzek S, Sauner D, Kaiser WA, Reichenbach JR. Echoplanar diffusion-weighted MRI with intravenous gadolinium-DTPA. Neuroradiology. 2003;45:592–597. doi: 10.1007/s00234-003-0965-5. [DOI] [PubMed] [Google Scholar]
- 17.Firat A, Şanli B, Karakasş H, Erdem G. The effect of intravenous gadolinium-DTpa on diffusion-weighted imaging. Neuroradiology. 2006;48:465–470. doi: 10.1007/s00234-006-0091-2. [DOI] [PubMed] [Google Scholar]
- 18.Yamada K, Kubota H, Kizu O, Nakamura H, Ito H, Yuen S, Tanaka O, Kubota T, Makino M, Van Cauteren M, Nishimura T. Effect of intraveneous gadolinium-DTPA on diffusion-weighted images evaluation of normal brain and infarcts. Stroke. 2002;33:1799–1802. doi: 10.1161/01.str.0000020355.29423.61. [DOI] [PubMed] [Google Scholar]
- 19.Basser PJ, Pierpaoli C. Microstructural and physiological features of tissues elucidated by quantitative-diffusion-tensor MRI. J Magn Reson B. 1996;111:209–219. doi: 10.1006/jmrb.1996.0086. [DOI] [PubMed] [Google Scholar]
- 20.Hartkens T, Rueckert D, Schnabel JA, Hawkes DJ, Hill DLG. BVM 2002. Leipzig: Springer-Verlag; 2002. VTK CISG registration toolkit: An open source software package for affine and non-rigid registration of single- and multimodal 3D images. [Google Scholar]
- 21.Nelson SJ, Nalbandian AB, Proctor E, Vigneron DB. Registration of images from sequential MR studies of the brain. J Magn Reson Imaging. 1994;4:877–883. doi: 10.1002/jmri.1880040621. [DOI] [PubMed] [Google Scholar]
- 22.Saraswathy S. International Society of Magnetic Resonance Imaging. Seattle, WA, USA: 2006. Semi-automated segmentation of brain tumor lesions in MR images. [Google Scholar]
- 23.Zhang Y, Brady M, Smith S. Segmentation of brain MR images through a hidden Markov random field model and the expectation-maximization algorithm. IEEE Trans Med Imaging. 2001;20:45–57. doi: 10.1109/42.906424. [DOI] [PubMed] [Google Scholar]
- 24.Gideon P, Thomsen C, Henriksen O. Increased self-diffusion of brain water in normal aging. J Magn Reson Imaging. 1994;4:185–188. doi: 10.1002/jmri.1880040216. [DOI] [PubMed] [Google Scholar]
- 25.Berger MS, Deliganis AV, Dobbins J, Keles GE. The effect of extent of resection on recurrence in patients with low grade cerebral hemisphere gliomas. Cancer. 1994;74:1784–1791. doi: 10.1002/1097-0142(19940915)74:6<1784::aid-cncr2820740622>3.0.co;2-d. [DOI] [PubMed] [Google Scholar]
- 26.Yamasaki F, Kurisu K, Satoh K, Arita K, Sugiyama K, Ohtaki M, Takaba J, Tominaga A, Hanaya R, Yoshioka H, Hama S, Ito Y, Kajiwara Y, Yahara K, Saito T, Thohar MA. Apparent diffusion coefficient of human brain tumors at MR imaging. Radiology. 2005;235:985–991. doi: 10.1148/radiol.2353031338. [DOI] [PubMed] [Google Scholar]
- 27.Pirzkall A, Nelson SJ, McKnight TR, Takahashi MM, Li X, Graves EE, Verhey LJ, Wara WW, Larson DA, Sneed PK. Metabolic imaging of low-grade gliomas with three-dimensional magnetic resonance spectroscopy. Int J Radiat Oncol Biol Phys. 2002;53:1254–1264. doi: 10.1016/s0360-3016(02)02869-9. [DOI] [PubMed] [Google Scholar]
- 28.Lee YY, Van Tassel P. Intracranial oligodendrogliomas: imaging findings in 35 untreated cases. AJR Am J Roentgenol. 1989;152:361–369. doi: 10.2214/ajr.152.2.361. [DOI] [PubMed] [Google Scholar]
- 29.Vonofakos D, Marcu H, Hacker H. Oligodendrogliomas: CT patterns with emphasis on features indicating malignancy. J Comput Assist Tomogr. 1979;3:783–788. [PubMed] [Google Scholar]
- 30.Burger P, Scheithauer B, Vogel F. Surgical Pathology of the Nervous System and Its Coverings. Churchill Livingstone; New York, NY: 2002. [Google Scholar]
- 31.Sugahara T, Korogi Y, Kochi M, Ikushima I, Shigematu Y, Hirai T, Okuda T, Liang L, Ge Y, Komohara Y, Ushio Y, Takahashi M. Usefulness of diffusion-weighted MRI with echo-planar technique in the evaluation of cellularity in gliomas. J Magn Reson Imaging. 1999;9:53–60. doi: 10.1002/(sici)1522-2586(199901)9:1<53::aid-jmri7>3.0.co;2-2. [DOI] [PubMed] [Google Scholar]
- 32.Gupta RK, Cloughesy TF, Sinha U, Garakian J, Lazareff J, Rubino G, Rubino L, Becker DP, Vinters HV, Alger JR. Relationships between choline magnetic resonance spectroscopy, apparent diffusion coefficient and quantitative histopathology in human glioma. J Neurooncol. 2000;50:215–226. doi: 10.1023/a:1006431120031. [DOI] [PubMed] [Google Scholar]