

Background: Differentiation of preadipocytes into mature adipocytes (adipogenesis) is widely studied in vitro in mouse 3T3L1 cells.
Results: Expression pattern of PKCδ alternatively spliced variants switches during adipogenesis in 3T3L1 cells.
Conclusion: PKCδII promotes adipocyte survival via Bcl2 pathway. SEAM is a novel PKCδII inhibitor.
Significance: Regulation of PKCδ splice variants in adipocytes may have therapeutic implications for obesity.
Keywords: Adipogenesis, Alternative Splicing, Obesity, Protein Kinase C (PKC), Resveratrol
Abstract
Increased food intake and lack of physical activity results in excess energy stored in adipocytes, and this imbalance contributes to obesity. New adipocytes are required for storage of energy in the white adipose tissue. This process of adipogenesis is widely studied in differentiating 3T3L1 preadipocytes in vitro. We have identified a key signaling kinase, protein kinase C delta (PKCδ), whose alternative splice variant expression is modulated during adipogenesis. We demonstrate that PKCδII splice variant promotes survival in differentiating 3T3L1 cells through the Bcl2 pathway. Here we demonstrate that resveratrol, a naturally occurring polyphenol, increases apoptosis and inhibits adipogenesis along with disruption of PKCδ alternative splicing during 3T3L1 differentiation. Importantly, we have identified a PKCδII splice variant inhibitor. This inhibitor may be a valuable tool with therapeutic implications in obesity.
Introduction
American society has become increasingly “obesogenic” via influences of environments that promote increased food intake and physical inactivity. An excessive amount of body fat or adipose tissue contributes to obesity. Adipose tissue is an important endocrine regulator of energy homeostasis and glucose metabolism. New adipocytes are required for storage of excess energy (intake>expenditure) in white adipose tissue (WAT).2 Excess adipose tissue mass is the basis of obesity and its associated diseases. Adipose tissue mass is determined by adipocyte size and number. Under circumstances of positive energy balance, there is adipose mass expansion (hypertrophia) and hyperplasia.
The cellular components of adipose tissue also include preadipocytes and stem cells residing in adipose stromal-vascular compartment that differentiate to adipocytes. Given proper environmental and hormonal cues, pre-adipocytes undergo clonal expansion and subsequent terminal differentiation into mature adipocytes. During adipogenesis, expression and activity of PPARγ and C/EBP family and their cofactors promote the morphological and functional changes of a primitive, multipotent state to an adipocyte phenotype characterized by cell shape and lipid accumulations (1–3). 3T3L1 murine preadipocyte cell line (4) is widely used as it authentically reproduces adipogenesis including expression of adipogenic genes and morphological changes. Once these cells are terminally differentiated, they undergo growth arrest and form large spherical intracellular lipid droplets. When these cells are implanted into mice, they are histologically indistinguishable from WAT (5, 6).
Preadipocytes undergo apoptosis while mature adipocytes are not susceptible to apoptosis. This was demonstrated in 3T3L1 preadipocytes which goes through apoptosis as shown by DNA fragmentation, Hoescht staining, and TUNEL (7, 8). Concomitantly, Bcl2 levels increased as the adipose cells differentiated into mature adipocytes (9–11). This suggested a change in gene expression patterns from preadipocytes to mature adipocytes during adipogenesis. An important mechanism of regulating gene expression during differentiation is alternative splicing which expands the coding capacity of a single gene to produce different proteins with distinct functions (12). Many genes in the apoptosis pathway are alternatively spliced. Divergence observed in gene expression due to alternative splicing may be tissue-specific (13, 14), developmentally regulated (15, 16) or hormonally regulated (17, 18).
Protein kinase C delta (PKCδ) is a serine/threonine kinase, which plays a central role in apoptosis. PKCδ has dual effects: as a mediator of apoptosis and as an anti-apoptosis effecter. Its splice variants, PKCδI and PKCδII, are a switch that determines cell survival and fate. PKCδI promotes apoptosis while PKCδII promotes survival (19). PKCδII is the mouse homolog of human PKCδVIII (20); both are generated by alternative 5′ splice site usage, and their transcripts share >94% sequence homology. We have shown that PKCδII and PKCδVIII function as pro-survival proteins (21); the functions of the other PKCδ splice variants are not yet established. PKCδII is generated by utilization of an alternative downstream 5′ splice site of PKCδ pre-mRNA exon 9. PKCδII, which is resistant to cleavage by caspase-3, arises from insertion of 78 base pairs (bp) (26 amino acids) in its caspase-3 recognition sequence (DILD) (22). Previously, we showed that overexpression of PKCδII decreased apoptosis and promoted survival in neuronal cells (19).
Here, we evaluated the expression of apoptosis genes that are alternatively spliced during adipogenesis which render the mature adipocyte resistant to ongoing programmed cell death. We determined the effect of naturally occurring polyphenol resveratrol on PKCδ splicing in adipocytes. Further, we report a PKCδII splice variant specific inhibitor in 3T3L1 adipocytes.
MATERIALS AND METHODS
Cell Culture
Mouse 3T3-L1 preadipocytes were purchased from ZenBioTM (Research Triangle Park) and passaged as preconfluent cultures in DMEM high glucose (Invitrogen, Carlsbad, CA) with 10% newborn calf serum (Sigma-Aldrich) at 37 °C and 10% CO2. Once confluent, cells were differentiated (day 0) in DMEM high glucose with 10% fetal bovine serum (Atlas Biological, Fort Collins, CO), 10 μg/ml bovine insulin (Sigma), 1 mm dexamethasone (Sigma), and 0.5 mm isobutyl-1-methylxanthine (Sigma). On day 2, media was replaced with DMEM high glucose, 10% FBS, and bovine insulin. Day 4 and afterward, cells were cultured in DMEM high glucose plus 10% FBS.
Animal Studies
Total RNA was obtained from mouse adipose tissues from Dr. You (University of South Florida). 8-week-old male C57BL/6J (Jackson Laboratories) were either fed a chow diet (control) or diet with added 400 mg resveratrol per kg body weight, once daily (23); n = 5. Total RNA was extracted from adipose tissues from these mice in the You laboratory. All protocols were reviewed and approved by the Institutional Animal Care and Use Committee at University of South Florida, Division of Comparative Medicine.
Western Blot Analysis
Protein lysates were obtained from 3T3L1 cells using lysis buffer containing proteases. Protein lysates (40 μg) were separated by SDS-PAGE with 10% gels. Proteins were electrophoretically transferred to nitrocellulose membranes, blocked with Tris-buffered saline containing 0.1% Tween 20 and 5% nonfat dried milk, washed, and incubated with a polyclonal anti-PARP (Upstate Biotechnology), anti-XIAP (AnaSpec), anti-Bcl2, anti-caspase 9 (Calbiochem), anti-Bcl-x (Santa Cruz Biotechnology), and anti-PKCδ (Cell Signaling) or antibody against the hinge-region of PKCδII (Patel Laboratory (19)). This antibody is specific for PKCδII, as it recognizes the extended hinge region, which is absent in PKCδI (20). Other antibodies used are as follows: PPARγ, Akt, pAkt 473, TNFα, Adiponectin, p-BAD (S316), p-PTEN (Cell Signaling, Boston, MA), β-actin A5441 (Sigma). After incubation with anti-rabbit IgG-HRP, enhanced chemiluminescence (Pierce) was used for detection. FluorChem MTM (Protein Simple) imaging system was used to capture digital chemiluminescence images and process Western blots. Data were analyzed using AlphaView® software.
Co-immunoprecipitation
Co-immunoprecipitation was performed with BAD antibody (Cell Signaling) using Protein A Magnetic Beads S1425S (New England Biolabs, NEB, Ipswich, MA) according to the manufacturer's protocol. The samples were then analyzed as described above in Western blot analysis.
RT-PCR
Total RNA was isolated from 3T3L1 cells with RNA-Bee (Tel Test Center) as recommended by the manufacturer. RNA was also obtained from adipose tissues of mice fed with or without resveratrol from the You Laboratory. 2 μg of RNA were used to synthesize first-strand cDNA with an Oligo(dT) primer and Omniscript R kit (Qiagen). The following primers were used in PCR: PKCδ forward primer 5′-GTGGCCAACCTGTGTGGTATCAAC-3′; reverse primer 5′-CTCTGCCAGCAGCACCTTGCCAA-3′. These primers amplified PKCδI and PKCδII simultaneously. PKCδII-specific antisense primer (5′-TCGCAGGTCTCACTACTGTCCTTTTCC-3′). β-actin forward primer 5′-CTTCATTGACCTCAACTCATG-3′; reverse primer 5′-TGTCATGGATGACCTTGGCCAG-3′. Following PCR, 5% of products were resolved on 6% PAGE gels and detected by silver staining. The PCR reaction was optimized for linear range amplification to allow for quantification of products. Densitometric analyses of the bands were done using the Un-Scan ITTM Analysis Software (Silk Scientific).
siRNA Transfection
Custom siRNA for PKCδII (19) and scrambled siRNA were purchased from Ambion. These siRNA were previously validated for specificity and off-target gene effects were eliminated. The siRNAs were transfected for 48–72 h using siPORT NeoFX® transfection agent or electroporated using Nucleofector® (Lonza).
DNA Laddering Protocol
DNA laddering was used to identify DNA cleavage that occurs during apoptosis. Pellets containing 1 × 10⁶ cells from the attached and floating cell population were washed in PBS and resuspended in 20 μl of Solution I (10 mm EDTA, 50 mm Tris-HCl (pH 8.0), 0.5% (w/v) SDS) plus proteinase K (20 mg/ml stock, used at 0.5 mg/ml). Samples were incubated at 50 °C for 1 h, 10 μl of 0.5 mg/ml RNaseA was added, and the samples were incubated at 50 °C for 1 h. The samples were heated rapidly to 70 °C, supplemented with 10 μl of Solution II (10 mm EDTA, 1% (w/v) low-melting-point agarose, 40% (w/v) sucrose, 0.25% (w/v) bromphenol blue), and immediately loaded onto a 2% agarose gel containing 0.1 μg/ml ethidium bromide (stock = 10 mg/ml). The gel was cooled to 4 °C for ∼5 min to allow the samples to set in the wells, and then run in Tris acetate buffer at 40 V until the dye front migrates 4–5 cm. The DNA was observed by UV transillumination and photographed.
Cytotoxicity Assay
WST-1 (Roche Molecular Biochemicals) was added to 3T3L1 cells (in triplicate) that are treated without or with SEAM to a final concentration of 10% (v/v). Cells were incubated for 2 h at 37 °C. The formazon dye produced by viable cells is quantified using a spectrophotometer set at a wavelength of 440 nm and absorbance recorded for each well (reference wavelength, 690 nm).
Transient Transfection of Plasmid DNA
3T3L1 pre-adipocytes were trypsinized and cell pellets were collected in 100 μl Nucleofector® solution (Lonza) and combined with plasmid DNA (2 μg). The cell/DNA solution is transferred to a cuvette, and the program started (0.34 kV, 960 microfarads). 500 μl of medium is added immediately, and cells are gently transferred to 60-mm plates and allowed to differentiate.
Apoptosis Assay
3T3L1 preadipocytes were cultured on 60-mm dishes. For apoptosis assays, cells were serum-starved for 48 h as previously published (25). Media was collected, and cells were washed one time with HBSS and then trypsinized for 5.0 min. 5 ml of complete media was added to neutralize the trypsin. Media and washes were pooled and centrifuged at 1200 rpm for 5 min. Cells were washed one time with PBS and one time with binding buffer and then incubated for 15 min with 5.0 μl of AV-FITC and 5.0 μl of PI in 100 μl of binding buffer (BD Pharmagen, San Diego, CA) at room temperature in the dark. 400 μl of binding buffer was added, and cells were analyzed by flow cytometry within 1 h. Annexin V-FITC and PI fluorescence, which stains apoptotic cells, were measured using an Accuri C6 flow cytometer.
Oil Red O Staining
3T3L1 preadipocytes were washed with PBS and fixed with 10% formalin for 30 min. The cells were then rinsed and incubated with 60% isopropanol for 5 min. Oil Red O stain (0.15%, Sigma) was added and incubated for 10 min. Images were captured with Nixon confocal microscope.
Synthesis of SEAM
SEAM (synthesized in Bisht Lab, Department of Chemistry, University of South Florida) was envisioned using McMurry coupling of the 3-hydroxyacetophenone to synthesize the corresponding 3-hydroxystilbene followed by the Mannich coupling with the diethylamine and formaldehyde (see Scheme 1).
SCHEME 1.
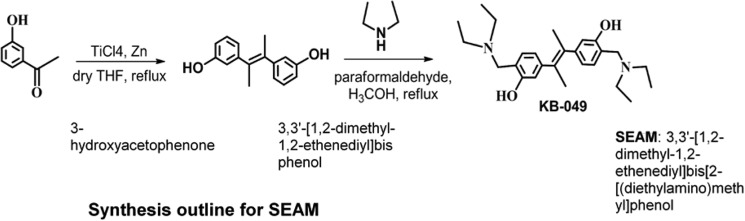
Synthesis outline for SEAM.
Synthesis of 3,3′-[1,2-Dimethyl-1,2-ethenediyl]bis phenol
In a flame-dried 2 neck round bottom flask fitted with magnetic stirrer bar and reflux condensor, dry THF (180 ml or 1.5 molar) and zinc (8 equivalents) was taken under N2 atmosphere. Then reaction mixture was cooled to 0 °C in an ice bath. To this mixture TiCl4 (4 equivalents) was added dropwise while maintaining the reaction temperature at 0°C. After addition was complete, reaction mixture was refluxed for 2 h and cooled to 0 °C. 3-Hydroxyacetophenone (1 equivalent) solution in dry THF was added to the reaction mixture slowly. The reaction mixture was then allowed to reflux until TLC (2:3 mixture of ethyl acetate/hexane) shows that all the 3-hydroxyacetophenone was consumed. Upon completion, the reaction mixture was concentrated, diluted with ethyl acetate, and treated with saturated K2CO3 solution under stirring for 7 h. Reaction mixture was filtered and extracted with ethyl acetate. The stilbene (3,3′-[1,2-dimethyl-1,2-ethenediyl]bis Phenol) was purified upon silica gel chromatographic separation (76% yield). 1H NMR (250 MHz, d6-DMSO): 9.1 (bs, 2H), 7.1 (m, J = 7.75 Hz), 6.88 (t, 2H, J = 7.75 Hz), 6.6 (m), 6.4 (m, 6H), 2.0 (s, 6H), 1.8 (s); 13C NMR (62.5MHz, d6-DMSO): 157.1, 156.5, 145.6, 131.9, 129.1, 128.4, 119.6, 115.5, 112.6, 22.0, 21.4.
Synthesis of SEAM (3,3′-(1,2-Dimethyl-1,2-ethenediyl)bis[2-[(diethylamino)methyl]phenol)
To a solution of 3,3′-[1,2-Dimethyl-1,2-ethenediyl]bis phenol (1 equivalent) in 15 ml of methanol were added paraformaldehyde (2.1 equivalents) and amine (2.2 equivalents). The reaction mixture was refluxed until completion. Then mixture is cooled, concentrated, diluted with ethyl acetate, and treated with 1 m HCl solution. Aqueous phase is separated and treated with 1 m NaOH solution until pH is 7. Then this aqueous solution is extracted with ethyl acetate, concentrated and dried in vacuum and SEAM was purified by flash chromatography over silica gel (dichloromethane:methanol:triethylamine mixture; 99:0.5:0.5) (E/Z : 4:1) 1H NMR (CDCl3): δ 6.6–6.5 (m, 2H), 6.4 (s, 2H), 6.2 (dd, 2H, J = 2 Hz), 3.5 & 3.3 (2s, 4H), 2.4 (q, 8H, J = 7.5 Hz), 2.0 & 1.8 (2s, 6H), 1.0 (t, 12H, J = 7.5 Hz); 13C NMR (CDCl3): δ 157.3, 145.3, 132.3, 127.2, 124.2, 120.2, 119.2, 116.5, 56.7, 48.3, 46.2, 23.2, 21.4, 11.2.
Construction of pSPL3-PKCδ Minigene
The pSPL3 vector was modified to remove cryptic 5′ splice sites as described in our previous publication (26). The pSPL3 vector was digested with BamHI (in the MCS) and NheI. Primers to amplify genomic PKCδ from 3T3L1 cells flanked mouse PKCδ exon 9 and were designed to include the BclI site in the forward primer (in bold type) and BcuI site in the reverse primers (in bold type). The forward primer was designed to amplify 137 bp of 3′ intronic sequence such that the product contained the branch point and 3′ splice site and the reverse primer included 284 bp 5′ intronic sequence and included the 5′ splice site II of exon 9. The primers were: forward primer 5′-TGGTGATCAAGGAATGAGACCTGGGAGACC-3′; reverse primer 5′-AGAACTAGTTTTCAGTCTACATGACTCCC-3′. The product was verified by sequencing and ligated into the digested pSPL3 vector. The overhangs of the selected restriction enzymes can hybridize and this enabled cloning of the PCR product in the proper orientation. The resulting pSPL3-PKCδ minigene was verified by restriction digestion and sequencing.
Statistical Analysis
The PCR gels were densitometrically analyzed using UN-SCAN-ITTM software (Silk Scientific, Inc.). Western blots were analyzed using AlphaView® software from ProteinSimpleTM. The mice cohorts (n = 5) were obtained from Dr. You and experiment repeated thrice for reproducibility. PRISMTM software was used for statistical analysis. Two-way ANOVA or matched Student's t test was used in the analysis. A level of p < 0.05 was considered statistically significant.
RESULTS
Apoptosis in Differentiating 3T3L1 Preadipocytes
We initially determined the response of preadipocytes and mature adipocytes to serum starvation as an inducer of apoptosis. Apoptosis was observed in serum-starved preadipocytes (day 0) compared with mature adipocytes (day 10) as seen by DNA fragmentation. FITC Annexin V was used to quantitatively assess cells undergoing apoptosis along with propidium iodide to enable detection of percentage of cells undergoing either early apoptosis or late apoptosis. Annexin V binds to phosphatidylserine which is displayed on the cell membrane of apoptotic cells and PI will stain only dead or damaged cells. Our results for Annexin-PI staining indicated apoptosis in serum-starved preadipocytes (day 0) was 3-fold higher compared with mature adipocytes (day 10). Our results also indicated that basal apoptosis was higher in preadipocytes compared with mature adipocytes (Fig. 1, a and b) during 3T3L1 preadipocyte differentiation.
FIGURE 1.
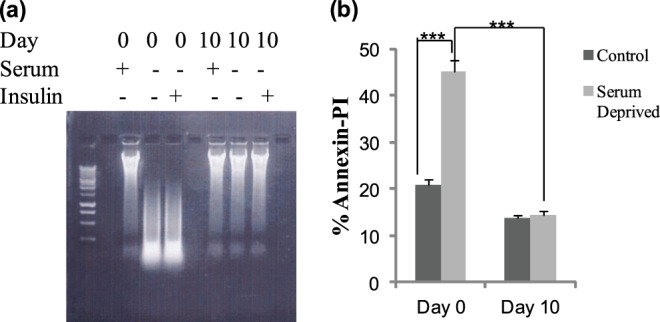
Apoptosis assay. 3T3L1 pre-adipocytes (day 0) undergo apoptosis while mature adipocytes (day 10) do not undergo apoptosis upon serum starvation as seen by (a) DNA fragmentation assay and (b) apoptosis represented as percent Annexin V-PI-positive staining using flow cytometry. Experiments were repeated five times. Statistical analysis performed by two-way ANOVA; p > 0.75; ns, not significant within group; ***, p < 0.0001 highly significant between day 0 control and serum-deprived; ***, p < 0.0001 highly significant between day 0 and 10 serum deprived.
Expression of Apoptosis Pathway Genes during Adipogenesis in 3T3L1
An analysis of gene expression involved in apoptosis during the differentiation of 3T3-L1 pre-adipocytes from days 0 to 12 was performed as they commit and differentiate into mature adipocytes. Our data indicated that between days 4 and 6 of differentiation a marked shift is observed in the expression of genes involved in pro-survival pathways and is further accentuated by increase in the splicing of anti-apoptotic proteins. We see an increase in the pro-survival proteins: PKCδII, Bcl2, Bcl-xL with a simultaneous decrease of the pro-apoptotic proteins: PKCδI and Bcl-xS. Further, we also observe an increase in the phosphorylation of AKT, Bad and PTEN which are necessary for survival pathways (Fig. 2). Adiponectin and PPARγ are markers of adipogenesis which appear by days 2 to 4 and their levels are maintained during differentiation to mature adipocytes. TNFα is secreted by preadipocytes, and its expression decreases as the cells differentiate into mature adipocytes. Our data demonstrate a crucial switch in the splicing of apoptosis genes during 3T3L1 adipocyte differentiation. This shift to pro-survival genes renders mature adipocytes resistant to apoptosis.
FIGURE 2.

Expression of apoptosis genes during 3T3L1 differentiation. a, Western blot analysis of differentiating 3T3L1 pre-adipocytes from days 0 to 12 using antibodies as indicated in the figure. Between days 4 and 6, a marked shift is observed in the splicing pattern of apoptosis genes. Increase in other survival proteins are also increased between these days. This period marks terminal differentiation of adipocytes. The blots are representative of four experiments performed individually with similar results. b, graph represents percent PKCδ exon inclusion calculated as PKCδII/(PKCδII+PKCδI)×100 and is representative of ± S.E. in four independent experiments. Statistical analysis was performed by two-way ANOVA; ***, p < 0.0001 highly significant between days 0, 2, 4, 8, 10, 12; **, p < 0.001 significant between days 4 and day 6.
Decreased PKCδII Levels Inhibit Bcl2 and Bcl-xL
Our previous studies in neuronal cells indicated that PKCδII levels directly correlated with expression of Bcl2 and Bcl-xL, which are known mediators of survival pathways in cells (19). We sought to determine whether decreased expression of PKCδII could affect the levels of Bcl2 and Bcl-xL during adipogenesis. 3T3L1 cells were transiently transfected on day 0 with either 10 nm or 50 nm PKCδII-specific siRNA (Ambion, custom designed, specificity, and target confirmed in previous studies (19)) along with its scrambled control (to eliminate off-target events) and whole cell lysates collected on day 4. Bcl2 and Bcl-xL levels were evaluated by Western blot analysis. We observe a decrease in Bcl2 and Bcl-xL expression along with decrease in XIAP expression in lysates with PKCδII knockdown (Fig. 3). Bcl2 and XIAP levels decreased by 50% indicating that additional pathways other than PKCδ may be affecting its expression during adipogenesis. However, we observe complete inhibition of BclxL expression in lysates with PKCδII knockdown.
FIGURE 3.
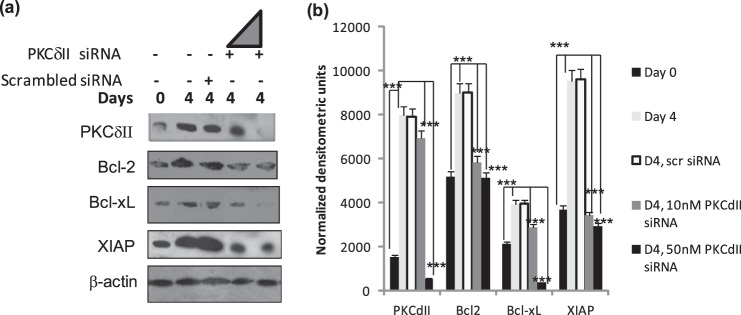
Effect of PKCδII knockdown. 3T3 preadipocytes were transiently transfected on day 0 with either scrambled siRNA, 10 nm or 50 nm PKCδII-specific siRNA. Cells were differentiated as described, and whole cell lysates were collected on day 4. a, Western blot analysis was performed with antibodies as indicated in the figure. The triangle indicates increasing amount (10 or 50 nm) siRNA. The blots are representative of four experiments performed individually with similar results. b, graph represents densitometric units normalized to β-actin for each protein and is representative of ± S.E. in four experiments. Statistical analysis was performed by two-tailed Student's t test; ***, p < 0.0001 extremely significant between control and day 4, day 4 10 nm siRNA and 50 nm siRNA for PKCδII, Bcl2, Bcl-xL, and XIAP.
Effect of PKCδ Splice Variant Overexpression on Bcl2-family Survival Genes
Next, we sought to determine whether PKCδII overexpression could affect the expression of the pro-survival proteins Bcl2 and Bcl-xL in 3T3L1 cells. PKCδII-pTracer plasmid (22) was transiently transfected (using 3T3L1 nucleofector kit, Lonza) and Western blot analysis was performed on whole cell lysates collected on days 0, 4, and 8. Overexpression of PKCδII increased Bcl2 and Bcl-xL expression (Fig. 4(i), panels a–c).
FIGURE 4.
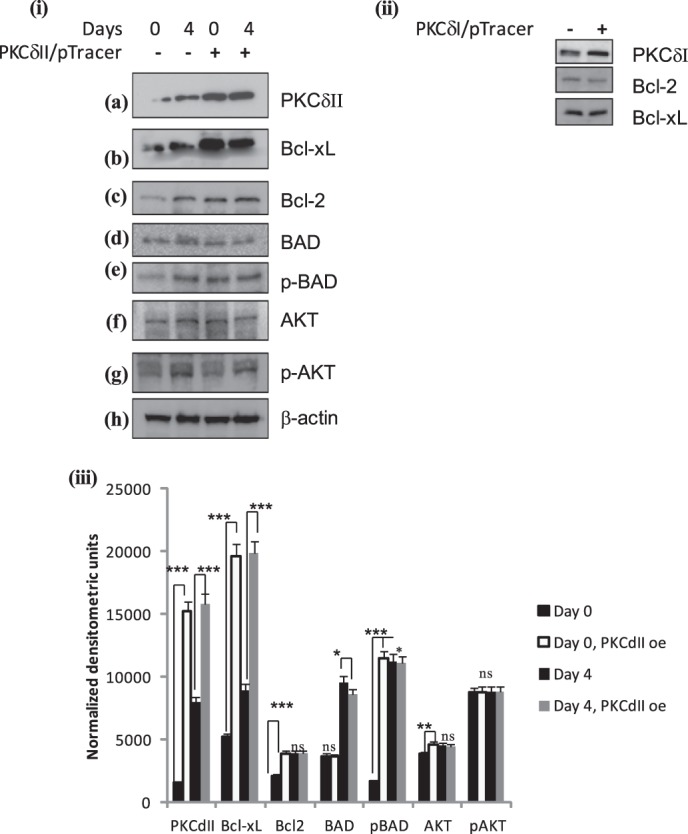
PKCδII activates survival pathway: 3T3 preadipocytes were transiently transfected on day -2 with (i) PKCδII-pTracer plasmid or (ii) PKCδI plasmid. Cells were differentiated as described, and whole cell lysates were collected on days 0 (for PKCδI and -δII overexpression) and 4 (for PKCδII overexpression). Western blot analysis was performed with antibodies as indicated in the figure. The blots are representative of three experiments performed individually with similar results. (iii) graph represents densitometric units normalized to β-actin for each protein in control day 0, 4, and PKCδII overexpression on days 0, 4 and is representative of ± S.E. in three experiments. Statistical analysis performed by two-tailed Student's t test; p > 0.75; ns, not significant; ***, p < 0.0001 extremely significant between control day 0 and day 0 PKCδII overexpression; ***, p < 0.0001 extremely significant between control day 4 and day 4 PKCδII overexpression for PKCδII, Bcl2, Bcl-xL, BAD, pBAD, AKT, pAKT.
PKCδII Expression Activated the Signaling Cascades That Affect Survival Pathways
When Bad is in a complex with Bcl2 the mitochondrial-mediated survival pathway is inhibited. Upon phosphorylation, p-BAD dissociates thereby allowing Bcl2-Bcl-xL complex to promote survival. Our data (Fig. 1) indicated that phosphorylation of BAD increased on days 4 and 6. To determine whether PKCδII could phosphorylate BAD, PKCδII was transiently transfected on day minus (−) 2 and whole cell lysates collected on days 0 and 4. Phosphorylation of BAD was analyzed by Western blot analysis. Our results show increased BAD phosphorylation (S136) with PKCδII overexpression; total BAD remained constant. Other studies have shown that p-AKT phosphorylates BAD in several cell types (27, 28). To determine if PKCδII also phosphorylated AKT to further increase p-BAD, we simultaneously determined phosphorylation of AKT. Our results indicated that overexpression of PKCδII did not increase AKT phosphorylation (Fig. 4(i), panels d–g). Hence, PKCδII phosphorylated BAD independent of AKT in 3T3 cells. In separate wells, PKCδI was transiently transfected and levels of Bcl2 and Bcl-xL were measured. Since PKCδI levels are higher in preadipocytes, transient transfection did not increase the levels above 25% of control. Further, PKCδII expression is not observed on day 0. Our results indicate that Bcl2 and Bcl-xL levels remained unaffected with PKCδI overexpression (Fig. 4(ii)).
PKCδII and BAD Associate during Adipocyte Differentiation
Since our results indicated an increase in phosphorylation of BAD with PKCδII overexpression, we sought to determine the association pattern of PKCδII and BAD during differentiation of 3T3L1 preadipocytes. 3T3L1 preadipocytes were collected on days 0 (preadipocytes), 4 (terminal differentiation) and 8 (mature adipocytes) of differentiation and immunoprecipitated with BAD. The blots were then immunoblotted with PKCδII, pBAD, and Bcl2. Our results (Fig. 5a) indicate that PKCδII and BAD association peaked by day 4 of differentiation and then declined. Bcl2 associated with BAD on day 0 but then dissociated.
FIGURE 5.

PKCδII increases BAD phosphorylation. a, 3T3 preadipocytes were differentiated in vitro, and whole cell lysates were collected on days 0, 4, and 8. (i) cells were immunoprecipitated with BAD antibody and immunoblotted with antibodies indicated in the figure. Western blot analysis was performed with antibodies as indicated in the figure. The blots are representative of three experiments performed individually with similar results. (ii) graph represents mean densitometric units from three experiments for each protein and is representative of ± S.E. in three experiments. Statistical analysis was performed by two-tailed Student's t test; p > 0.75; ns, not significant; ***, p < 0.0001 extremely significant between day 0 and day 4, day 8 for PKCδII, Bcl2, pBAD, and BAD. b, 3T3 preadipocytes were transiently transfected on day -2 with PKCδII-pTracer plasmid. Cells were differentiated as described, and whole cell lysates were collected on day 0. Cells were immunoprecipitated with BAD antibody and immunoblotted with antibodies indicated in the figure. (i) Western blot analysis was performed with antibodies as indicated in the figure. The blots are representative of three experiments performed individually with similar results. (ii) graph represents mean densitometric units from three experiments for each protein and is representative of ± S.E. in three experiments. Statistical analysis was performed by two-tailed Student's t test; p > 0.75; ns, not significant; ***, p < 0.0001 extremely significant between control and PKCδII overexpression for PKCδII, Bcl2, pBAD, and BAD.
In separate experiments, PKCδII was overexpressed and cells were immunoprecipitated using BAD antibody. Our results (Fig. 5b) indicate that phosphorylation of BAD increased in PKCδII overexpressing cells compared with control while Bcl2 dissociated from BAD.
Effect of PKCδII Expression on Apoptosis
PKCδII is a pro-survival kinase but its role for mediating apoptosis during adipogenesis is not known. Hence, we determined the extent of apoptosis in 3T3L1 preadipocytes in context to PKCδII levels. 3T3L1 preadipocytes were transiently transfected with PKCδII-pTracer plasmid. We determined the extent of apoptosis by measuring Poly (ADP-Ribose) polymerase (PARP) cleavage and XIAP expression by Western blot analysis (Fig. 6Ia). PARP cleavage which indicates ongoing apoptosis was decreased in cells with PKCδII overexpression while expression of XIAP was increased. Next, apoptosis was measured by annexin V and propidium iodide (PI) staining, and cell proliferation was measured with WST1. We observe increased cell viability in cells overexpressing PKCδII compared with control. PKCδI overexpressing cells show increased apoptosis (Fig. 6I, b and c). Hence, our results demonstrate that apoptosis levels decrease with increased PKCδII levels.
FIGURE 6.

Effect of PKCδII on apoptosis. 3T3 preadipocytes were transiently transfected on day -2 with PKCδII-pTracer plasmid. Cells were differentiated as described. Whole cell lysates were collected on days 0 and 4. (Ia) Western blot analysis was performed with antibodies as indicated in the figure. F_PARP: full-length PARP; C_PARP: cleaved PARP. The blots are representative of three experiments performed individually with similar results. (Ib) Total apoptosis was measured in day 2 control cells and cells transfected on day -2 with either PKCδI or PKCδII plasmid and collected on day 2. Annexin V-PI was analyzed by flow cytometry, and graph represents five experiments performed separately. (Ic) Graph shows cell viability of either PKCδI or PKCδII as percentage of control cells. Experiments were repeated five times. The measurements were made in triplicate in three separate experiments. Statistical analysis was performed by two-way ANOVA; p > 0.75; ns, not significant within group; ***, p < 0.0001 highly significant between control and PKCδI- or PKCδII-expressing cells. (IIa) Effect of PKCδII on adipogenesis. Western blot analysis was performed with antibodies as indicated in the figure. The blots are representative of three experiments performed individually with similar results. (IIb) Graph represents three experiments. Statistical analysis was performed by two-way ANOVA; p > 0.75; ns, not significant within group; **, p < 0.001 significant, ***, p < 0.0001 highly significant between control and PKCδII-expressing cells on days 0 and 4.
Effect of PKCδII Expression on Adipogenesis
PKCδII expression increases on day 4 when the cells terminally differentiate during adipogenesis. To observe the effect of PKCδII overexpression on adipogenesis, we immunoblotted for adiponectin and PPARγ in 3T3L1 cells overexpressing PKCδII. 3T3L1 preadipocytes were transiently transfected with PKCδII-pTracer plasmid on day 2, and whole cell lysates were collected on days 0 and 4. Our results indicate sharply increased expression of adiponectin on days 0 and 4 in cells overexpressing PKCδII compared with control cells. PPARγ1 was expressed on day 0 and by day 4, both PPARγ1 and PPARγ2 were expressed in control cells. In cells with PKCδII overexpression, we observe PPARγ 1 and 2 expression on day 0 itself. However, the expression levels of PPARγ 1 and 2 were lower compared with control cells. These results (Fig. 6II, a and b) indicate dysregulated adipogenesis program when PKCδII is overexpressed.
Resveratrol Inhibits PKCδII Levels in 3T3L1 Adipocytes
Resveratrol (3,5,4′-trihydroxystilbene) is a naturally occurring polyphenol exhibiting anti-adipogenic activities and also shown to induce apoptosis in adipocytes (29). Several studies have shown its role in inhibiting adipose cell proliferation, lipid accumulation, and stimulation of apoptosis and lipolysis in mature adipocytes. Further, resveratrol is shown to modulate alternative splicing of pre-mRNA (30). However, its mechanisms of action and target proteins in apoptotic pathway during adipogenesis was not determined. Since our results indicated that PKCδII expression modulated apoptosis in 3T3L1 cells, we treated differentiating 3T3L1 preadipocytes with increasing doses of resveratrol (10 to 100 μm). Our results indicated that 100 μm resveratrol was detrimental to the cells, and our data further indicated 25 μm as the optimal dose (data not shown). Hence, differentiating 3T3L1 cells were treated with 25 μm resveratrol either at day 0 (preadipocyte, R0) or day 5 (mature adipocyte, R5) and whole cell lysates were collected from days 0 to 8. Our results show 25 μm resveratrol administered on day 0 showed less than 10% decrease in PKCδII expression. Resveratrol treatment administered on day 5 (mature adipcoyte) inhibited PKCδII expression levels by 65% on day 6 and greater than 90% inhibition on day 8 (Fig. 7I, a–c). Simultaneously, we observed up to 50% increase in PKCδI levels on days 6 and 8.
FIGURE 7.

(I) Effect of resveratrol on PKCδ: 3T3 preadipocytes were treated with 25 μm resveratrol on day 0 (R0) or day 5 (R5). Cells were differentiated as described, and whole cell lysates were collected on days 0, 4, 6, and 8. (Ia) Western blot analysis was performed with antibodies as indicated in the figure. The blots are representative of three experiments performed individually with similar results. Graph represents (Ib) PKCδI or (Ic) PKCδII expression normalized to β-actin and represents three experiments performed separately. Statistical analysis performed by two-tailed Student's t test; ***, p < 0.0001 extremely significant between control and day 6, 8 resveratrol-treated for PKCδII. **, p < 0.001 highly significant between control and days 6, 8 resveratrol treated for PKCδI. (II) Effect of resveratrol on apoptosis. 3T3 preadipocytes were treated with 25 μm resveratrol on day 2 and collected on day 8. (IIa) Oil Red O staining for lipid accumulation. (IIb) Total apoptosis as percent Annexin V-PI staining by flow cytometry. Experiments were repeated five times. Statistical analysis was performed by two-tailed Student's t test; ***, p < 0.0001 highly significant between day 8 control and day 8 resveratrol. (III) Effect of resveratrol on PKCδ in vivo. C57BL mice were fed a diet with 400 mg resveratrol (RSV) or without resveratrol (control). Adipose tissue was harvested, and total RNA was isolated. (IIIa) PCR analysis was performed with primers that detect PKCδI and PKCδII simultaneously and primers for β-actin. The experiments were repeated three times with similar results. Graph represents densitometric analysis of (IIIb) PKCδII levels normalized to β-actin and (IIIc) PKCδI levels normalized to β-actin. Statistical analysis performed by two-way ANOVA; p > 0.75; ns, not significant within group; ***, p < 0.0001 highly significant between control and resveratrol samples.
Resveratrol Increases Apoptosis and Affects Adipogenesis
Since our results indicated that resveratrol inhibited PKCδII, we sought to determine its effect on adipogenesis and apoptosis. We measured PPARγ, a marker of adipogenesis by Western blot analysis in differentiating 3T3L1 adipocytes treated with or without 25 μm resveratrol. Our results show inhibition of PPARγ2 levels on day 8; PPARγ1 levels declined by 30% (Fig. 7Ia). Differentiating 3T3L1 adipocytes were treated with or without 25 μm resveratrol on day 4 and lipid accumulation was determined by Oil Red O staining on day 8. Our results indicate greater than 75% decline in lipid accumulation in resveratrol treated cells compared with control (Fig. 7IIa). Next, to evaluate the effect of resveratrol on apoptosis, we measured total apoptosis in adipocytes treated with or without 25 μm resveratrol on day 2 and collected on day 8. Measurement of annexin V- PI staining indicated 70% of adipocytes were undergoing apoptosis when treated with 25 μm resveratrol on day 8 (Fig. 7IIb).
Resveratrol Inhibits PKCδII Expression in Vivo
To test the effects of resveratrol on PKCδII expression in vivo, we obtained RNA derived from adipose tissue from mice fed with 400 mg of resveratrol per kg body weight, once daily from the You Laboratory (University of South Florida). Earlier studies with these mice had demonstrated that 400 mg of resveratrol decreased TNFα levels and increased SIRT1 levels in adipose tissue (23). We performed PCR analysis using primers that detect PKCδI and PKCδII simultaneously for control and resveratrol-treated samples. Our results (Fig. 7III, a–c) demonstrate a 70% decrease in PKCδII expression and 25% increase in PKCδI expression in adipose tissue from mice treated with resveratrol.
PKCδII-specific Inhibitor
Currently, there are no inhibitors available for PKCδII. Our data indicated that resveratrol inhibited differentiation of 3T3L1 adipocytes and also inhibited PKCδII expression. Hence, we sought to evaluate structural analogs of resveratrol for their ability to inhibit PKCδII expression without disrupting expression of other genes during adipogenesis. Resveratrol is a naturally occurring stilbenoid and hence we evaluated synthetic stilbenoids for their effect on PKCδ splice variants. 3-Hydroxystilbene was modified by Mannich coupling to add bis-diethylaminomethyl group (described in “Materials and Methods”). We evaluated several synthetic stilbenoids with structural modifications to the basic resveratrol structure. Among the tested analogs, SEAM (at 100 nm) inhibited PKCδII splicing by 60% while PKCδI expression was not affected (data not shown). We then evaluated a higher dose of 200 nm, and our data indicated that SEAM decreased PKCδII by 80% compared with control cells (Fig. 8a). To determine its specificity, we immunoblotted for other PKC family isoforms including cPKCs: α, βI, βII, γ; nPKCs: η, ϵ, θ; aPKCs: ζ, λ. SEAM did not affect the expression levels of these PKC isoforms (Fig. 8b). Interestingly, treatment with SEAM did not affect PKCδI levels; however, Bcl2 levels decreased by 40% while BclxL levels decreased by 20% (Fig. 8c). We immunoblotted for PPARγ and adiponectin to determine whether SEAM affected differentiation of 3T3L1 cells. SEAM treatment decreased PPARγ2 by 5% and adiponectin by 20% on days 4 and 8 compared with control. Total apoptosis was measured by flow cytometry using Annexin V-PI staining (Fig. 8d). To determine whether SEAM was toxic to cells, we evaluated cell viability upon treatment of 200 nm SEAM in 3T3L1 cells. Cytotoxicity was measured using the 3-(4, 5-dimethyl-2-thiazolyl)-2, 5-diphenyl-2H-tetrazolium bromide (MTT) assay. This assay measures the reducing potential of the cell using a colorimetric reaction. Viable cells will reduce the MTS reagent to a colored formazan product. Data indicated that 3T3L1 cells treated with SEAM were viable with their apoptosis levels increased compared with control cells (Fig. 8e). These data are in concurrence with extent of apoptosis seen with decreased PKCδII levels in 3T3L1 cells.
FIGURE 8.

3T3L1 preadipocytes were treated with 200 nm SEAM on day 0 and maintained throughout in culture. Cells were differentiated as described and total RNA was collected on days 0 (D0), 4 (D4), and 8 (D8). a, PCR analysis was performed with PKCδII-specific primers and primers for β-actin. The blots are representative of four experiments performed individually with similar results. b, graph represents PKCδII mRNA normalized to β-actin and represents four experiments performed separately. Statistical analysis was performed by two-way ANOVA; p > 0.75; ns, not significant within group; ***, p < 0.0001 highly significant between control and SEAM on days 4 and 8. c and d, Western blot analysis was performed with antibodies as indicated in the figure. e, graph shows apoptosis represented as percent Annexin V-PI-positive staining using flow cytometry. f, graph shows cell viability as percentage of control cells. Experiments were repeated five times. The measurements were made in triplicate in three separate experiments. Statistical analysis was performed by two-tailed Student's t test; ***, p < 0.0001 highly significant between control and SEAM on day 2.
Effect of SEAM on PKCδ Splicing Minigene
Splicing minigenes are advantageous to study alternative splicing events without influence from endogenous factors. Hence to determine whether resveratrol affected PKCδ alternative splicing directly and was not due to effects of resveratrol on 3T3L1 differentiation, we used PKCδ splicing minigene. Splicing minigene pSPL3-PKCδ (see “Materials and Methods”) was transiently transfected on day 2. Utilization of 5′ splice site I (SSI) on exon 9 gives rise to PKCδI while utilization of downstream 5′ splice site II (SSII) gives rise to PKCδII. On day 3, the cells were treated with either 25 μm resveratrol or 200 nm SEAM. Cells were harvested on day 4 and total RNA isolated for RT-PCR using primers for PKCδ and SA on pSPL3-PKCδ as shown in the schematic. Our results indicate that resveratrol increased utilization of SSI while decreasing utilization of SSII. SEAM inhibited utilization of 5′ splice site II without affecting utilization of SSI (Fig. 9). These results indicate that SEAM inhibits alternative splicing and utilization of SSII thereby inhibiting PKCδII expression.
FIGURE 9.
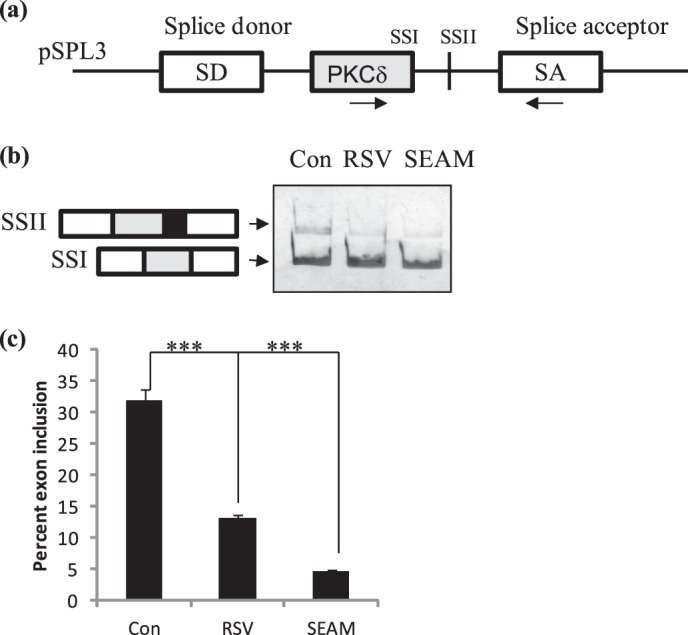
PKCδ splicing minigene. a, schematic of splicing minigene pSPL3-PKCδ. Mouse PKCδ exon 9 and its flanking 3′ and 5′ introns were cloned into the MCS of pSPL3 vector as described in “Materials and Methods.” b, 3T3 preadipocytes were transiently transfected on day 2 with pSPL3-PKCδ splicing minigene. Cells were treated with SEAM (200 nm) or resveratrol (RSV, 25 μm) after 24 h. Cells were differentiated as described and total RNA collected on day 4. PCR was performed using PKCδ to SA primers on the minigene (arrows shown on schematic). c, graph represents percent 5′ splice site (SS) utilization of PKCδ exon 9 calculated as SSII/(SSII+SSI)×100 and is representative of ± S.E. in four independent experiments. Statistical analysis was performed by two-tailed Student's t test; ***, p < 0.0001 highly significant between control and resveratrol and SEAM.
DISCUSSION
We have identified a signaling kinase whose splice variants are differentially expressed during the adipogenesis program such that it contributes to the phenotypic characteristics of the mature adipocyte. Adipogenesis is initiated by transcriptional factors and their cofactors and the process is further sculptured by several players. In this study we have demonstrated the developmental regulation of alternative splicing of PKCδ during adipogenesis in mouse 3T3L1 adipocytes.
Apoptosis or programmed cell death is a process which not only turns over the cells but also aids to define mature cells during development. Our data and others demonstrate that 3T3L1 preadipocytes are susceptible to apoptosis. However, our data indicated that upon differentiation into mature adipocytes they were resistant to apoptosis. We show an increased expression of survival genes when 3T3L1 cells differentiate into mature adipocytes. The lipids and triglycerides accumulated in mature adipocytes contribute to obesity. Upon weight loss, these adipocytes shrink in size but do not undergo apoptosis (31). Hence, we determined the expression of genes involved in apoptosis during adipogenesis. PKCδ is signaling kinase which triggers proteins in the apoptosis cascade which ultimately decides cellular apoptosis or survival (32–36). This dual role of PKCδ may be explained by the presence of several alternatively spliced variants of PKCδ. Our laboratory had demonstrated the function of mouse splice variants PKCδI and PKCδII. PKCδI promotes apoptosis while PKCδII promotes survival in neuronal cells (19). In this study, we show that PKCδI is expressed in early stages of adipogenesis and then tapers off while PKCδII expression increases day 4 onwards and is maintained in mature adipocytes. Our loss of function and gain of function experiments with PKCδ splice variants indicates that PKCδII inhibits apoptosis and increases survival in 3T3L1 adipocytes. It is interesting to note that ongoing basal apoptosis is required in differentiating cells as they commit to the adipocyte lineage. Our data suggest that PKCδII phosphorylates BAD thereby leading to its dissociation from Bcl2. This triggers the survival cascade, which ultimately contributes to mature adipocytes that are resistant to apoptosis.
The process of adipogenesis is mimicked in 3T3L1 cells by differentiating them in vitro. The cells are plated as proliferating pre-adipocytes and when confluent, the differentiation process is started (referred to as day 0). The cells undergo mitotic clonal expansion and start differentiating. Day 2 marks early differentiation. By day 4, the cells terminally differentiate and by day 8 onwards, mature adipocytes are formed. These can also be visualized for lipid accumulation by Oil Red O staining. Hence, we refer to the days in our experiments as they mark a specific stage of adipogenesis. Our data indicate increased PKCδII expression day 4 onwards. Hence, this suggests that PKCδII may also modulate terminal differentiation in preadipocytes. Expression of several genes such as pPTEN and pBAD, which indicate survival and adiponectin which is secreted during adipogenesis is reduced by day 12. A possible explanation is that mature adipocytes which are large and laden with lipids decrease their adiponectin production as seen in obesity.
Resveratrol (3,5,4′-trihydroxystilbene) is a naturally occurring polyphenol obtained in higher concentrations in skin of red grapes. It exhibits anti-adipogenic activities and also shown to induce apoptosis in adipocytes (29). Several studies have shown its role in inhibiting adipose cell proliferation, lipid accumulation and stimulation of apoptosis and lipolysis in mature adipocytes. It is also a potent activator of sirtuin 1 (silent mating type information regulation 2 homolog 1 (Sirt1)), which plays a role in decreased calorie uptake and fat mobilization (7). We evaluated resveratrol since it has low toxicity; its uptake and bio-availability is established and is proven to be safe and efficient in human clinical trials (37, 38). Resveratrol was shown to inhibit PKC isozymes α and δ; however the splice variant specificity was not determined (39–41). Our laboratory has shown that PKCδ splice variants have distinct functions in apoptosis and hence we studied the effect of resveratrol on PKCδ splice variants. Our data indicated that resveratrol increased apoptosis and affected adipogenesis in 3T3L1 cells along with modulating PKCδ splice variant expression. Resveratrol decreased PKCδII expression while simultaneously increasing PKCδI expression. Using PKCδ splicing minigene we demonstrate a direct effect of resveratrol on PKCδ alternative splicing and splice site usage.
Currently, there are no PKCδII-splice variant specific inhibitors. Rottlerin, which was a widely used inhibitor for PKCδ is now shown to be not specific for PKCδ and inhibits several other kinases (24). Transfection with siRNAs often results in decreased expression with detrimental effects on cell survival. Further, splice variant specific inhibitors are not available in the market. SEAM is a structural analog of resveratrol; however, it is functionally distinct from resveratrol. SEAM does not affect adipogenesis as shown using the adipogenesis marker PPARγ. Our data demonstrate that SEAM selectively inhibits PKCδII isoform. Using a splicing minigene, we demonstrate that SEAM inhibits the utilization of 5′ splice site II thereby inhibiting PKCδII expression. It is possible that SEAM inhibits a splicing factor that is essential for PKCδII splicing. Interestingly, even though SEAM decreased PKCδII levels, Bcl2 and BclxL levels were not decreased by amounts proportionate to the level of PKCδII expression. One possibility is that other pathways feed into the Bcl2 cascade. Modeling of the inhibitor with PKCδII protein may shed further light on the possibility that SEAM may bind to PKCδII protein and may have an effect on its kinase properties affecting downstream substrates. This remains to be evaluated. Our novel inhibitor will be a valuable tool to determine the survival pathways affected by PKCδII in all tissues. This inhibitor requires further testing in other cell lines and tissues prior to its use in animal model and hence no in vivo studies were undertaken. Hence, we are currently further evaluating its safety and broader implications for in vivo studies in future studies. Our data also suggest that PKCδ splice variants contribute to terminal differentiation in differentiating adipocytes. Hence, we are undertaking further mechanistic studies to evaluate the role of PKCδ in adipogenesis. Evaluation of PKCδII-specific inhibitor may have profound therapeutic implications for its role in obesity management.
Acknowledgments
We thank Dr. Andrea Moor for help with acquiring microscopic images and Dr. Pengfei Li for assistance with DNA fragmentation assay. The contents do not represent the views of the Department of Veterans Affairs or the United States Government.
This work was supported by a Department of Veterans Affairs Medical Research grant (to N. A. P.).
- WAT
- white adipose tissue
- PKCδ
- protein kinase Cδ
- PPAR
- peroxisome proliferator-activated receptors
- C/EBP
- CCAAT-enhancer-binding proteins
- RSV
- resveratrol
- PI
- propidium iodide.
REFERENCES
- 1. Brun R. P., Spiegelman B. M. (1997) PPARγ and the molecular control of adipogenesis. J. Endocrinol. 155, 217–218 [DOI] [PubMed] [Google Scholar]
- 2. Farmer S. R. (2005) Regulation of PPARγ activity during adipogenesis. Int. J. Obes. 29, S13–S16 [DOI] [PubMed] [Google Scholar]
- 3. Rosen E. D., MacDougald O. A. (2006) Adipocyte differentiation from the inside out. Nat. Rev. Mol. Cell Biol. 7, 885–896 [DOI] [PubMed] [Google Scholar]
- 4. Green H., Kehinde O. (1975) An established preadipose cell line and its differentiation in culture. II. Factors affecting the adipose conversion. Cell 5, 19–27 [DOI] [PubMed] [Google Scholar]
- 5. Mandrup S., Loftus T. M., MacDougald O. A., Kuhajda F. P., Lane M. D. (1997) Obese gene expression at in vivo levels by fat pads derived from s.c. implanted 3T3-F442A preadipocytes. Proc. Natl. Acad. Sci. U.S.A. 94, 4300–4305 [DOI] [PMC free article] [PubMed] [Google Scholar]
- 6. Shibasaki M., Takahashi K., Itou T., Miyazawa S., Ito M., Kobayashi J., Bujo H., Saito Y. (2002) Alterations of insulin sensitivity by the implantation of 3T3-L1 cells in nude mice. A role for TNF-α?. Diabetologia 45, 518–526 [DOI] [PubMed] [Google Scholar]
- 7. Mader I., Wabitsch M., Debatin K. M., Fischer-Posovszky P., Fulda S. Identification of a novel proapoptotic function of resveratrol in fat cells: SIRT1-independent sensitization to TRAIL-induced apoptosis. Faseb. J. 24, 1997–2009 [DOI] [PubMed] [Google Scholar]
- 8. Sorisky A., Magun R., Gagnon A. M. (2000) Adipose cell apoptosis: death in the energy depot. Int. J. Obes. Relat. Metab. Disord. 24, S3–S7 [DOI] [PubMed] [Google Scholar]
- 9. Magnelli L., Cinelli M., Turchetti A., Chiarugi V. P. (1994) Bcl-2 overexpression abolishes early calcium waving preceding apoptosis in NIH-3T3 murine fibroblasts. Biochem. Biophys. Res. Commun. 204, 84–90 [DOI] [PubMed] [Google Scholar]
- 10. Ao L., Liu J. Y., Gao L. H., Liu S. X., Yang M. S., Huang M. H., Cao J. (2008) Differential expression of genes associated with cell proliferation and apoptosis induced by okadaic acid during the transformation process of BALB/c 3T3 cells. Toxicol. In Vitro 22, 116–127 [DOI] [PubMed] [Google Scholar]
- 11. Xiao Y., Yuan T., Yao W., Liao K. (2010) 3T3-L1 adipocyte apoptosis induced by thiazolidinediones is peroxisome proliferator-activated receptor-γ-dependent and mediated by the caspase-3-dependent apoptotic pathway. FEBS J. 277, 687–696 [DOI] [PubMed] [Google Scholar]
- 12. Hastings M. L., Krainer A. R. (2001) Pre-mRNA splicing in the new millennium, Curr. Opin Cell Biol. 13, 302–309 [DOI] [PubMed] [Google Scholar]
- 13. Kawahigashi H., Harada Y., Asano A., Nakamura M. (1998) A cis acting regulatory element that affects the alternative splicing of a muscle-specific exon in the mouse NCAM gene. Biochim. Biophys. Acta 1397, 305–315 [DOI] [PubMed] [Google Scholar]
- 14. Libri D., Piseri A., Fiszman M. Y. (1991) Tissue specific splicing in vivo of the beta tropomyosin gene: dependence on an RNA secondary structure. Science 252, 1842–1845 [DOI] [PubMed] [Google Scholar]
- 15. Muro A. F., Iaconcig A., Baralle F. E. (1998) Regulation of the fibronectin EDA exon alternative splicing. Cooperative role of exonic enhancer element and the 5′ splicing site. FEBS Lett. 437, 137–141 [DOI] [PubMed] [Google Scholar]
- 16. Du K., Peng Y., Greenbaum L. E., Haber B. A., Taub R. (1997) HRS/SRp40-mediated inclusion of the fibronectin E111B exon, a Possible cause of increased EIIIB expression in proliferating liver. MCB 17, 4096–4104 [DOI] [PMC free article] [PubMed] [Google Scholar]
- 17. Chalfant C. E., Mischak H., Watson J. E., Winkler B. C., Goodnight J., Farese R. V., Cooper D. R. (1995) Regulation of alternative splicing of protein kinase Cβ by insulin. J. Biol. Chem. 270, 13326–13332 [DOI] [PubMed] [Google Scholar]
- 18. Patel N. A., Chalfant C. E., Watson J. E., Wyatt J. R., Dean N. M., Eichler D. C., Cooper D. R. (2001) Insulin regulates alternative splicing of protein kinase C βII through a phosphatidylinositol 3-kinase-dependent pathway involving the nuclear serine/arginine-rich splicing factor, SRp40, in skeletal muscle cells. J. Biol. Chem. 276, 22648–22654 [DOI] [PubMed] [Google Scholar]
- 19. Apostolatos A., Song S., Acosta S., Peart M., Watson J. E., Bickford P., Cooper D. R., Patel N. A. (2012) Insulin promotes neuronal survival via the alternatively spliced protein kinase C δII isoform. J. Biol. Chem. 287, 9299–9310 [DOI] [PMC free article] [PubMed] [Google Scholar]
- 20. Patel N. A., Song S. S., Cooper D. R. (2006) PKCδ alternatively spliced isoforms modulate cellular apoptosis in retinoic acid-induced differentiation of human NT2 cells and mouse embryonic stem cells. Gene Expr. 13, 73–84 [DOI] [PMC free article] [PubMed] [Google Scholar]
- 21. Jiang K., Apostolatos A. H., Ghansah T., Watson J. E., Vickers T., Cooper D. R., Epling-Burnette P. K., Patel N. A. (2008) Identification of a novel antiapoptotic human protein kinase C δ isoform, PKCδVIII in NT2 cells. Biochemistry 47, 787–797 [DOI] [PubMed] [Google Scholar]
- 22. Sakurai Y., Onishi Y., Tanimoto Y., Kizaki H. (2001) Novel protein kinase C δ isoform insensitive to caspase-3. Biol. Pharm Bull 24, 973–977 [DOI] [PubMed] [Google Scholar]
- 23. Ajmo J. M., Liang X., Rogers C. Q., Pennock B., You M. (2008) Resveratrol alleviates alcoholic fatty liver in mice. Am. J. Physiol. Gastrointestinal Liver Physiol. 295, G833–G842 [DOI] [PMC free article] [PubMed] [Google Scholar]
- 24. Soltoff S. P. (2007) Rottlerin: an inappropriate and ineffective inhibitor of PKCδ. Trends Pharmacol. Sci. 28, 453–458 [DOI] [PubMed] [Google Scholar]
- 25. Carter G., Apostolatos A., Patel R., Mathur A., Cooper D., Murr M., Patel N. A. (2013) Dysregulated alternative splicing pattern of PKC during differentiation of human preadipocytes represents distinct differences between lean and obese adipocytes. ISRN Obesity 2013, 10.1155/2013/161345 [DOI] [PMC free article] [PubMed] [Google Scholar]
- 26. Apostolatos H., Apostolatos A., Vickers T., Watson J. E., Song S., Vale F., Cooper D. R., Sanchez-Ramos J., Patel N. A. (2010) Vitamin A metabolite, all-trans-retinoic acid, mediates alternative splicing of protein kinase C δVIII (PKCδVIII) isoform via splicing factor SC35. J. Biol. Chem. 285, 25987–25995 [DOI] [PMC free article] [PubMed] [Google Scholar]
- 27. Datta S. R., Dudek H., Tao X., Masters S., Fu H., Gotoh Y., Greenberg M. E. (1997) Akt phosphorylation of BAD couples survival signals to the cell-intrinsic death machinery. Cell 91, 231–241 [DOI] [PubMed] [Google Scholar]
- 28. Yip W. K., Leong V. C., Abdullah M. A., Yusoff S., Seow H. F. (2008) Overexpression of phospho-Akt correlates with phosphorylation of EGF receptor, FKHR and BAD in nasopharyngeal carcinoma. Oncol Rep. 19, 319–328 [PubMed] [Google Scholar]
- 29. Rayalam S., Yang J. Y., Ambati S., Della-Fera M. A., Baile C. A. (2008) Resveratrol induces apoptosis and inhibits adipogenesis in 3T3-L1 adipocytes. Phytother Res 22, 1367–1371 [DOI] [PubMed] [Google Scholar]
- 30. Sakla M. S., Lorson C. L. (2008) Induction of full-length survival motor neuron by polyphenol botanical compounds. Human Genetics 122, 635–643 [DOI] [PubMed] [Google Scholar]
- 31. Guilherme A., Virbasius J. V., Puri V., Czech M. P. (2008) Adipocyte dysfunctions linking obesity to insulin resistance and type 2 diabetes. Nat. Rev. Mol. Cell Biol. 9, 367–377 [DOI] [PMC free article] [PubMed] [Google Scholar]
- 32. Peluso J. J., Pappalardo A., Fernandez G. (2001) Basic fibroblast growth factor maintains calcium homeostasis and granulosa cell viability by stimulating calcium efflux via a PKCδ-dependent pathway. Endocrinology 142, 4203–4211 [DOI] [PubMed] [Google Scholar]
- 33. Kilpatrick L. E., Lee J. Y., Haines K. M., Campbell D. E., Sullivan K. E., Korchak H. M. (2002) A role for PKCδ and PI 3-kinase in TNFα-mediated antiapoptotic signaling in the human neutrophil. Am. J. Physiol. Cell Physiol. 283, C48–C57 [DOI] [PubMed] [Google Scholar]
- 34. McCracken M. A., Miraglia L. J., McKay R. A., Strobl J. S. (2003) Protein kinase C δ is a prosurvival factor in human breast tumor cell lines. Mol. Cancer Ther. 2, 273–281 [PubMed] [Google Scholar]
- 35. Zhang J., Hung A. C., Ng P. Y., Nakayama K., Hu Y., Li B., Porter A. G., Dhakshinamoorthy S. (2009) PKCδ mediates Nrf2-dependent protection of neuronal cells from NO-induced apoptosis. Biochem. Biophys. Res. Commun. 386, 750–756 [DOI] [PubMed] [Google Scholar]
- 36. Liu S., Yuan Q., Zhao S., Wang J., Guo Y., Wang F., Zhang Y., Liu Q., Zhang S., Ling E. A., Hao A. (2011) High glucose induces apoptosis in embryonic neural progenitor cells by a pathway involving protein PKCδ. Cell Signal. 23, 1366–1374 [DOI] [PubMed] [Google Scholar]
- 37. Cheng A. L., Hsu C. H., Lin J. K., Hsu M. M., Ho Y. F., Shen T. S., Ko J. Y., Lin J. T., Lin B. R., Ming-Shiang W., Yu H. S., Jee S. H., Chen G. S., Chen T. M., Chen C. A., Lai M. K., Pu Y. S., Pan M. H., Wang Y. J., Tsai C. C., Hsieh C. Y. (2001) Phase I clinical trial of curcumin, a chemopreventive agent, in patients with high-risk or pre-malignant lesions. Anticancer Res. 21, 2895–2900 [PubMed] [Google Scholar]
- 38. Aggarwal B. B., Bhardwaj A., Aggarwal R. S., Seeram N. P., Shishodia S., Takada Y. (2004) Role of resveratrol in prevention and therapy of cancer: preclinical and clinical studies. Anticancer Res. 24, 2783–2840 [PubMed] [Google Scholar]
- 39. Atten M. J., Godoy-Romero E., Attar B. M., Milson T., Zopel M., Holian O. (2005) Resveratrol regulates cellular PKCα and -δ to inhibit growth and induce apoptosis in gastric cancer cells. Investigational New Drugs 23, 111–119 [DOI] [PubMed] [Google Scholar]
- 40. Stewart J. R., O'Brian C. A. (2004) Resveratrol antagonizes EGFR-dependent Erk1/2 activation in human androgen-independent prostate cancer cells with associated isozyme-selective PKCα inhibition. Investigational New Drugs 22, 107–117 [DOI] [PubMed] [Google Scholar]
- 41. Woo J. H., Lim J. H., Kim Y. H., Suh S. I., Min D. S., Chang J. S., Lee Y. H., Park J. W., Kwon T. K. (2004) Resveratrol inhibits phorbol myristate acetate-induced matrix metalloproteinase-9 expression by inhibiting JNK and PKCδ signal transduction. Oncogene 23, 1845–1853 [DOI] [PubMed] [Google Scholar]