

Background: The effect of HDAC inhibitor kinetic properties on biological function is currently unknown.
Results: The kinetic rate constants of HDAC inhibitors differentially affect histone acetylation, cell viability, and gene expression.
Conclusion: Evaluating HDAC inhibitor properties using histone acetylation is not predictive of their function on cellular activity.
Significance: Characterizing the biological effect of different HDAC inhibitors will help to evaluate their clinical utility.
Keywords: Cell Cycle, Cell Death, Crystallography, Gene Expression, Histone Deacetylase, Histone Deacetylase Inhibitors, Histone Modification, Binding Kinetics
Abstract
Histone deacetylases (HDACs) are critical in the control of gene expression, and dysregulation of their activity has been implicated in a broad range of diseases, including cancer, cardiovascular, and neurological diseases. HDAC inhibitors (HDACi) employing different zinc chelating functionalities such as hydroxamic acids and benzamides have shown promising results in cancer therapy. Although it has also been suggested that HDACi with increased isozyme selectivity and potency may broaden their clinical utility and minimize side effects, the translation of this idea to the clinic remains to be investigated. Moreover, a detailed understanding of how HDACi with different pharmacological properties affect biological functions in vitro and in vivo is still missing. Here, we show that a panel of benzamide-containing HDACi are slow tight-binding inhibitors with long residence times unlike the hydroxamate-containing HDACi vorinostat and trichostatin-A. Characterization of changes in H2BK5 and H4K14 acetylation following HDACi treatment in the neuroblastoma cell line SH-SY5Y revealed that the timing and magnitude of histone acetylation mirrored both the association and dissociation kinetic rates of the inhibitors. In contrast, cell viability and microarray gene expression analysis indicated that cell death induction and changes in transcriptional regulation do not correlate with the dissociation kinetic rates of the HDACi. Therefore, our study suggests that determining how the selective and kinetic inhibition properties of HDACi affect cell function will help to evaluate their therapeutic utility.
Introduction
Over the last decade, increasing evidence has demonstrated that the ability of an organism to respond to its environment resides largely in its capacity to modulate gene expression programs by altering DNA and chromatin structure. Chromatin remodeling by the post-translational modification of histones is thought to be a central mechanism for the epigenetic regulation of gene expression (1). Although several of these modifications such as phosphorylation, ubiquitination, and ADP-ribosylation have been previously identified, the best characterized and most abundant modifications are methylation and acetylation (2). Histone acetylation is regulated by two enzyme families that are “writers” and “erasers” of these modifications. Histone acetyltransferases catalyze the transfer of an acetyl group to histones and favor chromatin opening and gene expression, whereas histone deacetylases (HDACs)4 remove acetyl groups and promote transcriptionally silent chromatin (3, 4). Eighteen HDACs have been identified in the human genome and can be divided into two main groups, the zinc-dependent HDACs (class I, II, and IV) and the NAD+-dependent sirtuins (class III). HDACs have also been divided into different classes according to phylogenic sequence and function, with HDAC1–3 and -8 belonging to class I, HDAC4, -5, -7, and -9 to class IIa, HDAC6 and HDAC10 to class IIb, and HDAC11 as the only member of class IV. Sirtuins 1–7 form class III (5).
Although it is recognized that histone acetylation plays a central role in controlling gene expression, mounting evidence indicates that dysregulation of histone acetylation is a common feature associated with a wide range of disorders, including cardiovascular diseases, cancer, inflammation, metabolic disorders, and neurological diseases (6–10). Indeed, alteration of histone acetylation levels have been observed in multiple forms of cancer (11). One of the best examples is the aberrant activity of class I HDACs in t(8;21) acute myeloid leukemia, which silences AML1 target genes involved in hematopoietic stem cell differentiation and promotion of leukemogenesis (12, 13). Importantly, blocking HDAC enzymatic activity with small molecule HDAC inhibitors has been shown to reduce malignancies in vitro and in vivo by blocking the cell cycle and inducing apoptosis (14). Moreover, several HDACi, including vorinostat (SAHA), entinostat (MS-275), and valproic acid, have been tested in clinical trials with SAHA and rhomidepsin already approved for use in cutaneous T-cell lymphoma patients.
Recent work has implicated disruption of histone acetylation in neurodegenerative diseases of aging such as amyotrophic lateral sclerosis and Alzheimer disease and in psychiatric conditions such as schizophrenia (1, 9, 15, 16). In particular, increased levels of HDAC2 have been described in the spinal cord of human patients with amyotrophic lateral sclerosis as well as in the hippocampus of patients suffering from Alzheimer disease, although HDAC2 levels have been found to be decreased in the nucleus accumbens of depressed patients studied postmortem (2, 17–19). Moreover, HDACi have been shown to rescue neurological symptoms in mouse models of amyotrophic lateral sclerosis, Alzheimer disease, and depression, suggesting that HDACi could be used in the treatment of chronic neurological diseases (3, 4, 20–23).
In light of the potential clinical utility of HDACi, it has been suggested that HDACi with increased isozyme selectivity and potency would exhibit fewer side effects caused by inhibition of inappropriate isoforms (5, 7, 24). Accordingly, significant efforts have been made to identify HDACi with improved HDAC isozyme selectivity (6–10, 25–27). Among them, novel selective benzamide-based HDAC1/2 inhibitors have been described that exhibit greater than 100-fold selectivity relative to other HDACs (11, 28).
Here, we investigated the pharmacological and biological properties of the pan-HDACi SAHA and trichostatin-A (TSA), the class I-selective HDACi MS-275, and two HDAC1/2-selective inhibitors referred to herein as compounds 1 and 2. Using recombinant HDACs, we found that the benzamide HDACi are long residence time inhibitors with slow association and dissociation kinetic rates, whereas the hydroxamates SAHA and TSA possess rapid kinetic binding properties. Crystal structures of SAHA and a representative benzamide compound bound to HDAC2 suggest both chemical and structural reasons for slow binding properties for the benzamides as opposed to the hydroxamate inhibitors. At the cellular level, we discovered that the rate of modulation of histone acetylation by HDACi correlates with the in vitro kinetic properties of the inhibitors, although cell viability and changes in gene expression do not correlate with the inhibitor dissociation rate profiles. This study sheds new light on the functional consequences of using HDACi with different kinetic profiles. In particular, it suggests that the use of HDACi as therapeutic agents should be motivated not only based on their selectivity but also on their kinetic properties.
EXPERIMENTAL PROCEDURES
Cell Culture and Inhibitor Treatments
SH-SY5Y cells (Sigma) were grown in 50:50 Dulbecco's modified Eagle's medium/F-12 medium supplemented with 15% fetal bovine serum and 1× minimum essential amino acids (Invitrogen). Inhibitors were synthesized at Genentech Chemistry facilities and dissolved in DMSO to a stock concentration of 5–10 mm, so that further DMSO concentrations in media remained no higher than 0.1% upon further compound dilutions. Pulsed applications were ended with a washout consisting of media removal, two phosphate-buffered saline (PBS) washes, and fresh media replacement.
Proteros Reporter Displacement Assay
The competitive binding assay used to determine binding affinities and kinetic rate constants of HDAC inhibitors has been described previously (12, 13, 29, 30) and were carried out by Proteros. Specifically, the experiments were conducted in black 384-well polypropylene plates (Corning Glass) in a 15-μl reaction volume consisting of 11 nm HDAC1 or 50 nm HDAC2 in reaction buffer (25 mm Tris, pH 8.0, 1 mm DTT, 150 mm NaCl, 0.01% Tween 20) and reporter probes at concentrations equal to their binding affinity (Kd). Probe binding was monitored for 240 min (4 h) with measurements recorded every 8 min. The decay rate of probe displacement was used to quantify the association rate constant for test inhibitors. The Kd value was calculated using the Cheng-Prussoff equation from the IC50 value determined at the last time point taken and represents an approximate affinity measurement. At this time point, the slowly dissociating inhibitors may not have achieved a fully equilibrated state with the target enzyme, but visual inspection of the kinetic traces at these later time points indicates that the IC50 values are not expected to shift upon further incubation. The dissociation rate constant for test inhibitors was determined as the product of Kd × association rate constant.
Enzymatic HDAC Activity Assays
Biochemical assays of HDAC activity were carried out by Nanosyn in a reaction volume of 10 μl in 384-well microplates. A standard enzymatic reaction contained 5 μl of 2× HDAC inhibitor, 4 μl of 2.5× enzyme, and 1 μl of 10× substrate in assay buffer (100 mm HEPES, pH 7.5, 25 mm KCl, 0.1% BSA, 0.01% Triton X-100, 1% DMSO). Final concentration of all HDACs in the enzymatic assays was between 0.5 and 5 nm. A final substrate concentration of 1 μm FAM-RHKK(Ac)-NH2 or FAM-RHKK(trifluoroacetyl)-NH2 was used in all assays and found to be below the determined Km, app for each enzyme. All inhibitors were serially diluted in DMSO prior to cross-dilution in assay buffer and were incubated with enzyme for 15 min prior to initiating the reaction by the addition of substrate. After incubation for 3 h, the reaction was terminated by the addition of EDTA and SDS to final concentrations of 24 mm and 0.04%, respectively. The product and substrate in each reaction were separated using a 12-sipper microfluidic chip (Caliper Life Sciences, Hopkinton, MA) run on a Caliper LC3000® (Caliper Life Sciences). The separation conditions used a downstream voltage of −800V, an upstream voltage of −3000 V, and a screening pressure of −1.4 p.s.i. The product and substrate fluorescence was excited at 488 nm and detected at 530 nm. Substrate conversion was calculated from the electrophoregram using HTS Well Analyzer software (Caliper Life Sciences, Hopkinton, MA).
Western Blotting and Histone Acetylation Quantification
SH-SY5Y human neuroblastoma cells (ATCC CRL-2266) were seeded into 6-well plates (Corning Glass) to achieve ∼80% confluence (∼300,000 cells/well) at the time of cell lysis. Cells were lysed in 250 μl of hot Tris/glycine sample buffer (Laemmli buffer) per well and incubated at 95 °C for 10 min before loading into NuPAGE 16% Tris/glycine polyacrylamide gels (Invitrogen). Histones were detected via immunoblot following SDS-PAGE and transfer to nitrocellulose using the following antibodies: anti-H2B (Millipore 07-371); anti-AcH2B (Upstate 07-373); anti-AcH2BK5 (Cell Signaling 2574); anti-H3 (Millipore 06-755); anti-AcH3 (Millipore 06-599); anti-AcH3K9 (Cell Signaling 9649); anti-H3K9me2 (Cell Signaling 4658); anti-AcH3K14 (Cell Signaling 4318); anti-AcH3K18 (Cell Signaling 9675); anti-AcH3K27 (Cell Signaling 4353); anti-H4 (Millipore 05-858R); anti-AcH4 (Millipore 06-866); anti-H4K5 (Cell Signaling 9672), and anti-H4K12 (Cell Signaling 2591). The fluorescence intensity of the infrared dye-labeled secondary antibodies (LI-Cor 926-32210, -32211, -68070, and -68071) was acquired using Odyssey Imaging equipment (LI-Cor Inc.) and quantified using Odyssey software. Signal intensities were normalized to total histone level to correct for loading and sampling errors. Data are reported as fold change of DMSO control.
SH-SY5Y Cell Viability Assay
SH-SY5Y cells were maintained under normal culture conditions in a humidified incubator at 37 °C with 5% CO2 and were split twice weekly. Cells were plated in black 384-well plates (Corning Glass) at 2500 cells/well in 20-μl volume of DMEM/F-12 culture media supplemented with 10% FBS and permitted to adhere overnight. The following day, HDAC inhibitors were serially diluted in 100% DMSO, and this series was subsequently cross-diluted into culture media. 5 μl of compound diluted in media was added to the appropriate well of the cell plate to afford the indicated final concentration of inhibitor with a final 0.1% DMSO. Treated cells were incubated under normal tissue culture conditions for 6, 24, 48, 72, or 96 h prior to quantitation of cellular ATP levels as measured using CellTiter-GloTM reagents (Promega, Madison, WI) according to the manufacturer's instructions. Similarly, after 6 h of incubation with HDAC inhibitors, media from separate cell plates were aspirated, and cells were washed once with media containing no inhibitors. 25 μl of media supplemented with 10% FBS and 0.1% DMSO (no inhibitors) was added back to the cells, and cellular ATP levels were determined using CellTiter-Glo after 24, 48, 72, or 96 h of incubation. Luminescence was measured at each time point using an Envision Instrument (PerkinElmer Life Sciences) with a 0.1-s count time.
Data Analysis
Luminescent emission, % substrate conversion or % specific binding from each well was plotted as a function of the concentration of inhibitor, and the 50% inhibition (IC50) values were determined using a nonlinear least squares fit of the data to a four-parameter equation using Prism 5.0 (GraphPad Software, San Diego). Concentration-response curves for each inhibitor in the cell proliferation assay were normalized to 100% cell metabolism as determined from DMSO control.
Microarray and Gene Expression Analysis
SH-SY5Y cells were plated in 6-well plates at 300,000 cells/well and treated in replicates of five with inhibitor or a DMSO vehicle control for the indicated durations. RNA then was isolated using the RNeasy mini kit (Qiagen) with on-column DNase treatments. Starting total RNA quantity of each sample was assessed using Nanodrop-8000 (Thermo Fisher Scientific, Wilmington, DE). RNA quality was evaluated using Agilent Bioanalyzer 2100 Eukaryote Total RNA Pico assay (Agilent Technologies, Santa Clara, CA). One microgram of total RNA was processed for each sample using Agilent QuickAmp labeling kit (Agilent, catalog no. 5190-0447). Cyanine 5-labeled probes were purified using the RNeasy mini kit (Qiagen, catalog no. 74104). Seven hundred and fifty nanograms of each Cy5 probe, along with the same amount of the Cy3-labeled Universal Human Reference (Stratagene, catalog no. 740000), were hybridized onto Agilent 4 × 44,000 Whole Human Genome microarrays. Hybridization, washing, and drying of the arrays were performed on Tecan HS 4800 Pro (Tecan, Research Triangle Park, NC), according to Agilent's recommendations. Arrays were scanned using Agilent scanner G2505C. Image files were processed using Agilent's Feature Extraction software, version 10.7. All statistical analyses were performed in the R statistical programming environment using open source packages from the Bioconductor project. Background correction of raw Agilent data were performed using the normexp function in the limma package using an offset of 50. Within array normalization was performed using the normalizeWithinArrays function with the loess method. Data for duplicate probes on the Agilent array were averaged using the avereps function, and control probes were removed from subsequent analysis. Probes were filtered using the feature filter function in limma with default parameters to ensure that each gene was represented by a single probe. The arrayQualityMetrics package was used to assess the overall quality of the arrays before and after normalization. Then, a generic linear model was fit to the data using the limma package from Bioconductor. All p values reported in the text have been corrected for multiple testing using Benjamini and Hochberg's method. Hierarchical clustering of genes was performed using Euclidean Distance, using the flashClust package from BioConductor with default parameters. Complete linkage is the default agglomeration method for this package. The row dendrogram was generated using the results from the clustering analysis. The entire microarray dataset is available from Gene Expression Omnibus (GSE49158).
Gene Ontology Analysis
For gene ontology analysis, the universe of genes was limited to include only those genes that were annotated with a Biological Process term. Gene ontology analysis was performed using the GOstats package from Bioconductor. Lists of genes used in this analysis are as described in the text. Results from the gene ontology analysis were only studied if more than two genes from the experimental data set were included with a particular term.
Protein Expression and Purification of HDAC2 for Crystallographic Analysis
Human HDAC2 (residues 2–488) was cloned into a pAc-based baculovirus expression vector in-frame with a C-terminal His tag. Recombinant baculovirus was generated by co-transfection of SF9 cells with the vector and linearized baculovirus DNA. For protein expression, SF9 cells were infected at an multiplicity of infection of 1.0 and grown in shaker cultures for 72 h at 27 °C, and cell paste was harvested by centrifugation. Cell pellets were resuspended in lysis buffer (50 mm Tris-HCl, pH 8.0, 300 mm NaCl, 5 mm MgCl2, 5 mm imidazole, 15% glycerol, 1 mm TCEP, 0.1% Nonidet P-40, and protease inhibitor tablets (Roche Applied Science), lysed by homogenization and microfluidization, and cleared by ultracentrifugation at 40,000 rpm for 40 min at 4 °C. Supernatant was batch-bound overnight with nickel superflow resin (Qiagen), followed by bead collection on a gravity column and washed with 10 column volumes of wash buffer (50 mm Tris-HCl, pH 8.0, 300 mm NaCl, 5 mm imidazole, 15% glycerol, and 1 mm TCEP). Protein was then eluted from the beads with 5 column volumes of elution buffer (50 mm Tris-HCl, pH 8.0, 300 mm NaCl, 300 mm imidazole, 15% glycerol, and 1 mm TCEP). Unconcentrated elution fractions were further purified on an S200 16/60 size exclusion column (GE Healthcare) in SEC buffer (50 mm Tris-HCl, pH 8.0, 300 mm NaCl, 10% glycerol, and 1 mm TCEP). Fractions corresponding to the full-length HDAC2 were pooled and diluted to ∼0.5 mg/ml. 1 mg of protein was subjected to limited proteolysis with 4 units of immobilized l-1-tosylamido-2-phenylethyl chloromethyl ketone-treated trypsin (Pierce) at 23 °C, and digestion was monitored by SDS-PAGE. Digestion was complete when the bulk of the protein migrated as a 46-kDa band on a gel. Further digestion with additional trypsin was often needed to complete the reaction. To stop the digestion reaction, freshly prepared benzamidine was added to 0.5 mm. Undigested protein was removed by passing the sample through a small volume nickel superflow column, and flow-through was buffer-exchanged in a 10-kDa spin concentrator into crystallization buffer (25 mm Tris-HCl, pH 7.2, 250 mm NaCl, 0.125 mm TCEP, 0.5 mm benzamidine, and 5 mm CaCl2). Protein was further concentrated to 7–10 mg/ml for crystallization.
HDAC2 Crystallization and Data Collection
Diffraction quality crystals were grown by the sitting drop method by combining 1 μl of HDAC2 protein with 1 μl of mother liquor (0.1 m CHES, pH 9.5, and 40% PEG-600) and incubating at 19 °C. Crystals grew in 1–2 days to approximate dimensions of 100 × 100 μm. Crystals were soaked with 1 mm of compound (dissolved in DMSO) for 48 h. Crystals were cryoprotected in mother liquor and flash-frozen in liquid nitrogen, followed by data collection under cryo-cooled conditions (100 K) at the Stanford Synchrotron Radiation Lightsource (SSRL) beamline 11-1 (SAHA-HDAC2) or the Advanced Photon Source beamline 21-IDF (compound 1-HDAC2). Data were processed with HKL2000 and SCALEPACK (14, 31). Datasets belonged to the P212121 space group with approximate unit cell dimensions of a = 92 Å, b = 98 Å, and c = 139 Å, α = β = γ = 90°. Data processing statistics can be found in Table 1. The Protein Data Bank codes for the structure of HDAC2 in complex with SAHA and compound 1 are RCSB081226, PBD ID code 4LXZ and RCSB081228, PBD ID code 4LY1, respectively.
TABLE 1.
HDAC2 data collection and refinement statistics
Values in parentheses are for highest resolution shell.
| SAHA-HDAC2 | Compound 1-HDAC2 | |
|---|---|---|
| Data collection | ||
| Wavelength (Å) | SSRL 11-1 | APS 21-IDF |
| Space group | P212121 | P212121 |
| Cell dimensions | ||
| a, b, c | 91.97, 97.60, 138.83 Å | 92.03, 97.49, 138.92 Å |
| α, β, γ | 90, 90, 90° | 90, 90, 90° |
| Resolution | 50-1.85 Å (1.88-1.85 Å) | 50-1.57 Å (1.63 to 1.57 Å) |
| Rmerge | 0.085 (0.532) | 0.074 (0.587) |
| I/σI | 12.6 (1.9) | 21.0 (3.1) |
| Completeness | 98.1% (95.9%) | 100% (100%) |
| Redundancy | 3.0 (2.9) | 5.6 (5.5) |
| Wilson B-factor | 18.2 | 18.9 |
| Refinement statistics | ||
| Resolution | 27.09 to 1.85 Å | 33.57 to 1.57 Å |
| Reflections (total/test) | 105,047/5254 | 174,095/8703 |
| Rwork/Rfree | 16.1/19.2% | 17.0/18.7% |
| Atoms | ||
| Protein | 8957 | 8963 |
| Water | 923 | 846 |
| Ligand | 57 | 75 |
| Metals | 9 | 9 |
| Solvent | 117 | 117 |
| Root mean square deviations | ||
| Bond lengths | 0.010 Å | 0.010 Å |
| Bond angles | 0.98° | 1.00° |
| Mean B-factor | 20.1 Å2 | 22.7 Å2 |
| Ramachandran statistics | ||
| Most favored | 98.5% | 98.3% |
| Outliers | 0.0% | 0.0% |
HDAC2 Structure Determination
Initial phases were calculated by the molecular replacement with PHASER (32) using the published structure of HDAC2 (33) (Protein Data Bank code 3MAX) minus waters and ligands as a search model. Ligand fitting was carried out using Ligandfit from the Phenix package (1, 34). Iterative rounds of model adjustment and addition of water and solvent molecules were carried out using COOT (2, 35), followed by coordinate and b-factor refinement with Phenix and BUSTER (3, 4, 36). Final refinement statistics can be found in Table 1. Ramachandran statistics calculated by MolProbity (5, 37) indicated >98% of residues lie in the favored regions, with <0.2% outliers. Structural figures were prepared with PyMOL (The PyMOL Molecular Graphics System, Schrödinger, LLC) and MOE (Chemical Computing Group; Montreal, Canada).
RESULTS
Benzamide HDACi Are More Isoform-selective than Hydroxamate HDACi
Benzamide-containing HDACi such as MS-275 are known to inhibit HDACs by a similar zinc-chelating mechanism as the hydroxamate-based inhibitors (e.g. SAHA). They have also been demonstrated to possess greater isoform selectivity profiles, targeting specifically only the class I subgroup of HDACs (6–10, 26, 38, 39). We examined the pharmacological inhibition profile of MS-275 and two other benzamides (compound 60 and 33 (11, 28, 40) (named hereafter compound 1 (C1) and compound 2 (C2), respectively)), and two hydroxamate-containing inhibitors SAHA and TSA against HDAC1–10 (Fig. 1). The inhibitory potency of all compounds confirmed previous findings including that MS-275 is a submicromolar HDAC1–3 inhibitor whereas, C1 and C2 inhibit HDAC1 and HDAC2 in the 10–50 nm range with no detectable inhibition of HDAC3 (Table 2) (41). Interestingly, although no inhibition of HDACs4–9 by C1 and C2 was detected, micromolar potency for HDAC10 was observed. SAHA and TSA exhibited potencies against HDAC1 and HDAC2 comparable with C1 and C2, but their selectivity profiles extended well beyond these isoforms as reported previously (12, 13, 26, 29, 30, 38). SAHA and TSA inhibited HDAC3 ∼13- and ∼175-fold more potently than did MS-275. Moreover, although TSA is a submicromolar inhibitor of 8 out of 10 HDACs tested, SAHA inhibited only class I and IIb subgroups of HDACs with similar potency and did not demonstrate any inhibition for class IIa isoforms (Table 2). Thus, similar potencies were seen between different chemical classes of compounds for HDAC1/2 and confirmed the increased selectivity profile toward benzamides.
FIGURE 1.
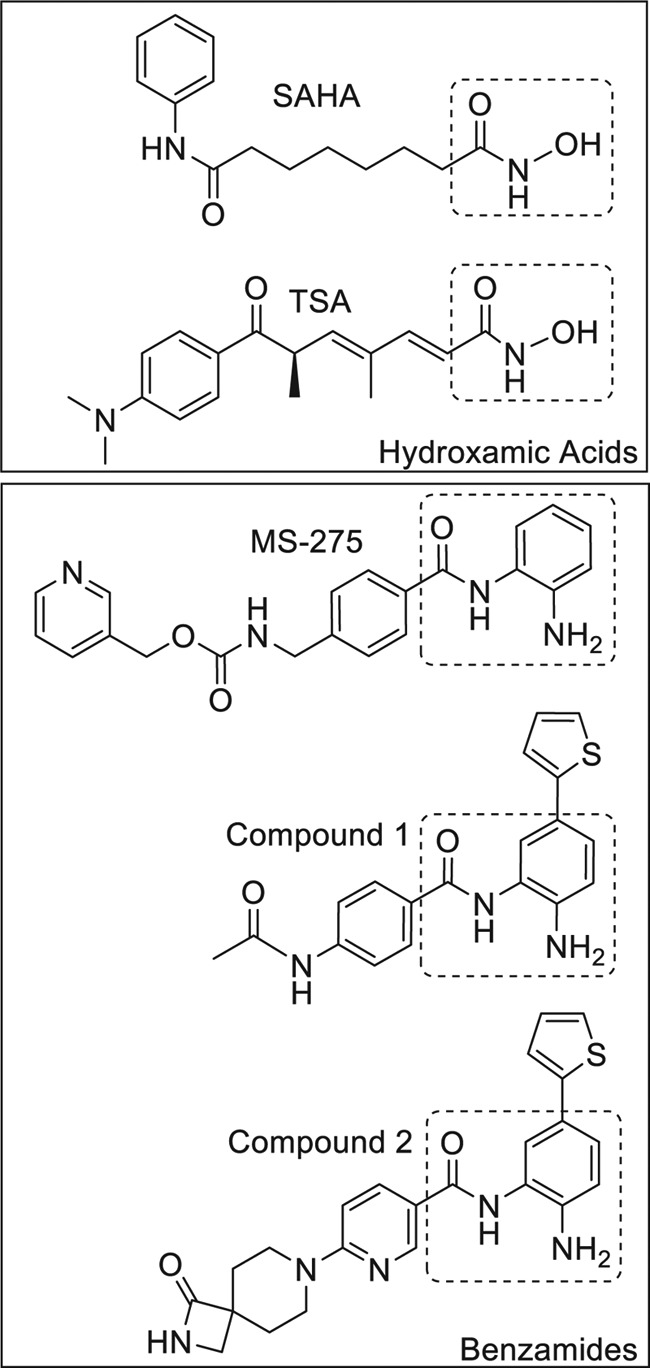
Chemical structures of hydroxamic acid and α-aminobenzamide (benzamide) HDAC inhibitors. The zinc-chelating motif is highlighted in the dotted box for each inhibitor. Compound 1 refers to 60 (28). Compound 2 refers to 33 (40).
TABLE 2.
Potency of hydroxamic acid and benzamide HDAC inhibitors against HDAC1–10
IC50 values were determined from enzymatic inhibition experiments using Caliper LabChip as detection (41).
| Inhibitor | Class | Class I IC50 |
Class IIa IC50 |
Class IIb IC50 |
|||||||
|---|---|---|---|---|---|---|---|---|---|---|---|
| HDAC1 | HDAC2 | HDAC3 | HDAC8 | HDAC4 | HDAC5 | HDAC7 | HDAC9 | HDAC6 | HDAC10 | ||
| μm | μm | μm | |||||||||
| MS-275 | Benzamide | 0.243 | 0.453 | 0.248 | >10 | >10 | >10 | >10 | >10 | >10 | >10 |
| Compound 1a | Benzamide | 0.0101 | 0.0563 | >10 | >10 | >10 | >10 | >10 | >10 | >10 | 3.4 |
| Compound 2b | Benzamide | 0.00793 | 0.0538 | >10 | >10 | >10 | >10 | >10 | >10 | >10 | 4.4 |
| TSA | Hydroxamate | 0.0049 | 0.0123 | 0.00141 | 0.213 | 2.4 | 0.871 | 0.663 | 3.7 | 0.000721 | 0.0116 |
| SAHA | Hydroxamate | 0.0607 | 0.251 | 0.0186 | 0.827 | >10 | >10 | >10 | >10 | 0.00944 | 0.0291 |
Benzamide HDACi Are Slow Tight-binding HDAC1/2 Inhibitors with Longer Target Residence Times than Hydroxamate HDACi
We used the Proteros reporter displacement binding assay as a mechanism to quantify the association and dissociation kinetic rate constants as well as Kd values for each inhibitor against HDAC1 and HDAC2. Despite the relative similarities in Kd values between benzamide and hydroxamate HDACi, the observed rate constants (association and dissociation) for the benzamide inhibitors were several orders of magnitude slower than those for hydroxamates (Table 3). The association and dissociation rates of SAHA proved faster than the detectable limits of the assay (<1.4 min residence time); conversely, the benzamides C1 and C2 exhibited sustained HDAC1/2 binding kinetics with residency times greater than 20 h. Among the benzamide inhibitors we tested, C1 and C2 possessed 3–13-fold longer residence times than MS-275, which was still markedly slower to dissociate from HDAC1 and -2 than the hydroxamate TSA. These correlations agree with the prevailing characterizations of the pan-inhibiting hydroxamates as possessing rapid binding kinetics and benzamides as HDAC inhibitors with slow binding kinetics, and this represents the first report to quantify the precise kinetic rate constants of these inhibitors. The extremely slow association and dissociation kinetic rate constants for the benzamide inhibitors imply that the experimental conditions used for enzymatic IC50 determination (15 min preincubation and 3 h reaction) may be insufficient to achieve an equilibrated state, and the resultant IC50 values might be underestimated. Similarly, the binding constants (Kd) determined with use of the Proteros reporter displacement binding assay for all compounds was determined after 4 h of incubation and therefore significantly correlated with inhibitory potencies determined using enzymatic experimentation (the greatest disparity seen was less than a 4-fold difference) (Table 3). Visual observation of the kinetic binding traces indicates that at this time the slowest binding benzamides have not completely reached equilibrium, but the determined Kd values are not expected to shift dramatically upon further incubation. These studies highlight a challenge with the accurate quantitation of extremely slow (and fast) binding events using these techniques but clearly illustrate the vast disparity in kinetics between hydroxamates and benzamides.
TABLE 3.
Binding affinity and kinetic rate constants of hydroxamic acid and benzamide inhibitors against HDAC1 and HDAC2
koff = Kd·kon. Residence time = 1/koff. NA = too fast to measure (1.4 min is shortest measurable residence time).
| Inhibitor | Enzyme | Kd | Association rate, kon | Dissociation rate, koff | Residence time |
|---|---|---|---|---|---|
| μm | 1/min/m | 1/min | min | ||
| MS-275 | HDAC1 | 0.282 | 2.66 × 10⁴ | 7.50 × 10⁻³ | 133 |
| HDAC2 | 0.156 | 8.63 × 10³ | 1.35 × 10⁻³ | 743 | |
| Compound 1 | HDAC1 | 0.0381 | 2.09 × 10⁴ | 7.94 × 10⁻⁴ | 1207 |
| HDAC2 | 0.0552 | 1.50 × 10⁴ | 8.28 × 10⁻⁴ | 1259 | |
| Compound 2 | HDAC1 | 0.0246 | 2.4 × 10⁴ | 5.91 × 10⁻⁴ | 1692 |
| HDAC2 | 0.0481 | 9.01 × 10³ | 4.33 × 10⁻⁴ | 2309 | |
| TSA | HDAC1 | 0.0121 | 2.77 × 10⁶ | 3.35 × 10⁻² | 30 |
| HDAC2 | 0.0153 | 3.64 × 10⁶ | 5.59 × 10⁻² | 18 | |
| SAHA | HDAC1 | 0.163 | NA | NA | <1.4 |
| HDAC2 | 0.182 | NA | NA | <1.4 |
Structural Analysis of Hydroxamate and Benzamide Binding to HDAC2
To further investigate the binding modes of SAHA and C1, we solved the crystal structures of both inhibitors bound to HDAC2 at 1.85 and 1.57 Å, respectively. The structures revealed an overall HDAC2 protein conformation similar to a previously solved HDAC2 structure, albeit at significantly higher resolution (Table 1 and Fig. 2) (17–19, 31, 33). Our structures show that both classes of compounds chelate zinc in a similar trigonal bipyramidal fashion, with virtually identical positioning of the Zn2+ interacting functional groups (Fig. 3, A and B). The structure of SAHA in complex with HDAC2 is the first structure of a hydroxamate class of inhibitor with this isoform and shows that the alkyl chain extends out of the lipophilic channel similar to the side chain of a lysine residue (Fig. 3A). The benzamide moiety wraps toward Phe-155, with the phenyl ring interacting with a hydrophobic face formed by Phe-155 and Pro-34, whereas the amide nitrogen forms a polar contact with Asp-104. The benzamide compound 1 has a significantly different binding mode, in which the thiophene group is inserted into the “foot pocket” (Fig. 3B) (20–23, 32, 33). Comparison with the SAHA structure shows that two of the side chain residues forming this pocket are repositioned to accommodate an aryl moiety. Leu-144 undergoes a rotamer flip and Met-35 is shifted ∼1 Å (Fig. 4), which significantly enlarges the foot pocket space. Notably, increased electron density for the 2- and 5-positions of the thiophene suggests that the ring can flip with the sulfur atom being accommodated in either orientation (Fig. 2).
FIGURE 2.

Stereo view of electron density around the HDAC2 active site contoured at 1.5σ for HDAC2-SAHA (A) and HDAC2-compound 1 (B).
FIGURE 3.

Structural analysis of hydroxamate versus benzamide binding to HDAC2. Cutaway views of the binding pocket for SAHA bound to HDAC2 (A) and compound 1 bound to HDAC2 (B). The binding pocket surface is shown in gray, with SAHA and compound 1 shown as pink or gold stick models, respectively. Zinc is shown as a turquoise sphere, and key HDAC2 pocket residues are shown as gray sticks. Leucine 144, which changes rotamers to open the foot pocket, is shown as orange sticks. The minimum energy conformation of compound 1 (generated using version 2012.10 of MOE; MMFF94s forcefield) (C) contains an intramolecular hydrogen bond between the aniline amine and the amide carbonyl, which is broken to form two ligand amines to protein hydrogen bonds to His-145 and His-146 in the crystal structure (D) in addition to zinc chelation. The crystal complex is further stabilized by a hydrogen bond from the internal ligand amide NH and Gly-154.
FIGURE 4.
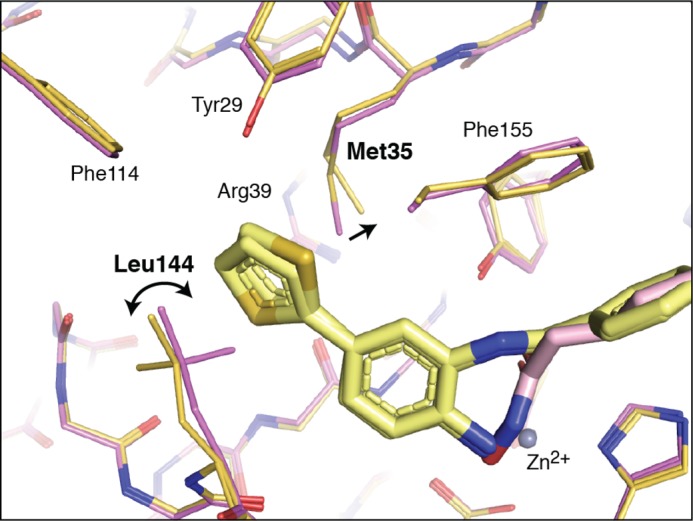
Close-up view of foot pocket side chain positions to illustrate the side chain movements associated with benzamide binding. SAHA is shown as a light pink stick model, and SAHA-bound HDAC2 residues are shown as thin pink sticks. Compound 1 is shown as a light yellow stick model, and compound 1-bound HDAC2 is shown as thin yellow-orange sticks. Zn2+ is shown as a gray sphere.
This protein rearrangement to form the foot pocket, coupled with the need to break an internal ligand hydrogen bond upon binding (discussed below), is consistent with the slow binding kinetics of benzamide inhibitors relative to hydroxamates. The binding trajectory of the hydroxamate ligands is straightforward. Because these inhibitors have the zinc-chelating warhead positioned at one end of the molecule, substantial protein rearrangement and internal ligand hydrogen bond disruption are not necessary for the observed binding complex to form. As the ligand approaches the protein, the hydroxamate binds catalytic zinc at the base of a hydrophobic tube, displacing a bound water in the process. Thus, hydroxamate-containing ligands generally exhibit fast binding kinetics. The benzamides face a more difficult path to the observed binding mode, with two plausible binding trajectories. The ligand could enter via an acetyl release and disposal channel (7, 24, 33, 42) or via the hydrophobic tube, settling into a rearranged foot pocket before forming the zinc complex, which locks the inhibitor in place. In either case, substantial rearrangement of the protein must occur. An internal hydrogen bond in the ligand between the Zn2+-chelating amine and carbonyl groups must be broken, to be replaced by ligand-protein hydrogen bonds and Zn2+ chelation (Fig. 3, C and D). This is consistent with previous reports postulating that an intramolecular hydrogen bond between the amine and carbonyl must be broken to permit successful zinc chelation, and a desolvation penalty is paid for this rearrangement to occur (1, 25–28, 34). These ligand and protein structural rearrangements are consistent with the slow but “tight fit” kinetics of these benzamide compounds that are not seen with the hydroxamates.
Kinetics of HDACi-induced Histone Acetylation in Cell Culture Correlates with Inhibitor Kinetic Binding Properties
We examined the impact of the differential kinetic rates of hydroxamates and benzamides for their capacity to modulate histone acetylation in SH-SY5Y neuroblastoma cells. Our immunoblot data confirm previous reports that both benzamide and hydroxamate HDACi strongly increase the level of histone acetylation in vitro at numerous sites (Fig. 5). Notably, the level of H2BK5 and H4K12 acetylation was strikingly increased in HDACi-treated cells relative to vehicle-treated controls (Fig. 5), and these two marks were subsequently used to evaluate the longitudinal effect stemming from benzamide or hydroxamate HDACi treatment. Specifically, SH-SY5Y cells were treated with HDACi for up to 96 h, and the acetylation level was monitored at the 0-, 6-, 18-, 24-, 48-, and 96-h time points. SAHA-treated cells show a rapid induction of hyperacetylation at both marks that essentially reached maximal levels by the first observed time point of 6 h (Fig. 6A). The immunoblot signal of both acetylated and total histone levels slightly diminished following the 6-h time point, and were barely detectable at 96 h. This is in line with an observed induction of cell toxicity (described further below) that was strong by 24 h and virtually complete by 96 h of treatment (Fig. 6). Moreover, this quick onset of acetylation was also observed using TSA (Fig. 6B). C1, however, results in a slower induction of hyperacetylation at both marks, reaching a maximum between 24 and 48 h that is reduced only by the 96-h time point, where a concomitant reduction of total histone is also observed in correspondence to a decrease in cell viability (Figs. 6D and 7). The correlation of this slow onset of observed hyperacetylation with slow kinetic association rates also held true for MS-275 and C2 and the other benzamides tested (Fig. 6, C and E). Interestingly, we also observed that the maximal level of histone acetylation seemed to be greater for the hydroxamate (6 h) compared with benzamide (24 and 48 h) treatments, in general. We speculate that the magnitude of acetylation is a reflection in the difference in inhibitor selectivities, because the hydroxamates inhibit a larger number of HDAC isoforms than the benzamides. Altogether, these results indicate that the kinetic association rates defined against the purified enzymes predict well the cellular kinetics of histone acetylation across inhibitor classes.
FIGURE 5.

Quantification of histone acetylation levels after SAHA or MS-275 treatments in SH-SY5Y neuroblastoma cells. Histone acetylation from lysates of SH-SY5Y neuroblastoma cells treated with either 10 μm of the hydroxamate SAHA, or 5 μm of the benzamide MS-275, or the vehicle control (DMSO) for 24 h were examined by Western blot. A, representative immunoblot images for histone 2B (left column), histone 3 (middle column), and histone 4 (right column) epitopes are shown in A. Total histone levels (top row) were probed as a loading control, followed by probes of global histone acetylation and then post-translational marks at specific histone residues. B, quantification of the increased intensity in these bands is relative to the DMSO control. Error bars represent S.E. of three independent experiments.
FIGURE 6.

Time course of histone acetylation level after constant or pulsed exposure of hydroxamates or benzamides. SH-SY5Y neuroblastoma cells were treated with either 10 μm SAHA (A and F), or 1 μm TSA (B and G), or 5 μm MS-275 (C and H), or 10 μm compound 1 (D and I), or 10 μm compound 2 (E and J) for up to 96 h. Either a constant exposure of HDACi (A–E) or a 6-h pulse, wash, and incubation in inhibitor-free media (F–J) was utilized. Total histone 2B or histone 4 and histone acetylation levels for H2BK5 and H4K14 from cell lysates were examined by Western blot. Black header lines for each section display the duration of inhibitor exposure.
FIGURE 7.
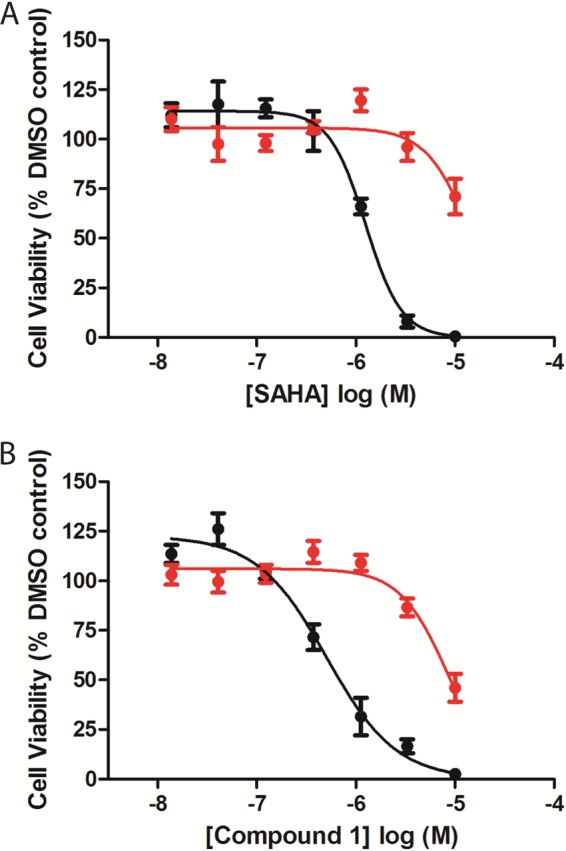
Effect of HDAC inhibitors on SHSY5Y cell viability after constant or pulsed exposure. SHSY5Y cells were treated with compound 1 (A) or SAHA (B) for 96 h of continuous exposure (black circles) or for a 6-h pulsed treatment followed by cellular wash and inhibitor-free media replacement (red circles) followed by detection of intracellular ATP levels as described under “Experimental Procedures.” Concentration-response curves were performed in duplicate and represent one of at least two experiments with similar results. Concentration-response curves for each inhibitor were normalized to zero and 100% based on maximal inhibitor concentration or DMSO, respectively. The means ± S.E. are reported.
To examine the effect of disparate kinetic rates between benzamides and hydroxamates on cellular histone acetylation levels, we utilized a pulsed treatment of inhibitor for 6 h followed by a cellular wash and HDACi-free media replacement and again monitored hyperacetylation at the 0-, 6-, 18-, 24-, 48-, and 96-h time points. In the case of the hydroxamate inhibitors, 6 h of incubation produced a robust increase in acetylation at both of the measured marks that returned to base line by the next time point (18 h) in drug-free media (Fig. 6, F and G). Conversely, the benzamide C1 induced an increase of histone acetylation, which peaked in a similar time frame as did constant exposure, but it exhibited a dramatic delay in histone deacetylation that was apparent only 96 h after the initial treatment, with acetylation levels not yet returning to base line even at this extended time point (Fig. 6I). Data generated with C2 mirrored this delay in deacetylation when administered similarly (Fig. 6J). A sustained hyperacetylation state was seen 96 h after MS-275 washout despite possessing dissociation kinetic rate profiles nearly twice as fast as C1 and C2 (Fig. 6H). Interestingly, no decrease in the total histone H2B and H4 levels were observed during the pulsed treatment experiment for any of the HDACi. In summary, the rapid kinetic rates for the hydroxamates and the slow binding properties of the benzamides correlate well with changes in histone acetylation after compound treatment as well as with histone deacetylation following HDACi washout.
Washout of HDACi Reduces Cellular Cytotoxicity, Irrespective of Kinetic Binding Properties
To evaluate the decrease of total histone levels seen under constant HDACi treatment, we measured the cell viability of SH-SY5Y cells treated with different concentrations of HDACi as quantified by determination of cellular ATP levels. Constant exposure of SAHA or C1 to these cells for 96 h led to cell cytotoxicity induction (Fig. 7, A and B, and Table 4). Although constant exposure of these compounds dramatically induced cell cytotoxicity, pulsatile treatment for 6 h followed by cellular wash and HDACi-free media replacement induced only a modest decrease in cell viability in all but the maximal inhibitor concentrations (10 μm) resulting in a decrease in cellular cytotoxicity at the 96-h time point (Fig. 7, A and B). A similar degree of loss of cytotoxicity between no-wash and washout conditions was seen with all compounds tested regardless of their kinetic binding properties (Table 4). This is in good agreement with our early qualitative visual observations that cells given these doses are less rounded and more adherent than cells receiving a constant dosage. Altogether these results show that cell viability is compromised in a dose-dependent manner for all compounds when tested in a continual manner, and accordingly reduced when inhibitor is only exposed to cells for 6 h.
TABLE 4.
Potency of HDAC inhibitors to induce SH-SY5Y cellular cytotoxicity
CellTiter-Glo experiments at 96 h. >10 μm means 50% reduction not observed by 10 μm.
| Inhibitor | Cell viability IC50 |
|
|---|---|---|
| Constant inhibitor exposure | 6-h pulse followed by wash | |
| μm | ||
| MS-275 | 1.328 | 8.086 |
| Compound 1 | 0.425 | 6.656 |
| Compound 2 | 0.691 | 9.988 |
| TSA | 0.598 | 4.175 |
| SAHA | 1.264 | >10 |
Transcriptional Up-regulation Is Governed by HDACi Kinetic Association Rate and Is Independent from Molecular Residence Times
Changes in gene expression profiles are believed to underlie the functional responses provoked by HDACi, from induced cell death to enhanced neuronal function provoked by HDACi, yet little is known about the evolution and reversibility of such changes and whether inhibitor kinetic properties differentially affect gene expression. The differential onset of histone acetylation for hydroxamates and benzamides prompted us to examine how these kinetic differences affect gene transcription. cDNAs from SH-SY5Y cells treated with either 10 μm SAHA, 10 μm C1, or DMSO control were hybridized to whole genome microarrays (see “Experimental Procedures”), allowing for gene expression analysis based on changes in hybridized probe intensity. Similar to studies described above, cells were treated with continual inhibitor exposure for 6 or 24 h followed by cDNA collection. Gene expression analysis indicated that a larger number of gene expression changes were identified at 24 h, representing 14.9% (SAHA) and 6.0% (C1) of the total number of genes analyzed (Fig. 8, A–D). This is in agreement with previous studies investigating the role of HDACi on gene expression changes in HL60 cells (2, 29, 30, 35, 43). Changes in gene expression compared after 6 or 24 h of SAHA treatment revealed that a large number of genes are responsive at 6 h (2139) and at 24 h (2822) with 1374 of these changes occurring at both time points (Fig. 8, A and B), which is consistent with the rapid and sustained onset of acetylation observed for this inhibitor. The slow onset of acetylation observed with C1 translated to a delayed onset of transcriptional events (Fig. 8, C and D). Only 277 genes were responsive after 6 h compared with 1135 genes after 24 h of treatment with this benzamide inhibitor. Interestingly, after 24 h of constant SAHA exposure, the number of up-regulated genes was similar to the number of down-regulated genes (1600 versus 1222 respectively, light gray circles in Fig. 8, E and F), whereas 24 h of exposure to C1 produced greater than 2-fold the number of up-regulated compared with down-regulated genes (811 versus 324, dark gray circles in Fig. 8, E and F). Analysis of the core set of genes commonly up-regulated and down-regulated by SAHA and C1 at the 6-h relative to the 24-h treatments (Fig. 8, A–D) demonstrated further that the modulation of gene expression following HDACi treatment is dependent on their onset binding properties. Although 24 h of SAHA exposure produced a greater degree of absolute transcriptional regulatory events, it is perhaps not surprising that 80.4% of the genes regulated by C1 are a subset of those regulated by SAHA administration, consistent with similar on-target activities of these two inhibitors. Moreover, the maximal extent in gene expression observed at 24 h after constant treatment of either HDACi, revealed that SAHA affects ∼2.5-fold more genes than C1 (2903 for SAHA versus 1153 for C1). It is our speculation that the additional HDAC isoforms inhibited by SAHA also play a role in the regulation of gene expression. Taken together, these results agree with a gene expression response to HDACi that follows the kinetic molecular association rates and histone acetylation and shows relative stability of expression patterns through a 24-h period when differing rates of onset are accounted for.
FIGURE 8.

Characterization of gene expression induced by constant treatments of SAHA or compound 1. Relative SH-SY5Y cell transcript levels from microarray analysis are plotted according to significance and fold change distributions relative to DMSO control following 6 h (A and C) or 24 h (B and D) of SAHA (A and B) or compound 1 (C and D) constant administration. Venn diagrams of the overlap of the up-regulated (E) or down-regulated (F) gene sets between SAHA (light gray circle) and compound 1 (dark gray circle) at 24 h of constant administration are shown.
The discordance between the rates of histone acetylation/deacetylation and cellular cytotoxicity after inhibitor removal prompted us to replicate these conditions and monitor gene expression profiles after a washout period. SH-SY5Y cells were treated with either 10 μm SAHA, 10 μm C1, or DMSO control for 6 h followed by cellular wash and HDACi-free media replacement, and cDNA was collected 18 h later (24 h from initial compound treatment) for microarray analysis. For the pulsed SAHA treatment conditions (Fig. 6E), the expressions of 747 genes were significantly altered relative to the DMSO control samples, which represents ∼25% of the total number of genes affected by SAHA (Fig. 9, A, C, and D, light gray circles). Interestingly, although constant exposure of SAHA to cells resulted in a similar number of up- and down-regulated gene transcripts, a pulsatile treatment with this inhibitor favored gene up-regulation nearly 5-fold compared with gene down-regulation (610 versus 137 genes, respectively). Pulsatile treatment of C1 resulted in 399 genes being modulated after 24 h. Moreover, pulsatile treatment produced a similar preference for gene up-regulation (336 versus 63), which was not anticipated based on the differential kinetic rates and degrees of histone acetylation for these compounds under these conditions (Fig. 9, B–D, dark gray circles). Furthermore, the genes altered by pulsed administration of C1 proved again to be primarily a subset of those regulated by SAHA (similar in this regard to that previously found under constant exposures), which might reflect their different HDAC selectivity profiles. We also examined the proportion of genes that were still regulated after 24 h by either pulsed or constant treatment of HDAC inhibitors. We observed that ∼26% of the total number of genes affected by SAHA were still modulated after pulsed SAHA treatment (Fig. 10, A and B). Moreover, when we examined the number of genes modulated by pulsed treatment of C1, we found that only ∼35% of them were still altered compared with constant treatment despite a maintained hyperacetylated state under both treatment conditions (Fig. 10, C and D). Finally, we investigated whether the genes regulated following pulsed administration of inhibitor are the same genes regulated during constant exposure of the same drug (Fig. 10). In the case of a pulsed administration of SAHA (Fig. 10, A and B, dark gray circles), 77.5% of both up- and down-regulated genes have their expression altered in the same direction as that seen when using a constant administration of the drug (459 up-regulated and 120 down-regulated) (Fig. 10, A and B, overlapping regions). Similarly for C1, 81.7% of up-regulated genes (270) and 55% of the down-regulated genes (56) were modified under both pulsatile (dark gray circles) and constant (light gray circles) treatment conditions (Fig. 10, C and D). These results indicate that the proportion of genes altered by pulsed treatment and shared by constant HDACi exposure are similar for SAHA and C1. Therefore, although the absolute number of genes affected by HDACi treatment is greater for SAHA compared with C1, both compounds show a striking similarity in their capacity to alter gene expression that is in agreement with their association kinetics but is discordant with their inhibitor dissociation kinetics (as well as with histone acetylation).
FIGURE 9.

Characterization of gene expression changes induced by pulsed treatment of SAHA or compound 1. SH-SY5Y cell transcripts from microarray analysis are plotted according to significance and fold change distributions relative to DMSO control following a 6-h pulse treatment administration of either SAHA (A) or C1 (B) and an additional 18 h of incubation in fresh media. Venn diagrams of the overlap of the up-regulated (C) or down-regulated (D) gene sets between SAHA (light gray circle) and compound 1 (dark gray circle) after pulsed treatment are shown.
FIGURE 10.

Comparison of changes in gene expression subjected to either a constant or pulsed treatment of SAHA or compound 1. Venn diagrams represent the up-regulated and down-regulated gene sets from SAHA (A and B) or compound 1-treated cells (C and D). Light gray circles represent the regulated gene sets during constant HDACi treatment, whereas dark gray circles display the remaining or new gene sets altered after pulsed administration.
Gene Ontology Analysis Suggests That Cell Cycle Gene Families Are Differentially Regulated by Constant and Pulsed HDACi Treatment
To gain insights into the molecular pathways modulated by SAHA and C1 after constant or pulsed treatment conditions, we subjected the four gene data sets to gene ontology classification. The first 20 biological categories significantly enriched after constant or pulsed treatments of either SAHA or C1 versus DMSO are shown in Table 5. Among this list, we specifically searched for terms that were significantly enriched by both inhibitors under constant exposure conditions but not under pulsed treatment conditions. Interestingly, one such term was regulation of cyclin-dependent kinase activity. Some of the genes annotated with this term have been previously shown to be induced following HDACi treatment (3, 4, 31, 36, 44–46). Therefore, we examined the relative expression of genes annotated with this term that were up-regulated after a 24-h treatment with SAHA and C1 (Fig. 11). The resulting dendrogram indicates stark differences between the constant and pulsed treatment of SAHA (Fig. 11, light blue versus dark blue columns) or C1 (light yellow versus dark yellow block columns). Indeed, the majority of genes whose expression was up-regulated following constant treatment with SAHA or C1 did not show the same level of induction after pulsed treatment (Fig. 11). These results suggest first that the regulation of cyclin-dependent kinase genes depend on the duration of inhibitor exposure regardless of HDACi chemical class, and second, they suggest that extensive up-regulation of their expression may translate to the induction of cell death.
TABLE 5.
Gene ontology of HDACi-responsive gene sets
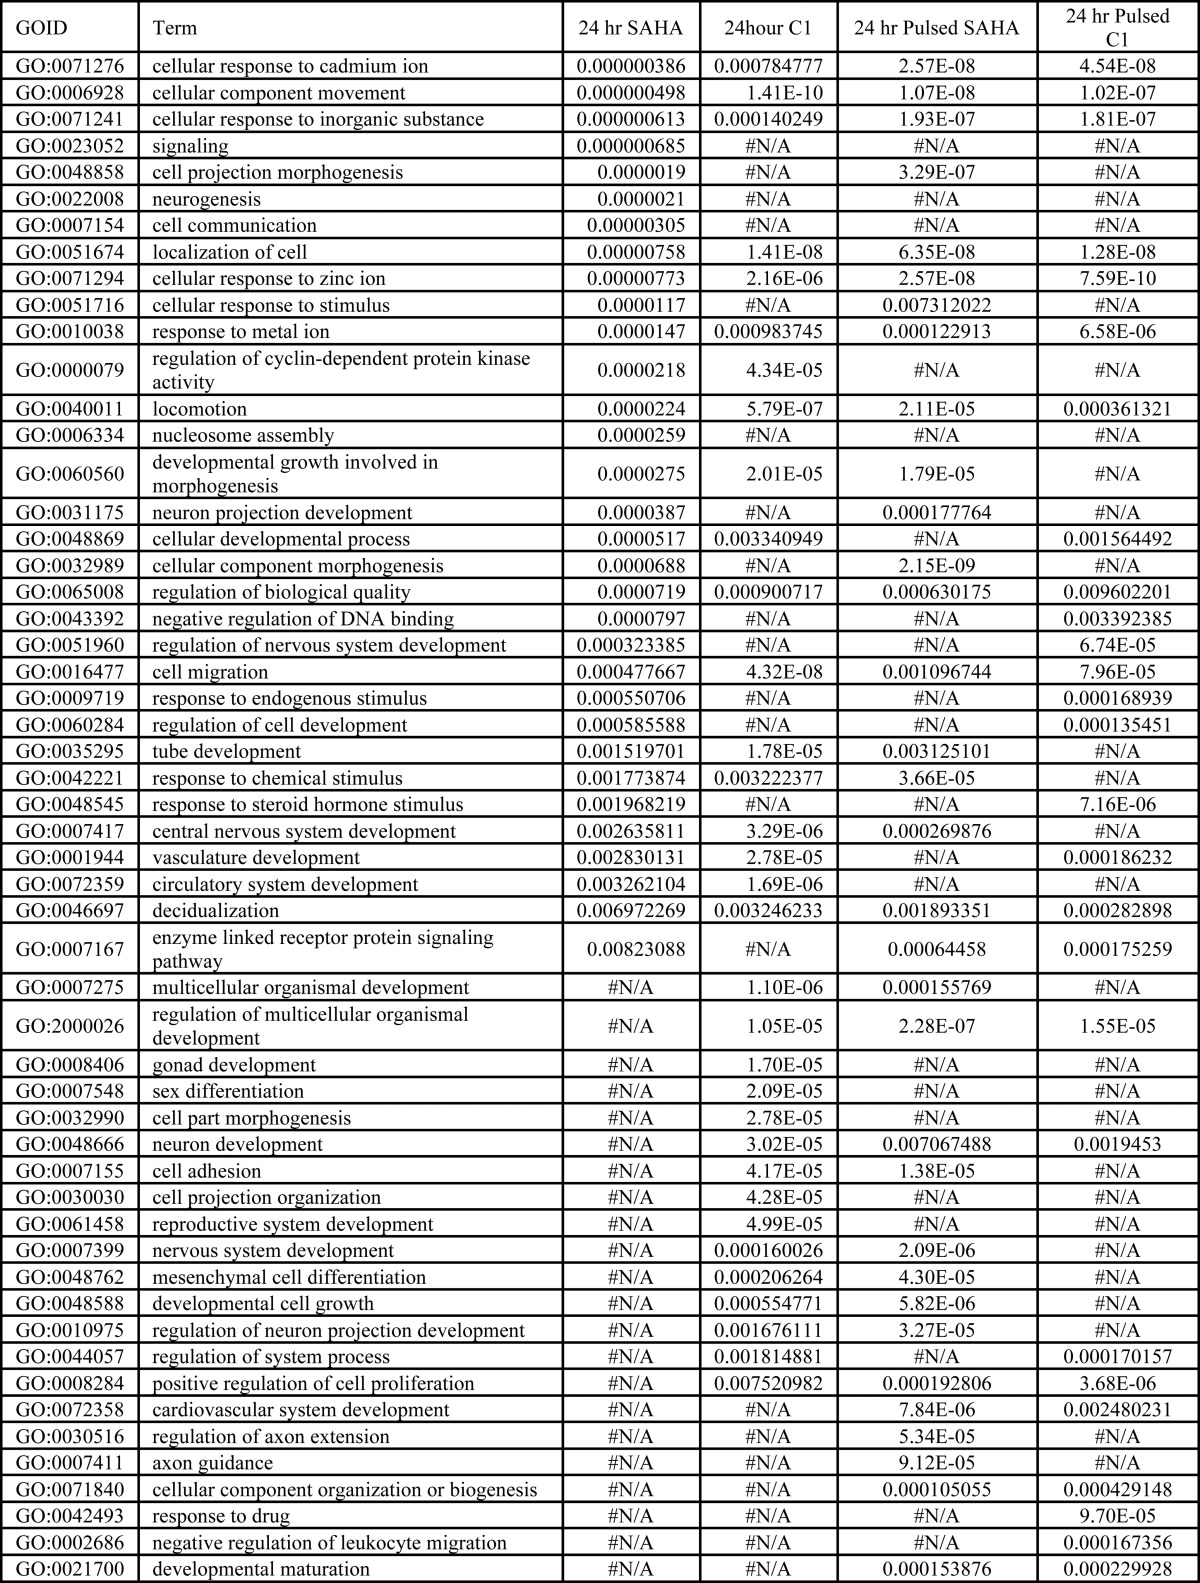
FIGURE 11.

Constant and pulsed treatments with SAHA or compound 1 differentially regulate the cyclin-dependent kinase activity genes. A heat map of the genes of the Gene Ontology category significantly up-regulated following SAHA or compound 1 treatment was generated by hierarchical clustering. Replicate samples co-cluster as indicated by the arrangement of the sample color code.
DISCUSSION
In this study, we compared the kinetic binding properties between hydroxamate and benzamide inhibitors and investigated how they affect biological functions in the neuroblastoma cell line SH-SY5Y by examining histone acetylation, cell viability, and gene expression. We confirmed that the hydroxamate inhibitors SAHA and TSA broadly inhibit HDAC isoforms with potency in the submicromolar range, whereas the benzamide inhibitors confer greater HDAC isoform selectivity against only the class I HDACs. MS-275 has submicromolar potency against HDAC1–3, although two other previously described benzamide inhibitors (compound 1 and 2) more potently inhibit only HDAC1 and HDAC2 and do not interfere with the activity of other HDAC isoforms in vitro. The binding affinity of all compounds determined in an orthogonal competitive displacement binding assay were significantly correlated with the inhibitory potencies from the enzymatic assays. Similarity in potency between compound 1, compound 2, and SAHA against HDAC1 and HDAC2 permitted a comparative analysis of the type of zinc chelation moiety used to convey HDAC inhibition, with specific focus on their kinetic binding properties. We employed the Proteros reporter displacement binding assay to quantify the kinetic association and dissociation rates and residence times for each inhibitor against recombinant HDAC1 and HDAC2. The benzamide class of inhibitors consistently displayed slow-on/slow-off binding properties, whereas the hydroxamates exhibited rapid kinetic binding rates. We observed a several orders of magnitude differential in the kinetic rate constants of benzamides compared with hydroxamates, as well as a limitation of this assay platform to quantify extremely rapid kinetic rates in the case of SAHA. Despite chelating zinc in a similar manner to hydroxamic acids, a likely rationale for the slow binding kinetics found with benzamide inhibitors comes from the required disruption of an intramolecular hydrogen bond combined with a protein rearrangement necessary to accommodate the lipophilic biaryl portion of the inhibitor on binding. The binding trajectory either involves traversal of the hydrophobic portion of the ligand past the polar zinc environment or entry through an acetyl release and disposal channel, which contributes to the slow binding kinetics of the benzamides.
Lysine 5 of histone 2B (H2BK5) and lysine 12 of histone 4 (H4K12) were two marks found in SH-SY5Y cells to exhibit robust increases in acetylation subsequent to HDACi treatment, with SAHA conveying the highest change in histone acetylation compared with MS-275, which is perhaps explained by the difference in potency or selectivity between these two classes of compounds. Increases of histone acetylation at these marks follow the intrinsic inhibitor kinetic properties; hydroxamates provoked a rapid increase of H2BK5 and H4K12 acetylation, whereas benzamides increased histone acetylation more slowly. On cellular washout of these inhibitors, acetylation rapidly decreased to basal levels with the hydroxamates, whereas that for the benzamides was unaffected by compound removal, similar to constant drug exposure. These findings suggest that at the cellular level, the kinetics of acetylation follow the kinetic association and dissociation rate profiles of HDAC inhibitors determined biochemically.
It has previously been shown that HDAC inhibitors such as SAHA and MS-275 promote cell cycle arrest and apoptosis, linking HDACi to their anti-proliferative and anti-tumor activity (5, 11, 33, 37, 45, 47) and to their cellular toxicity (6–10, 24, 26, 38, 39). The dramatic decrease in the levels of histone H2B and H4 after 96 h of constant drug exposure in the acetylation studies suggests that cell viability is compromised. Indeed, our results show that constant treatment for 96 h with either hydroxamate or benzamide-containing inhibitors leads to a dramatic induction of cytotoxicity as monitored via detection of cellular ATP. As expected, transient treatment of cells with hydroxamates followed by inhibitor removal reduces the induction of cytotoxicity to near undetectable levels, in line with their acetylation profile and rapid dissociation kinetic profiles. However, it was somewhat surprising to observe that after washout, induction of cytotoxicity from benzamide inhibitors was similarly reduced, despite the maintenance of hyperacetylation up to 48 h. We observed this difference for all inhibitors tested and are the first to report discordance between histone acetylation and cell cytotoxicity. It is likely that pulsed inhibitor treatments limit the activation or repression of specific genes, which may depend exclusively on the onset kinetics of HDACi. Therefore, we speculate that in the case of HDACi with fast dissociation kinetic rates such hydroxamates, drug removal rapidly allows HDACs to return the expression of genes involved in the control of cell cycle and/or cell death to a repressed state, whereas in the case of the benzamides, the duration of the pulse may limit the up-regulation of these genes in the first place, consistent with their slow binding kinetics.
Despite the differences in the modulation of gene expression between the two classes of HDACi, we also observed a loss of ∼70% gene regulation regardless of the inhibitor used when we compared gene expression profiles of constant and pulsed treatments. This global effect was rather unexpected considering the difference in histone acetylation kinetics after hydroxamate or benzamide treatments, and it implicates a new appreciation for the disconnect between histone acetylation and gene expression when using HDACi. In addition, because we observed a dramatic effect of HDACi on cell viability that seems to depend more on the exposure conditions than inhibitor selectivity, we asked whether the expression of genes involved in the regulation of the cell cycle would be affected by HDACi according to the treatment regimen and not based on their selectivity profile. Previous studies showed that enhanced histone acetylation induced by HDACi allowed the overexpression of genes involved in cell cycle arrest such as cyclin-dependent kinase inhibitors or the growth arrest and DNA damage-inducible protein GADD45 gene family (11, 28, 40, 45–49). Our Gene Ontology analysis revealed that the cyclin-dependent kinase activity pathway was up-regulated by a 24-h constant exposure to SAHA and C1. However, we observed a marked drop in the expression of almost every gene in the pathway when employing a 6-h pulse treatment. Among activated genes that subside with pulsed HDACi administration are genes known to be powerful effectors of cell cycle arrest in multiple cell types and may promote apoptosis (11, 50). It is possible that prolonged derepression of such genes during constant inhibitor treatment mediates cell cytotoxicity, whereas a 6-h pulse treatment is insufficient to induce an appropriate oncogenic shock capable of initiating cell death. The rapidly reversible expression levels of these genes suggest that an expression threshold must be maintained for greater than 24 h to direct cells toward an apoptotic pathway. This is in agreement with the greatest induction of cell cytotoxicity seen with constant inhibitor treatment for 96 h, or roughly two cell division cycles in this case. As stated previously, most functional gene classes showed an ability to linger in the regulated state past inhibitor removal and as such separate themselves from inhibitor dissociation kinetic rates.
Qualitatively, we also observed that the changes in histone acetylation level induced by SAHA or TSA seemed to be more pronounced compared with C1 or C2 (Fig. 4). Similarly, gene expression analysis revealed that the total number of genes regulated by SAHA is ∼2.5-fold higher than for C1 after a constant 24-h treatment (Fig. 6). This difference may reflect that the hydroxamates possess a broader HDAC isoform inhibition profile. For example, it has recently been shown that HDAC3 can affect the acetylation of H2B and H4 in vitro (51). Moreover, HDAC3 has been suggested to be involved in carcinogenesis by affecting cell differentiation and apoptosis (52). Therefore, we cannot exclude the possibility that some of the differences we observed between hydroxamate and benzamide are not only due to their different kinetic properties but due to their different HDAC isoform selectivity profile.
Apart from modulating histone acetylation, HDACs are also known to deacetylate non-histone proteins, including signaling molecules, structural proteins, chaperon proteins, DNA repair enzymes, transcription factors, and transcription regulators (53, 54). Interestingly, the level of acetylation of tumor suppressors such as p53, c-Myc, and RUNX3, which is controlled by histone acetyltransferase/HDAC, regulates their function and/or their stability and thus affects their role in cell proliferation, differentiation, and cell death. Therefore, we cannot rule out that non-histone substrates of HDACi and expression-independent events may also underlie this difference in cytotoxicity. Moreover, recent studies have shown that other post-translational modifications such histone methylation, ubiquitination, and phosphorylation are regulated in concert (55–57). We also observed that the methylation of H3K9 was decreased after 24 h of SAHA or MS-275 treatment (Fig. 5), suggesting that the inhibition of HDAC affects the molecular mechanism involved in histone methylation as well. It is thus possible that the difference in gene expression and cytotoxicity that we observe between 6 and 24 h is also due to post-translational histone modification other than acetylation.
The translation between slow inhibitor binding kinetics and sustained pharmacodynamic modulation has been studied for a number of target classes (58). Interpretation of this relationship for the HDAC family is confounded by the downstream epigenetic role of these enzymes to modulate transcriptional activity and by the variety of their non-histone substrates. We have shown discordance between the mechanistic readout of histone acetylation and induction of cell cytotoxicity. We have furthermore demonstrated that global transcriptional modification subsequent to HDAC inhibition more closely correlates with cytotoxicity than with histone acetylation, and we provided evidence that certain gene families might be responsible for alteration of the cell cycle leading to cell death. Our study suggests that the evaluation of HDACi potency in vitro using recombinant proteins and of their pharmacodynamic properties as measured with histone acetylation are insufficient to predict their functional consequences on biological activity such as gene expression and cell viability, and therefore might be misleading in identifying useful HDACi. Although increasing the selective properties of HDACi might be important to prevent the inhibition of inappropriate HDAC isoforms, we propose that a more detailed understanding of how the kinetic properties of inhibition affect cell function will be additionally crucial to select HDACi with suitable pharmacological and biological properties.
Acknowledgments
We thank Yvonne Franke and Krista Bowman at Genentech for cloning and expression of HDACs. Portions of this research were carried out at the Stanford Synchrotron Radiation Lightsource, a Directorate of SLAC National Accelerator Laboratory and an Office of Science User Facility operated for the United States Department of Energy, Office of Science, by Stanford University. The SSRL Structural Molecular Biology Program is supported by the Department of Energy, Office of Biological and Environmental Research, and by National Institutes of Health Grant P41GM103393 from NIGMS and Grant P41RR001209 from the NCRR. Use of the Advanced Photon Source, an Office of Science User Facility operated for the United States Department of Energy Office of Science by Argonne National Laboratory, was supported by the United States Department of Energy under Contract DE-AC02-06CH11357.
The atomic coordinates and structure factors (codes 4LXZ and 4LY1) have been deposited in the Protein Data Bank (http://wwpdb.org/).
- HDAC
- histone deacetylase
- HDACi
- HDAC inhibitor
- SAHA
- vorinostat
- TSA
- trichostatin-A
- TCEP
- tris(2-carboxyethyl)phosphine
- CHES
- 2-(cyclohexylamino)ethanesulfonic acid.
REFERENCES
- 1. Shahbazian M. D., Grunstein M. (2007) Functions of site-specific histone acetylation and deacetylation. Annu. Rev. Biochem. 76, 75–100 [DOI] [PubMed] [Google Scholar]
- 2. Kouzarides T. (2007) Chromatin modifications and their function. Cell 128, 693–705 [DOI] [PubMed] [Google Scholar]
- 3. Grunstein M. (1997) Histone acetylation in chromatin structure and transcription. Nature 389, 349–352 [DOI] [PubMed] [Google Scholar]
- 4. Kuo M. H., Allis C. D. (1998) Roles of histone acetyltransferases and deacetylases in gene regulation. BioEssays 20, 615–626 [DOI] [PubMed] [Google Scholar]
- 5. Allis C. D., Berger S. L., Cote J., Dent S., Jenuwien T., Kouzarides T., Pillus L., Reinberg D., Shi Y., Shiekhattar R., Shilatifard A., Workman J., Zhang Y. (2007) New nomenclature for chromatin-modifying enzymes. Cell 131, 633–636 [DOI] [PubMed] [Google Scholar]
- 6. Shakespear M. R., Halili M. A., Irvine K. M., Fairlie D. P., Sweet M. J. (2011) Histone deacetylases as regulators of inflammation and immunity. Trends Immunol. 32, 335–343 [DOI] [PubMed] [Google Scholar]
- 7. Arrowsmith C. H., Bountra C., Fish P. V., Lee K., Schapira M. (2012) Epigenetic protein families: a new frontier for drug discovery. Nat. Rev. Drug Discov. 11, 384–400 [DOI] [PubMed] [Google Scholar]
- 8. McKinsey T. A. (2012) Therapeutic potential for HDAC inhibitors in the heart. Annu. Rev. Pharmacol. Toxicol. 52, 303–319 [DOI] [PubMed] [Google Scholar]
- 9. Gräff J., Kim D., Dobbin M. M., Tsai L. H. (2011) Epigenetic regulation of gene expression in physiological and pathological brain processes. Physiol. Rev. 91, 603–649 [DOI] [PubMed] [Google Scholar]
- 10. Wiech N. L., Fisher J. F., Helquist P., Wiest O. (2009) Inhibition of histone deacetylases: A pharmacological approach to the treatment of non-cancer disorders. Curr. Top. Med. Chem. 9, 257–271 [DOI] [PubMed] [Google Scholar]
- 11. Baylin S. B., Jones P. A. (2011) A decade of exploring the cancer epigenome—biological and translational implications. Nat. Rev. Cancer 11, 726–734 [DOI] [PMC free article] [PubMed] [Google Scholar]
- 12. Erickson P., Gao J., Chang K. S., Look T., Whisenant E., Raimondi S., Lasher R., Trujillo J., Rowley J., Drabkin H. (1992) Identification of breakpoints in t(8;21) acute myelogenous leukemia and isolation of a fusion transcript, AML1/ETO, with similarity to Drosophila segmentation gene, runt. Blood 80, 1825–1831 [PubMed] [Google Scholar]
- 13. Hug B. A., Lazar M. A. (2004) ETO interacting proteins. Oncogene 23, 4270–4274 [DOI] [PubMed] [Google Scholar]
- 14. Khan O., La Thangue N. B. (2012) HDAC inhibitors in cancer biology: emerging mechanisms and clinical applications. Immunol. Cell Biol. 90, 85–94 [DOI] [PubMed] [Google Scholar]
- 15. Guidotti A., Auta J., Chen Y., Davis J. M., Dong E., Gavin D. P., Grayson D. R., Matrisciano F., Pinna G., Satta R., Sharma R. P., Tremolizzo L., Tueting P. (2011) Epigenetic GABAergic targets in schizophrenia and bipolar disorder. Neuropharmacology 60, 10–10 [DOI] [PMC free article] [PubMed] [Google Scholar]
- 16. Chuang D.-M., Leng Y., Marinova Z., Kim H. J., Chiu C.-T. (2009) Multiple roles of HDAC inhibition in neurodegenerative conditions. Trends Neurosci. 32, 591–601 [DOI] [PMC free article] [PubMed] [Google Scholar]
- 17. Gräff J., Rei D., Guan J.-S., Wang W.-Y., Seo J., Hennig K. M., Nieland T. J., Fass D. M., Kao P. F., Kahn M., Su S. C., Samiei A., Joseph N., Haggarty S. J., Delalle I., Tsai L.-H. (2012) An epigenetic blockade of cognitive functions in the neurodegenerating brain. Nature 483, 222–226 [DOI] [PMC free article] [PubMed] [Google Scholar]
- 18. Janssen C., Schmalbach S., Boeselt S., Sarlette A., Dengler R., Petri S. (2010) Differential histone deacetylase mRNA expression patterns in amyotrophic lateral sclerosis. J. Neuropathol. Exp. Neurol. 69, 573–581 [DOI] [PubMed] [Google Scholar]
- 19. Covington H. E., 3rd, Maze I., Sun H., Bomze H. M., DeMaio K. D., Wu E. Y., Dietz D. M., Lobo M. K., Ghose S., Mouzon E., Neve R. L., Tamminga C. A., Nestler E. J. (2011) A role for repressive histone methylation in cocaine-induced vulnerability to stress. Neuron 71, 656–670 [DOI] [PMC free article] [PubMed] [Google Scholar]
- 20. Ryu H., Smith K., Camelo S. I., Carreras I., Lee J., Iglesias A. H., Dangond F., Cormier K. A., Cudkowicz M. E., Brown R. H., Jr., Ferrante R. J. (2005) Sodium phenylbutyrate prolongs survival and regulates expression of anti-apoptotic genes in transgenic amyotrophic lateral sclerosis mice. J. Neurochem. 93, 1087–1098 [DOI] [PubMed] [Google Scholar]
- 21. Govindarajan N., Agis-Balboa R. C., Walter J., Sananbenesi F., Fischer A. (2011) Sodium butyrate improves memory function in an Alzheimer's disease mouse model when administered at an advanced stage of disease progression. J. Alzheimers Dis. 26, 187–197 [DOI] [PubMed] [Google Scholar]
- 22. Ricobaraza A., Cuadrado-Tejedor M., Pérez-Mediavilla A., Frechilla D., Del Río J., García-Osta A. (2009) Phenylbutyrate ameliorates cognitive deficit and reduces tau pathology in an Alzheimer's disease mouse model. Neuropsychopharmacology 34, 1721–1732 [DOI] [PubMed] [Google Scholar]
- 23. Ricobaraza A., Cuadrado-Tejedor M., Marco S., Pérez-Otaño I., García-Osta A. (2012) Phenylbutyrate rescues dendritic spine loss associated with memory deficits in a mouse model of Alzheimer disease. Hippocampus 22, 1040–1050 [DOI] [PubMed] [Google Scholar]
- 24. Subramanian S., Bates S. E., Wright J. J., Espinoza-Delgado I., Piekarz R. L. (2010) Clinical toxicities of histone deacetylase inhibitors. Pharmaceuticals 3, 2751–2767 [DOI] [PMC free article] [PubMed] [Google Scholar]
- 25. Bertrand P. (2010) Inside HDAC with HDAC inhibitors. Eur. J. Med. Chem. 45, 2095–2116 [DOI] [PubMed] [Google Scholar]
- 26. Bradner J. E., West N., Grachan M. L., Greenberg E. F., Haggarty S. J., Warnow T., Mazitschek R. (2010) Chemical phylogenetics of histone deacetylases. Nat. Chem. Biol. 6, 238–243 [DOI] [PMC free article] [PubMed] [Google Scholar]
- 27. Chavan A. V., Somani R. R. (2010) HDAC inhibitors–new generation of target-specific treatment. Mini Rev. Med. Chem. 10, 1263–1276 [DOI] [PubMed] [Google Scholar]
- 28. Methot J. L., Chakravarty P. K., Chenard M., Close J., Cruz J. C., Dahlberg W. K., Fleming J., Hamblett C. L., Hamill J. E., Harrington P., Harsch A., Heidebrecht R., Hughes B., Jung J., Kenific C. M., Kral A. M., Meinke P. T., Middleton R. E., Ozerova N., Sloman D. L., Stanton M. G., Szewczak A. A., Tyagarajan S., Witter D. J., Secrist J. P., Miller T. A. (2008) Exploration of the internal cavity of histone deacetylase (HDAC) with selective HDAC1/HDAC2 inhibitors (SHI-1:2). Bioorg. Med. Chem. Lett. 18, 973–978 [DOI] [PubMed] [Google Scholar]
- 29. Neumann L., Ritscher A., Müller G., Hafenbradl D. (2009) Fragment-based lead generation: identification of seed fragments by a highly efficient fragment screening technology. J. Comput. Aided Mol. Des. 23, 501–511 [DOI] [PubMed] [Google Scholar]
- 30. Neumann L., von König K., Ullmann D. (2011) HTS reporter displacement assay for fragment screening and fragment evolution toward leads with optimized binding kinetics, binding selectivity, and thermodynamic signature. Methods Enzymol. 493, 299–320 [DOI] [PubMed] [Google Scholar]
- 31. Otwinowski Z., Minor W. (1997) Processing of x-ray diffraction data collected in oscillation mode. Methods Enzymol. 276, 307–326 [DOI] [PubMed] [Google Scholar]
- 32. McCoy A. J., Grosse-Kunstleve R. W., Adams P. D., Winn M. D., Storoni L. C., Read R. J. (2007) Phaser crystallographic software. J. Appl. Crystallogr. 40, 658–674 [DOI] [PMC free article] [PubMed] [Google Scholar]
- 33. Bressi J. C., Jennings A. J., Skene R., Wu Y., Melkus R., De Jong R., O'Connell S., Grimshaw C. E., Navre M., Gangloff A. R. (2010) Exploration of the HDAC2 foot pocket: Synthesis and SAR of substituted N-(2-aminophenyl)benzamides. Bioorg. Med. Chem. Lett. 20, 3142–3145 [DOI] [PubMed] [Google Scholar]
- 34. Adams P. D., Afonine P. V., Bunkóczi G., Chen V. B., Davis I. W., Echols N., Headd J. J., Hung L.-W., Kapral G. J., Grosse-Kunstleve R. W., McCoy A. J., Moriarty N. W., Oeffner R., Read R. J., Richardson D. C., Richardson J. S., Terwilliger T. C., Zwart P. H. (2010) PHENIX: a comprehensive Python-based system for macromolecular structure solution. Acta Crystallogr. D Biol. Crystallogr. 66, 213–221 [DOI] [PMC free article] [PubMed] [Google Scholar]
- 35. Emsley P., Cowtan K. (2004) Coot: model-building tools for molecular graphics. Acta Crystallogr. D Biol. Crystallogr. 60, 2126–2132 [DOI] [PubMed] [Google Scholar]
- 36. Smart O. S., Womack T. O., Flensburg C., Keller P., Paciorek W., Sharff A., Vonrhein C., Bricogne G. (2012) Exploiting structure similarity in refinement: automated NCS and target-structure restraints in BUSTER. Acta Crystallogr. D Biol. Crystallogr. 68, 368–380 [DOI] [PMC free article] [PubMed] [Google Scholar]
- 37. Chen V. B., Arendall W. B., 3rd, Headd J. J., Keedy D. A., Immormino R. M., Kapral G. J., Murray L. W., Richardson J. S., Richardson D. C. (2010) MolProbity: all-atom structure validation for macromolecular crystallography. Acta Crystallogr. D Biol. Crystallogr. 66, 12–21 [DOI] [PMC free article] [PubMed] [Google Scholar]
- 38. Khan N., Jeffers M., Kumar S., Hackett C., Boldog F., Khramtsov N., Qian X., Mills E., Berghs S. C., Carey N., Finn P. W., Collins L. S., Tumber A., Ritchie J. W., Jensen P. B., Lichenstein H. S., Sehested M. (2008) Determination of the class and isoform selectivity of small-molecule histone deacetylase inhibitors. Biochem. J. 409, 581–589 [DOI] [PubMed] [Google Scholar]
- 39. Chou C. J., Herman D., Gottesfeld J. M. (2008) Pimelic diphenylamide 106 is a slow, tight-binding inhibitor of class I histone deacetylases. J. Biol. Chem. 283, 35402–35409 [DOI] [PMC free article] [PubMed] [Google Scholar]
- 40. Kattar S. D., Surdi L. M., Zabierek A., Methot J. L., Middleton R. E., Hughes B., Szewczak A. A., Dahlberg W. K., Kral A. M., Ozerova N., Fleming J. C., Wang H., Secrist P., Harsch A., Hamill J. E., Cruz J. C., Kenific C. M., Chenard M., Miller T. A., Berk S. C., Tempest P. (2009) Parallel medicinal chemistry approaches to selective HDAC1/HDAC2 inhibitor (SHI-1:2) optimization. Bioorg. Med. Chem. Lett. 19, 1168–1172 [DOI] [PubMed] [Google Scholar]
- 41. Hanson J., Hank L., Plise E., Chen Y.-H., Ding X., Hanania T., Sabath E. V., Alexandrov V., Brunner D., Leahy E., Steiner P., Liu L., Scearce-Levie K., Zhou Q. (2013) SAHA enhances synaptic function and plasticity in vitro but lack of brain availability in vivo prevents impacts on cognition. PLoS ONE, in press [DOI] [PMC free article] [PubMed] [Google Scholar]
- 42. Whitehead L., Dobler M. R., Radetich B., Zhu Y., Atadja P. W., Claiborne T., Grob J. E., McRiner A., Pancost M. R., Patnaik A., Shao W., Shultz M., Tichkule R., Tommasi R. A., Vash B., Wang P., Stams T. (2011) Human HDAC isoform selectivity achieved via exploitation of the acetate release channel with structurally unique small molecule inhibitors. Bioorg. Med. Chem. 19, 4626–4634 [DOI] [PubMed] [Google Scholar]
- 43. Halsall J., Gupta V., O'Neill L. P., Turner B. M., Nightingale K. P. (2012) Genes are often sheltered from the global histone hyperacetylation induced by HDAC inhibitors. PLoS ONE 7, e33453. [DOI] [PMC free article] [PubMed] [Google Scholar]
- 44. Marks P., Rifkind R. A., Richon V. M., Breslow R., Miller T., Kelly W. K. (2001) Histone deacetylases and cancer: causes and therapies. Nat. Rev. Cancer 1, 194–202 [DOI] [PubMed] [Google Scholar]
- 45. Richon V. M., Sandhoff T. W., Rifkind R. A., Marks P. A. (2000) Histone deacetylase inhibitor selectively induces p21WAF1 expression and gene-associated histone acetylation. Proc. Natl. Acad. Sci. U.S.A. 97, 10014–10019 [DOI] [PMC free article] [PubMed] [Google Scholar]
- 46. Chen Z., Clark S., Birkeland M., Sung C. M., Lago A., Liu R., Kirkpatrick R., Johanson K., Winkler J. D., Hu E. (2002) Induction and superinduction of growth arrest and DNA damage gene 45 (GADD45) α and β messenger RNAs by histone deacetylase inhibitors trichostatin A (TSA) and butyrate in SW620 human colon carcinoma cells. Cancer Lett. 188, 127–140 [DOI] [PubMed] [Google Scholar]
- 47. Rosato R. R., Almenara J. A., Grant S. (2003) The histone deacetylase inhibitor MS-275 promotes differentiation or apoptosis in human leukemia cells through a process regulated by generation of reactive oxygen species and induction of p21CIP1/WAF1 1. Cancer Res. 63, 3637–3645 [PubMed] [Google Scholar]
- 48. Carew J. S., Giles F. J., Nawrocki S. T. (2008) Histone deacetylase inhibitors: mechanisms of cell death and promise in combination cancer therapy. Cancer Lett. 269, 7–17 [DOI] [PubMed] [Google Scholar]
- 49. Scuto A., Kirschbaum M., Kowolik C., Kretzner L., Juhasz A., Atadja P., Pullarkat V., Bhatia R., Forman S., Yen Y., Jove R. (2008) The novel histone deacetylase inhibitor, LBH589, induces expression of DNA damage response genes and apoptosis in Ph− acute lymphoblastic leukemia cells. Blood 111, 5093–5100 [DOI] [PMC free article] [PubMed] [Google Scholar]
- 50. Bolden J. E., Peart M. J., Johnstone R. W. (2006) Anticancer activities of histone deacetylase inhibitors. Nat. Rev. Drug Discov. 5, 769–784 [DOI] [PubMed] [Google Scholar]
- 51. Johnson C. A. (2002) Human class I histone deacetylase complexes show enhanced catalytic activity in the presence of ATP and co-immunoprecipitate with the ATP-dependent chaperone protein Hsp70. J. Biol. Chem. 277, 9590–9597 [DOI] [PubMed] [Google Scholar]
- 52. Wilson A. J. (2006) Histone deacetylase 3 (HDAC3) and other class I HDACs regulate colon cell maturation and p21 expression and are deregulated in human colon cancer. J. Biol. Chem. 281, 13548–13558 [DOI] [PubMed] [Google Scholar]
- 53. Kim H.-J., Bae S. C. (2011) Histone deacetylase inhibitors: molecular mechanisms of action and clinical trials as anti-cancer drugs. Am. J. Transl. Res. 3, 166–179 [PMC free article] [PubMed] [Google Scholar]
- 54. Xu W. S., Parmigiani R. B., Marks P. A. (2007) Histone deacetylase inhibitors: molecular mechanisms of action. Oncogene 26, 5541–5552 [DOI] [PubMed] [Google Scholar]
- 55. Vermeulen M., Eberl H. C., Matarese F., Marks H., Denissov S., Butter F., Lee K. K., Olsen J. V., Hyman A. A., Stunnenberg H. G., Mann M. (2010) Quantitative interaction proteomics and genome-wide profiling of epigenetic histone marks and their readers. Cell 142, 967–980 [DOI] [PubMed] [Google Scholar]
- 56. Wang Z., Zang C., Rosenfeld J. A., Schones D. E., Barski A., Cuddapah S., Cui K., Roh T.-Y., Peng W., Zhang M. Q., Zhao K. (2008) Combinatorial patterns of histone acetylations and methylations in the human genome. Nat. Genet. 40, 897–903 [DOI] [PMC free article] [PubMed] [Google Scholar]
- 57. Campos E. I., Reinberg D. (2009) Histones: annotating chromatin. Annu. Rev. Genet. 43, 559–599 [DOI] [PubMed] [Google Scholar]
- 58. Copeland R. A., Pompliano D. L., Meek T. D. (2006) Drug-target residence time and its implications for lead optimization. Nat. Rev. Drug Discov. 5, 730–739 [DOI] [PubMed] [Google Scholar]