

Abstract
The number of circulating lymphocytes on day 15 after transplantation correlates with improved survival in patients with myeloma, but the lymphocyte subset responsible is unknown. NKG2D is a natural killer (NK) cell activating receptor that mediates non-MHC restricted and TCR-independent cell lysis. Our preliminary results indicate that CD3+CD8+ T cells expressing NKG2D may be a critical lymphocyte population. A phase II trial examined the feasibility of infusing ex vivo-expanded cells enriched for NKG2D+CD3+CD8+ T cells at weeks 1, 2, 4, and 8 after an autologous transplantation. In addition, low-dose IL-2 (6 × 10⁵ IU/m2/day) was administered for 4 weeks, beginning on the day of transplantation. Twenty-three patients were accrued and 19 patients are evaluable. There were no treatment-related deaths. All patients completed their course of IL-2 and demonstrated normal engraftment. When compared with patients with myeloma who underwent transplantation not receiving posttransplantation immune therapy, the treated patients demonstrated an increase in the number of circulating NKG2D+CD3+CD8+ T cells/μL (P < .004), CD3+CD8+ T cells/μL (P < .04), CD3+CD8+CD56+ T cells/μL (P < .004), and NKG2D+CD3−CD56+ T cells/μL (P < .003). Myeloma cell-directed cytotoxicity by the circulating mononuclear cells increased after transplantation (P < .002). When compared to posttransplantation IL-2 therapy alone in this patient population, the addition of cells enriched for NKG2D+CD3+CD8+ T cells increased tumor-specific immunity, as demonstrated by enhanced lysis of autologous myeloma cells (P = .02). We postulate that this regimen that increased the number and function of the NKG2D+CD3+CD8+ T cells after transplantation may improve clinical outcomes by eliminating residual malignant cells in vivo.
Keywords: Myeloma, NKG2D+CD8+ T cells, Immunotherapy, Ex vivo expansion
INTRODUCTION
Multiple myeloma is incurable with standard therapy [1,2]. The number of lymphocytes infused as part of the transplanted graft and the number of lymphocytes circulating on day 15 after transplantation, known as the “ALC15,” correlate with improved progression-free and overall survival [3,4]. Despite these results, the lymphocyte subset responsible for the improved outcome is unknown. Our preliminary results suggest that a subset of CD3+CD8+ T cells that express a natural killer (NK) cell activating receptor, called NKG2D, may be the responsible lymphocytes [5–10]. NKG2D is expressed on the cell surface of some CD8+ T cells, NK cells and γδT cells. It mediates non-MHC restricted and TCR-independent cell lysis by recognizing 1 of its 6 ligands [11]. The NKG2D ligands are selectively expressed on tumor cells, including myeloma, lymphoma, leukemia, and most carcinomas [12,13].
We developed ex vivo expansion methods to enrich for NKG2D+CD3+CD8+ T cells using mobilized peripheral blood progenitor cells [14]. These NKG2D+CD3+CD8+ T cells recognized and killed autologous myeloma cells, and the cytotoxicity correlated with the amount of ligand expression on the tumor cell [5,6,8,14–16].
Based on these results, we designed a phase II clinical trial to evaluate the efficacy of infusing ex vivo-expanded cells enriched for NKG2D+CD3+CD8+ T cells after an autologous transplantation. Patients also received posttransplantation IL-2 for 4 weeks [5,7,8,17,18]. The clinical objectives were to define engraftment and toxicity in patients conditioned with this regimen. The laboratory objective was to evaluate the in vivo effects of this therapy. The results demonstrate a significant recovery of autologous myeloma-specific cytotoxic lymphocytes after transplantation, including an increase in the number of circulating NKG2D+CD3+CD8+ T cells/μL with increased autologous myeloma cell-directed cytotoxicity.
MATERIALS AND METHODS
Patient Population and Eligibility Criteria
Patients between the ages of 17 and 70 years with pathologically confirmed multiple myeloma and a Karnofsky status of ≥80% were eligible for this study. Adequate cardiopulmonary function was required, including an ejection fraction ≥45%, carbon monoxide diffusing capacity ≥60%, and forced expiratory volume in 1 second and forced vital capacity both ≥70% of predicted. The creatinine clearance was required to be >50 mL/min. The protocol was approved by Dartmouth Medical School’s Committee for the Protection of Human Subjects. All patients signed an informed consent to participate in this study. Any patient who successfully mobilized and received a transplantation with IL-2 therapy was considered to be evaluable.
Treatment Plan
Mobilization
Peripheral blood progenitor cells were mobilized using cyclophosphamide (3 grams/m2). Recombinant granulocyte colony-stimulating factor (Amgen, Thousand Oakes, CA) was started 48 hours after the cyclophos-phamide and continued daily (10 μg/kg/day) until completion of cell collection (Figure 1). Leukocytopheresis was initiated after recovery of the WBC count to >1000/μL and the peripheral blood CD34+ cell number was ≥5 CD34+ cells/μL. Daily leukocytophereses of 15 to 20 liters of whole blood (approximately 3.5 to 4.5 total blood volumes over the course of 300 minutes) were performed and continued until ≥3 × 10⁶ CD34+ cells/kg had been collected.
Figure 1.
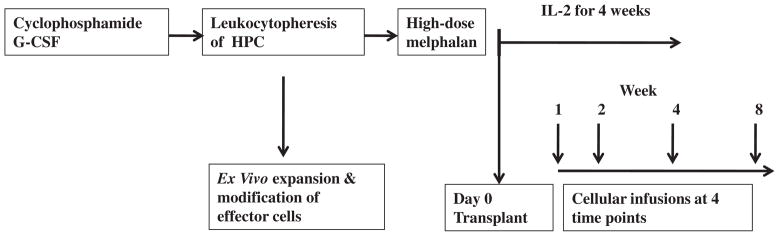
Treatment schema. HPC indicates hematopoietic progenitor cells. IL-2 was administered weeks 1 through 4. Week 1 = day #3 posttransplantation; week 2 = day #14 posttransplantation; week 4 = day #28 posttransplantation; and week 8 = day #56 posttransplantation.
Transplantation regimen
Patients received melphalan (200 mg/m2) on day -3 and progenitor cells were infused on day 0. The goal was to infuse 3 × 10⁶ CD34+cells/kg. Prophylactic ciprofloxacin, penicillin, acyclovir, and fluconazole were administered beginning on the day of melphalan administration.
The dose and duration of IL-2 (Prometheus Laboratories Inc, San Diego, CA) were based on our prior clinical trials [7,17–19]. IL-2 (6 × 10⁵ IU/m2/day) was started on day 0 and administered as a twice-a-day subcutaneous injection, and given on a 5-days on 2-days off cycle for 4 consecutive weeks. Granulocyte macrophage colony-stimulating factor (250 μg/m2/day) (Bayer, Pittsburgh, PA) was started on day 5 and continued until the absolute granulocyte count exceeded 1000/μL.
Ex vivo expansion methods
The ex vivo expansion was performed under good manufacturing practice standards, using a Food and Drug Administration-approved IND (IND #13205) [8]. Briefly, at the time of progenitor cell collection, a portion of the cells was used for ex vivo expansion. The cells that were used for the transplantation were cryopreserved in cryoprotectant containing 20% DMSO (Cryoserv, Bioniche Pharma LLC, Lake Forest, IL), 40% autologous plasma, and 40% Normosol-R (Hospira Inc, Lake Forest, IL) that was mixed with the patient’s cells in a 1:1 ratio (final DMSO concentration was 10%). For the expansion process, the remaining cells were processed on the Elutra Cell Separation System (Caridian BCT, Lakewood, CO) to isolate and to enrich for lymphocytes. The lymphocyte fraction was placed into 1000 mL Lifecell Culture Bags (Baxter, Deerfield, IL) with serum-free AIM V medium (Invitrogen Corp. Carlsbad, CA), IL-2 (1000 IU/mL) and OKT-3 (500 ng/mL) (Ortho Biotech Products, Raritan, NJ). The IL-2, OKT-3, and supplemental AIM V were added every other day and the cultures were incubated in 5% CO2 at 37°C for 7 days. On day 7, a sample was evaluated for cell number, viability, and CD3+ cell content. Cell expansion was determined using flow cytometry by identifying the absolute number of CD3+ cells in culture. Release criteria of the cells included a negative gram stain, negative endotoxin (Lonza, Basel, Switzerland), and mycoplasma testing (Bionique Testing Laboratories, Saranac Lake, NY). Each sample was also cultured for 7 days using Aerobic/Anaerobic BacT/Alert culture (bioMerieux, Marcy l’Etoile, France).
Ex vivo cell infusions
The expanded cells were infused during week #1 (day 3), week #2 (day 14), week #4 (day 28), and week #8 (day 56) (Figure 1). The goal was to administer 1 × 10⁹ ex vivo expanded CD3+ T cells at each of the 4 time points [8,14,20–22]. Each patient whose cells expanded was to receive the ex vivo expanded cells, if release criteria were met. Each patient was analyzed on an “intent-to-treat” nschema. To exploit the period of posttransplantation immune reconstitution, ex vivo-expanded cells were to be infused beginning within 3 days after transplantation. Cells were thawed in a hot water bath at the patient’s bedside and infused i.v. over 30 minutes.
Posttransplantation monitoring
Patients were evaluated daily during their transplantation course by physical examination, a complete blood count, electrolytes, and kidney and liver function tests. Toxicities were graded according to the National Cancer Institute Common Toxicity Criteria (version 4.0). All data were placed into a bone marrow (BM) transplantation-specific database (Stem Soft Company, Vancouver, British Columbia, Canada). Irradiated RBCs or single donor platelet transfusions were administered if patients were symptomatic or if the hemoglobin fell below 8 g/dL or the platelets dropped below 5000/μL, respectively. Engraftment was defined as an absolute neutrophil count of ≥500/μL for 3 consecutive days and a platelet count of ≥20,000/μL for 3 consecutive days (untransfused).
Monitoring after discharge
After discharge, patients were evaluated weekly for 1 month and then returned to their referring hematologist. Weekly visits included a physical examination, a blood count, electrolytes, and kidney and liver function tests.
Patients were evaluated for response at day 100 posttransplantation, then every 6 months for 2 years, and then annually. The evaluation included a physical examination, BM aspirate and biopsy, skeletal survey, serum protein electrophoresis, urine protein electrophoresis, and liver and kidney function tests.
Definitions of response
Complete response (CR) required the disappearance of monoclonal protein in serum and urine, and a BM biopsy demonstrating ≤5% plasma cells. Skeletal x-rays were required to show either recalcification or no change in lytic lesions. A very good partial response (VGPR) was defined as a CR, except for the presence of an isolated monoclonal M spike. Partial response (PR) was defined as >50% reduction in monoclonal protein in serum and urine, a decrease in BM plasma cells by at least 25%, and no increase in size or number of lytic lesions. Patients not meeting one of the above categories were categorized as stable disease.
Laboratory Analysis
Flow cytometry analyses
The cell surface phenotype of the circulating blood mononuclear cells after transplantation was examined using flow cytometry with fluorochrome-conjugated Abs directed against T lymphocytes (CD3, CD4, CD8; BD Biosciences, San Jose, CA), NK cells (CD56; BD Biosciences), the IL-2 receptor (CD25; BD Biosciences), and the NK cell activating receptor, NKG2D (BD Biosciences). NKG2D ligand expression on patients’ myeloma cells was measured by multicolor labeling of myeloma cells using Abs directed against CD138 (a marker for myeloma cells, BD Biosciences), MICA, MICB, ULBP1, ULBP2, and ULBP3 (1.25 μg/mL; R&D Systems, Minneapolis, MN).
Cells were analyzed using FACScan or FACSCanto (Becton Dickinson, San Jose, CA) using a standard lymphocyte gate and recorded as percent of positive cells. Data were analyzed using Cell quest (Becton Dickinson, San Jose, CA) and FlowJo software (Tri star INC., Chatsworth, CA). The absolute number of lymphocytes/μl was calculated by normalizing the percentage of positive cells to each patient’s absolute number of circulating lymphocytes on the corresponding day.
Isolation of myeloma cells from patients’ BM
Patients’ marrow samples were processed using Ficoll-Paque PLUS density separation and then incubated in AIM V media supplemented with IL-6 (R&D systems, Minneapolis, MN; 10 ng/mL) for 72 hours to enrich for myeloma cells [10,23,24].
Cytotoxicity assays
A standard chromium release assay was performed to examine cyto-toxicity of patients’ cells directed against myeloma cells [8,14]. A human myeloma cell line (RPMI8226) or autologous myeloma cells served as targets.
Identification of Control Patients for Comparison of Laboratory Results
We identified a control group of patients with myeloma (n = 6) for comparison of laboratory results. These patients with myeloma were treated during the same time period as the ongoing clinical trial. This control group included patients with myeloma who received an autologous transplantation after melphalan, at the same dose as the study patients. After transplantation, the control patients received the same dose/duration of growth factor support as the study patients. These patients did not receive any immunotherapy.
Statistical Analyses
The clinical objectives were to define engraftment and toxicity in patients conditioned with this regimen. The laboratory objective was to evaluate the in vivo effects of this therapy. The projected sample size was estimated to be 19 evaluable patients. With this sample size, the 95% confidence interval for engraftment will have a half-width not exceeding ≥22%.
Statistical analyses for the differences observed in each experiment were determined using the t test, at the 95% confidence interval. Graph Pad PRISM 5 statistical software (La Jolla, CA) or Microsoft Excel (Redmond, WA) were used. Survival and duration of response were measured from the date of transplantation.
RESULTS
Patient Demographics and Disease Characteristics
Twenty-three patients with myeloma were accrued to the trial with a median age of 60 years (range, 42–72 years). Four patients were not evaluable because of failure to mobilize cells (n = 2), progressive disease before mobilization (n = 1), or refusal to pursue transplantation (n = 1). At the time of transplantation, 5 patients were in CR, 8 patients demonstrated a VGPR, and 5 patients were in PR. One patient had refractory disease. The majority of patients received 1 prior regimen (n = 12; range, 1–4; Table 1).
Table 1.
Patient Demographics
| Number of patients accrued | n = 23 |
|---|---|
| Male/female | 14/9 |
| Age (median; range) | 60 yrs (42–72 yrs) |
| Evaluable patients | n = 19 |
| None valuable patients | n = 4 |
| Failed to mobilize cells | n = 2 |
| Progressive disease | n = 1 |
| Refused transplantation | n = 1 |
| Type of myeloma | |
| Ig G | n = 14 patients |
| Ig A | n = 1 patients |
| Ig M | n = 1 patients |
| Ig D | n = 1 patients |
| Light chain | n = 3 patients |
| Nonsecretory | n = 3 patients |
| Disease status at the time of transplantation | |
| CR | n = 5 patients |
| VGPR | n = 8 patients |
| PR | n = 5 patients |
| Refractory | n = 1 patients |
| Number of previous therapies | |
| One | n = 12 patients |
| Two | n = 7 patients |
| Three | n = 3 patients |
| Four | n = 1 patients |
CR indicates complete response; VGPR, very good partial response; PR, partial response.
Characteristics of the Ex Vivo-Expanded Cells
We demonstrated that the ex vivo expansion process enriched for NKG2D+CD3+CD8+ T cells and that the CD8+ T cells greatly increase NKG2D expression on their cell surface during ex vivo expansion [14]. Ex vivo expansion process resulted in a 3-fold increase in the number of CD3+ T cells, equally distributed between CD3+CD4+ T cells (51%) and CD3+CD8+ T cells (49%). A minor population within the expanded cells included CD56+NK T cells, (CD8+CD56+ T cells and CD3−CD56+ NK cells), comprising 6 + 0.6% of cells. Viability of each of the ex vivo expanded products was >70%.
Mobilization, Ex Vivo Cell Expansion, and Infusion of Cells
Of the 19 evaluable patients who successfully mobilized cells, the progenitor cells from 4 patients did not proliferate (Figure 2). Of the remaining 15 patients, the goal was to infuse 1 ×10⁹ CD3+ T cells for each of the 4 infusions. The number of infusions varied based on the number of cells that expanded; patients received 4 infusions (n = 9), 3 infusions (n = 2), 2 infusions (n = 2), or 1 infusion (n = 2). The median number of CD3+ T cells per infusion was 1 × 10⁹ (range, 0.6 × 10⁹ to 1.4 × 10⁹).
Figure 2.

Patient accrual to trial. Demonstrates the patients’ accrual to the trial and distribution into evaluable and nonevaluable groups.
Of the patients who demonstrated successful mobilization and proceeded onto transplantation, the median number of leukocytophereses was 2 (range, 1–3) with a collection of 7.7 × 10⁶ CD34+ cells/kg (median; range, 1–17.5 ×10⁶) and 2.5 ×10⁸ mononuclear cells/kg (median; range, 1.1–7.8 ×10⁸; Table 2). The median number of CD34+ cells/kg infused was 3.7 ×10⁶ cells CD34+ cells/kg (range, 1.8–9.2 ×10⁶).
Table 2.
Collection Products and Cell Numbers Infused
| No. of Collections | Cells Collected
|
No. of CD34/kg Infused
|
No. of CD3+ T Cells Infused × 109
|
|||||
|---|---|---|---|---|---|---|---|---|
| CD34/kg × 106 | MNC/kg × 108 | No. × 106 | Day 3 | Day 14 | Day 28 | Day 56 | ||
| UPN 1 | 1 | 16.2 | 1.07 | 9.23 | 9.23 | NA | NA | NA |
| UPN 2 | NA | NA | NA | NA | NA | NA | NA | NA |
| UPN 3 | 3 | 4.05 | 1.54 | 3.45 | 1.13 | NA | NA | NA |
| UPN 4 | 2 | 14 | 1.3 | 3.22 | 1.04 | 1.04 | 1.04 | 1.04 |
| UPN 5 | 3 | 5.01 | 1.15 | 2.49 | 0.92 | 0.92 | 0.92 | NA |
| UPN 6 | 2 | 6.31 | 1.08 | 3.81 | 0.62 | 0.62 | 0.62 | 0.62 |
| UPN 7 | 2 | 3.81 | 2.22 | NA | NA | NA | NA | NA |
| UPN 8 | 3 | 9.33 | 2.12 | 4.04 | 1.02 | 1.02 | 1.02 | 1.02 |
| UPN 9 | 2 | 15.7 | 1.45 | 4.68 | 1.06 | 1.06 | 1.06 | 1.06 |
| UPN 10 | 2 | 10.1 | 1.75 | 5.29 | 0.91 | 0.91 | 0.91 | 0.91 |
| UPN 11 | 2 | 10.1 | 3.89 | 6.47 | 1.0 | 1.0 | 1.0 | 1.0 |
| UPN 12 | 2 | 12.7 | 2.93 | 3.12 | 0.95 | 0.95 | NA | NA |
| UPN 13 | 3 | 2.89 | 5.86 | 1.84 | 0.63 | 0.63 | NA | NA |
| UPN 14 | 2 | 2.77 | 7.78 | NA | NA | NA | NA | NA |
| UPN 15 | NA | NA | NA | NA | NA | NA | NA | NA |
| UPN 16 | 2 | 3.66 | 5.04 | 3.74 | 1.04 | 1.04 | 1.04 | 1.04 |
| UPN 17 | 2 | 12.1 | 3.09 | NA | NA | NA | NA | NA |
| UPN 18 | 1 | 9.08 | 3.49 | 3.67 | NA | NA | NA | NA |
| UPN 19 | 2 | 4.64 | 3.9 | NA | NA | NA | NA | NA |
| UPN 20 | NA | NA | NA | NA | NA | NA | NA | NA |
| UPN 21 | 1 | 7.69 | 2.47 | 1.8 | 1.39 | 1.39 | 1.39 | 1.39 |
| UPN 22 | 1 | 17.5 | 5.63 | 4.59 | 1.27 | 1.27 | 1.27 | NA |
| UPN 23 | 2 | 6.54 | 4.74 | 2.68 | 1.0 | 1.0 | 1.0 | 1.0 |
| Median | 2 | 7.69 | 2.47 | 3.7 | 1.01 | 1.01 | 1.01 | 1.01 |
| Range | (1–3) | (2.77–17.5) | (1.07–7.78) | (1.84–9.23) | (0.62–1.39) | (0.62–1.39) | (0.62–1.39) | (0.62–1.39) |
MNC indicates mononuclear cell; NA, not applicable.
Engraftment and Length of Stay
Of the 19 patients who underwent transplantation-engrafted neutrophils on day 13 (median; range, 12–16 days) and platelets on day 16 (median; range, 10–26 days), 2 of the patients received their transplantation as an outpatient and spent 3 days in the hospital (median; range, 2–4 days). The remaining 17 patients spent 17 days in the hospital (median; range, 15–26 days).
IL-2 Treatment, Posttransplantation Course, and Toxicities
There were no treatment-related deaths. Each of the 19 evaluable patients completed the full course of IL-2 therapy.
The toxicities were relatively mild and transient. Four patients experienced moderate (grade III, n = 3) or severe (grade IV, n = 1) infections. Other moderate toxicities (grade III) included nausea/vomiting (n = 2), increased liver function tests (n = 2), anorexia (n = 3), mucositis (n = 1), or constipation (n = 1).
Two patients experienced transient fever, tachycardia, and hypotension (grade III toxicities) during the ex vivo cell infusion. These signs and symptoms resolved within 1 hour after the cell infusion.
Posttransplantation Recovery of Cytotoxic Effector Cells in the Peripheral Blood
Because our initial hypothesis was that this regimen would increase the ALC15, we analyzed the absolute lymphocyte recovery. Study patients demonstrated an elevated ALC15 of 691 lymphocytes/μL (median; range, 281–1785) compared with an ALC15 of 327 lymphocytes/μL (median; range, 244–408) in the control patients (P < .04; Figure 3A). We postulated that the infusion of the ex vivo expanded cells with IL-2 administration would increase the early recovery of NKG2D+CD3+CD8+ T cells in vivo. Figure 3B demonstrates an increase in the number of circulating NKG2D+CD3+CD8+ T cells at 15 days after transplantation, compared with control patients (P < .02).
Figure 3.

Lymphocyte recovery on day 15 after transplantation. (A) Absolute lymphocyte numbers were calculated for each patient based on the number of lymphocytes circulating on day 15 after transplantation (ALC15). When compared to the control group (n = 6), ALC15 in the study group (n = 17) is significantly increased (P < .04). The control group = patients not treated on trial; the study group = patients treated on trial. (B) Flow cytometry identified the number of NKG2D+CD3+CD8+ T cells circulating in the study group (n = 12) and the control group (n = 4) patients on day 15 after transplantation (P =.02). The control group = patients not treated on trial; the study group = patients treated on trial. (C) Blood samples were obtained from patients treated on the trial (study group; n = 7) and patients from the control group (n = 4) between days 21 and 28 after transplantation. Flow cytometric analyses identified cell populations circulating in the blood in the 2 groups. When comparing cellular subsets between the 2 groups, there was a statistically significant increase in CD3+ T cells (P <.0001), CD4+ T cells (P <.0009), CD8+ T cells (P <.007), and CD25+ cells (P <.009). The control group = patients not treated on trial; the study group = patients treated on trial. * Defines statistically significant results.
There was a significant increase in the number of CD3+ T cells (P < .0001), CD4+ T cells (P < .0009), and CD8+ T cells (P <.007) in study patients, compared with the control group (Figure 3C). There was also an increase in the IL-2 receptor expression (CD25) on circulating lymphocytes (P < .009). There was no difference between the groups in the number of circulating cytokine-induced killer cells, typically defined as CD8+CD56+ cells.
We were interested in 4 effector cell populations after transplantation using this regimen. There was an increase in the absolute number of circulating NKG2D+CD3+CD8+ T cells/μL (P < .004), CD3+CD8+ T cells/μL (P < .04), CD3+CD8+CD56+ T cells/μL (P < .004), and NKG2D+CD3−CD56+ T cells/μL (P < .003; Figure 4).
Figure 4.

Circulating lymphocyte subsets in peripheral blood after transplantation. Phenotypic analyses identified the absolute number of NKG2D+CCD3+CD8+ (A), CD3+CD8+ (B), CD3+CD8+CD56+ (C), and NKG2D+CD3−CD56+ cells/μL (D) in the study group (n = 12) and in the control group (n = 4) between days 21 and 28 after transplantation. There was an increase in the absolute number of circulating NKG2D+CD3+CD8+ T cells (P < .004), CD3+CD8+ T cells (P <.04), CD3+CD8+CD56+ (P < .004), and NKG2D+CD3-CD56+ cells (P < .003) when compared to circulating cells in the control group. * Defines statistically significant results.
Cytotoxicity: Evidence of Tumor-Specific Immunity
NKG2D ligand expression was examined on patients’ myeloma cells. Figure 5 demonstrates that patients’ myeloma cells strongly expressed 3 of the 6 NKG2D ligands tested, including MICA, ULBP-1, and ULBP-3, when compared to normal hematopoietic cells.
Figure 5.

NKG2D ligand expression in autologous myeloma cells. NKG2D ligand expression on autologous myeloma cells (n = 5) or normal control marrows (n = 3) was measured by labeling cells with Abs directed against CD138, in combination with Abs directed against MICA, MICB, ULBP1, ULBP2, and ULBP3. The expression of MICA (A), ULBP1 (B), and ULBP3 (C) is significantly elevated on autologous myeloma cells (MM), when compared to controls (Control) (P < .0001 for each of the 3 ligands).
Cytotoxicity of the circulating blood mononuclear cells was assessed using a human myeloma cell line (RPMI 8226) as targets. Cytotoxicity of the circulating mononuclear cells was markedly increased in the patients treated on trial compared with control patients (Figure 6; P≤ .002).
Figure 6.

Cytotoxicity after transplantation. Peripheral blood mononuclear cells (PBMCs) were isolated from study group patients (n = 5) and control patients (n = 4) between days 21 and 28 after transplantation. PBMCs were used as effector cells in a 51Cr-release cytotoxicity assay against a myeloma cell line (RPMI8226; E:T 100:1 for experimental and control groups). Myeloma cell lysis was significantly increased against RPMI cells in the study patients when compared with control patients (P = .002).
Autologous myeloma cells were also used to examine tumor-specific cytotoxicity. Patients’ mobilized peripheral blood mononuclear cells (PBMCs) were isolated from study patients (n = 4) on the day of collection (“pre-expansion”) and were expanded using the methods described above with IL-2 and OKT3 for 7 days (“post-expansion”). Both pre-expansion and post-expansion cells served as effector cells in a cytotoxicity assay against autologous myeloma cells (Figure 7). Autologous myeloma cell lysis was significantly increased after enrichment for NKG2D+CD3+CD8+ T cells (P = .02). Cytotoxicity was inhibited by NKG2D receptor blocking (P < .001).
Figure 7.

Cytotoxicity against autologous cells. Patients’ mobilized peripheral blood mononuclear cells (PBMCs) were isolated from study group patients (n = 4) on the day of collection (“pre-expansion”) and were expanded ex vivo using methods described within the article with IL-2 and OKT3 for 7 days (“post-expansion”). Both pre-expansion and post-expansion cells served as effector cells in a 51Cr-release cytotoxicity assay against autologous myeloma cells (E:T 50:1). Myeloma cell lysis was significantly increased against autologous myeloma cells after enrichment for NKG2D+CD3+CD8+ T cells (P = .02). Cytotoxicity was inhibited by NKG2D receptor blocking (P < .001) using the same effectors and targets.
Response to Transplantation and Outcome Data
Of the 19 patients who underwent transplantation, responses at 100 days after transplantation included CR (n = 12), VGPR (n = 5), PR (n = 1), and progressive disease (n = 1). With a median follow-up of 25 months (range, 15–48 months), 17 patients are alive. Two patients have died due to progressive disease at 15 and 18 months after transplantation. Of the 17 living patients, 8 patients remain disease-free at 22 months after transplantation (median; range, 16–42 months).
DISCUSSION
Despite transplantation’s success in improving survival in patients with myeloma, the majority of patients relapse, stressing the need for innovative therapies [25,26]. Our previous laboratory and clinical results demonstrated that a specific population of CD3+CD8+ T cells expressing an NK cell activating receptor named NKG2D played a critical role in killing autologous myeloma cells and could be a critical lymphocyte population that contributes to improved survival after transplantation [10,15,16,27]. The results of this phase II trial demonstrate that this treatment is feasible and safe, resulted in an increased absolute lymphocyte count on day 15 after transplantation, and enhanced the number of circulating NKG2D+CD3+CD8+ T cells. In addition, the circulating mononuclear cells demonstrated enhanced cytotoxicity against patients’ autologous myeloma cells [10]. We postulate that the increased number and function of the NKG2D+CD3+CD8+ T cells may improve clinical outcomes by eliminating residual myeloma cells in vivo. In contrast to our previous trials using posttransplantation IL-2 alone, the addition of adoptive cellular therapy using cells enriched for NKG2D+CD3+CD8+ T cells demonstrates tumor-specific immunity, as demonstrated by the increased lysis of autologous myeloma cells (Figure 7).
Although cytokine and adoptive cellular therapy are not firmly established as treatment for myeloma, our clinical trial results and our mouse experiments support the requirement for NKG2D+CD3+CD8+ T cells to eradicate myeloma cells in vivo [5,6,8,14–16,28–30]. The infusion of murine chimeric NKG2D+CD3+CD8+ T cells in our myeloma-bearing mouse model results in long-term survival and immunity against the tumor [9,16–18,28,29,31–33].
NKG2D is an NK cell activating receptor that is present on some CD8+ T cells, NK cells, and γδT cells. The NKG2D receptor functions in association with an adaptor protein called DAP10. After engagement with a ligand, NKG2D, in complex with its adapter protein DAP10, activates PI3-kinase with subsequent release of inflammatory cytokines and cytolytic proteins causing target cell lysis [13,34]. Cell lysis can be prevented by blocking NKG2D or by blocking one of its ligands [10,14,34]. These ligands are present on most malignant cells, including myeloma, but are not expressed on normal tissue, except for MICA expression on gut epithelial cells [12,35].
The NKG2D receptor model can be used for potential therapeutic benefits. The majority of tumors are sensitive to immune responses that are triggered by the NKG2D activating receptor. Animal studies demonstrate that tumor cells with minimal expression of NKG2D ligands tend to be more resistant to therapy, suggesting the importance of NKG2D-mediated recognition and tumor lysis [16,32,36]. Because malignant cells may escape host recognition by down-regulating MHC expression, NKG2D+CD3+CD8+ T cells provide a unique advantage because they bypass the MHC-restricted and TCR-dependent mechanisms [11].
The NKG2D receptor-ligand model can be manipulated and used as a form of therapy. For example, a unique aspect of this trial was the ability to use an ex vivo expansion process to up-regulate the NKG2D receptor expression on CD3+CD8+ T cells. These NKG2D+CD3+CD8+ T cells were then used as adoptive cellular therapy. Another option is to stimulate NKG2D ligand expression on tumor cells. IL-2 and proteosome inhibitors up-regulate ligand expression on malignant cells and enhance the NKG2D recognition of its ligands [13,23,24,36,37]. Finally, posttransplantation cytokine therapy will influence NKG2D expression on CD3+ T cells. In this trial, the ex vivo expansion process and the administration of IL-2 both up-regulate NKG2D expression and NKG2D ligand expression on effector cells and their targets, respectively.
Despite potential limitations associated with this regimen, our laboratory results are encouraging. Although we adhered to previously successful ex vivo expansion methods, the expansion of NKG2D+CD3+CD8+ T cells was difficult, and adequate expanded cell numbers could not be achieved in some patients. Despite accruing 23 patients, only 15 patients received ex vivo 1/N expanded cells. These difficulties were likely due to complexities with the ex vivo expansion process, as well as difficulty in obtaining an adequate number of cells from the leukocytophereses. Although IL-2 may suppress hematopoiesis, our prior trials using low-dose IL-2 immediately after transplantation did not demonstrate this effect; yet the current patient numbers within this trial are too small to address this question. Finally, because a combination of IL-2 with adoptive cellular therapy was used, we cannot identify if the IL-2 or the cellular infusions demonstrated the greatest impact on the measure parameters. In contrast to our previous trials using post-transplantation IL-2 alone, the addition of adoptive cellular therapy using cells enriched for NKG2D+CD3+CD8+ T cells suggests enhanced tumor-specific immunity, as demonstrated by the increased lysis of autologous myeloma cells.
Our findings introduce a novel method of enhancing NKG2D expression on patients’ effector cells by using ex vivo expansion of patients with myeloma-mobilized PBMCs. Posttransplantation IL-2 and granulocyte macrophage colony-stimulating factor offer the potential advantage of stimulating the immune system while enhancing myeloma cell NKG2D-ligand expression. We are continuing to evaluate treatment regimens that increase NKG2D receptor expression on CD3+CD8+ T cells in vivo, while enhancing the expression of NKG2D ligand expression on myeloma cells. The clinical and laboratory results from this phase II trial suggest a critical role for NKG2D+CD3+CD8+ T cells in the lysis of myeloma cells in the immediate posttransplantation setting. Although the current clinical trial is closed, ongoing analyses are evaluating the longevity of the in vivo circulating NKG2D+CD3+CD8+ T cells. The results from these studies will allow us to better understand cancer mechanisms that could be used to treat many other malignancies, because most malignant cells express targets recognized by the NKG2D+CD3+CD8+ T cells.
Footnotes
The authors have no conflicts of interest to disclose.
Financial disclosure:This study was sponsored in part by a grant from the Hitchcock Foundation, Dartmouth Medical School, and the Dartmouth-Hitchcock Medical Center (K.R.M.); Leukemia and Lymphoma Society Translational Research Grant 6061-06 (K.R.M.); and Dartmouth College COBRE Grants 5P20RR016437-07 (K.R.M. and M.S.E.), R21 CA112761 (K.R.M. and M.S.E.), and R01CA095648 (M.S.E.).
References
- 1.Chanan-Khan AA, Giralt S. Importance of achieving a complete response in multiple myeloma, and the impact of novel agents. J Clin Oncol. 2010;28:2612–2624. doi: 10.1200/JCO.2009.25.4250. [DOI] [PubMed] [Google Scholar]
- 2.Child JA, Morgan GJ, Davies FE, et al. High-dose chemotherapy with hematopoietic stem-cell rescue for multiple myeloma. N Engl J Med. 2003;348:1875–1883. doi: 10.1056/NEJMoa022340. [DOI] [PubMed] [Google Scholar]
- 3.Hiwase DK, Hiwase S, Bailey M, Bollard G, Schwarer AP. Higher infused lymphocyte dose predicts higher lymphocyte recovery, which in turn, predicts superior overall survival following autologous hematopoietic stem cell transplantation for multiple myeloma. Biol Blood Marrow Transplant. 2008;14:116–124. doi: 10.1016/j.bbmt.2007.08.051. [DOI] [PubMed] [Google Scholar]
- 4.Porrata LF, Gertz MA, Inwards DJ, et al. Early lymphocyte recovery predicts superior survival after autologous hematopoietic stem cell transplantation in multiple myeloma or non-Hodgkin lymphoma. Blood. 2001;98:579–585. doi: 10.1182/blood.v98.3.579. [DOI] [PubMed] [Google Scholar]
- 5.Hill J, Wu J, Root L, et al. Immune mobilization with direct in vivo effector response: Clinical trial with favorable implications for post-transplant outcomes. Blood. 2007;110:5120a. [Google Scholar]
- 6.Meehan KR, Talebian L, Wu J, et al. Immune mobilization of autologous blood progenitor cells: direct influence on the cellular subsets collected. Cytotherapy. 2010;12:1013–1021. doi: 10.3109/14653249.2010.515580. [DOI] [PMC free article] [PubMed] [Google Scholar]
- 7.Meehan KR, Wu J, Bengtson E, et al. Early recovery of aggressive cytotoxic cells and improved immune resurgence with post-transplant immunotherapy for multiple myeloma. Bone Marrow Transplant. 2007;39:695–703. doi: 10.1038/sj.bmt.1705665. [DOI] [PubMed] [Google Scholar]
- 8.Meehan KR, Wu J, Webber SM, Barber A, Szczepiorkowski ZM, Sentman C. Development of a clinical model for ex vivo expansion of multiple populations of effector cells for adoptive cellular therapy. Cytotherapy. 2008;10:30–37. doi: 10.1080/14653240701762398. [DOI] [PubMed] [Google Scholar]
- 9.Sentman CL, Barber MA, Barber A, Zhang T. NK cell receptors as tools in cancer immunotherapy. Adv Cancer Res. 2006;95:249–292. doi: 10.1016/S0065-230X(06)95007-6. [DOI] [PubMed] [Google Scholar]
- 10.Talebian L, Wu JY, Fischer DA, et al. Novel mobilization strategies to enhance autologous immune effector cells in multiple myeloma. Front Biosci (Elite Ed) 2011;3:1500–1508. doi: 10.2741/e351. [DOI] [PMC free article] [PubMed] [Google Scholar]
- 11.Coudert JD, Held W. The role of the NKG2D receptor for tumor immunity. Semin Cancer Biol. 2006;16:333–343. doi: 10.1016/j.semcancer.2006.07.008. [DOI] [PubMed] [Google Scholar]
- 12.Nausch N, Cerwenka A. NKG2D ligands in tumor immunity. Oncogene. 2008;27:5944–5958. doi: 10.1038/onc.2008.272. [DOI] [PubMed] [Google Scholar]
- 13.Smyth MJ, Cretney E, Kelly JM, et al. Activation of NK cell cytotoxicity. Mol Immunol. 2005;42:501–510. doi: 10.1016/j.molimm.2004.07.034. [DOI] [PubMed] [Google Scholar]
- 14.Wu JY, Ernstoff MS, Hill JM, Cole B, Meehan KR. Ex vivo expansion of non-MHC-restricted cytotoxic effector cells as adoptive immunotherapy for myeloma. Cytotherapy. 2006;8:141–148. doi: 10.1080/14653240600620218. [DOI] [PubMed] [Google Scholar]
- 15.Barber A, Meehan KR, Sentman CL. Treatment of multiple myeloma with adoptively transferred chimeric NKG2D receptor-expressing T cells. Gene Ther. 2011;18:509–516. doi: 10.1038/gt.2010.174. [DOI] [PMC free article] [PubMed] [Google Scholar]
- 16.Barber A, Zhang T, Megli CJ, Wu J, Meehan KR, Sentman CL. Chimeric NKG2D receptor-expressing T cells as an immunotherapy for multiple myeloma. Exp Hematol. 2008;36:1318–1328. doi: 10.1016/j.exphem.2008.04.010. [DOI] [PMC free article] [PubMed] [Google Scholar]
- 17.Meehan KR, Verma UN, Rajogopal C, Cahill R, Frankel S, Mazumder A. Stem cell transplantation with chemoradiotherapy myeloablation and interleukin-2. J Infus Chemother. 1996;6:28–32. [PubMed] [Google Scholar]
- 18.Meehan KR, Wu A, Hassan R, et al. Ex vivo cytokine activation of peripheral blood stem cells: a potential role for adoptive cellular immunotherapy. J Hematother Stem Cell Res. 2001;10:283–290. doi: 10.1089/15258160151135006. [DOI] [PubMed] [Google Scholar]
- 19.Meehan KR, Verma UN, Cahill R, et al. Interleukin-2-activated hema-topoietic stem cell transplantation for breast cancer: investigation of dose level with clinical correlates. Bone Marrow Transplant. 1997;20:643–651. doi: 10.1038/sj.bmt.1700954. [DOI] [PubMed] [Google Scholar]
- 20.Laport GG, Levine BL, Stadtmauer EA, et al. Adoptive transfer of cos-timulated T cells induces lymphocytosis in patients with relapsed/refractory non-Hodgkin lymphoma following CD34+-selected hematopoietic cell transplantation. Blood. 2003;102:2004–2013. doi: 10.1182/blood-2003-01-0095. [DOI] [PubMed] [Google Scholar]
- 21.Levine BL, Bernstein WB, Aronson NE, et al. Adoptive transfer of costimulated CD4+ T cells induces expansion of peripheral T cells and decreased CCR5 expression in HIV infection. Nat Med. 2002;8:47–53. doi: 10.1038/nm0102-47. [DOI] [PubMed] [Google Scholar]
- 22.Rapoport AP, Stadtmauer EA, Aqui N, et al. Restoration of immunity in lymphopenic individuals with cancer by vaccination and adoptive T-cell transfer. Nat Med. 2005;11:1230–1237. doi: 10.1038/nm1310. [DOI] [PubMed] [Google Scholar]
- 23.von Strandmann EP, Hansen HP, Reiners KS, et al. A novel bispecific protein (ULBP2-BB4) targeting the NKG2D receptor on natural killer (NK) cells and CD138 activates NK cells and has potent antitumor activity against human multiple myeloma in vitro and in vivo. Blood. 2006;107:1955–1962. doi: 10.1182/blood-2005-05-2177. [DOI] [PubMed] [Google Scholar]
- 24.Zhang XG, Klein B, Bataille R. Interleukin-6 is a potent myeloma-cell growth factor in patients with aggressive multiple myeloma. Blood. 1989;74:11–13. [PubMed] [Google Scholar]
- 25.Barlogie B, Jagannath S, Desikan KR, et al. Total therapy with tandem transplants for newly diagnosed multiple myeloma. Blood. 1999;93:55–65. [PubMed] [Google Scholar]
- 26.Hayashi T, Hideshima T, Anderson KC. Novel therapies for multiple myeloma. Br J Haematol. 2003;120:10–17. doi: 10.1046/j.1365-2141.2003.03929.x. [DOI] [PubMed] [Google Scholar]
- 27.Chen X, Bai F, Sokol L, et al. A critical role for DAP10 and DAP12 in CD8+ T cell-mediated tissue damage in large granular lymphocyte leukemia. Blood. 2009;113:3226–3234. doi: 10.1182/blood-2008-07-168245. [DOI] [PMC free article] [PubMed] [Google Scholar]
- 28.Barber A, Zhang T, DeMars LR, Conejo-Garcia J, Roby KF, Sentman CL. Chimeric NKG2D receptor-bearing T cells as immunotherapy for ovarian cancer. Cancer Res. 2007;67:5003–5008. doi: 10.1158/0008-5472.CAN-06-4047. [DOI] [PubMed] [Google Scholar]
- 29.Barber A, Zhang T, Sentman CL. Immunotherapy with chimeric NKG2D receptors leads to long-term tumor-free survival and development of host antitumor immunity in murine ovarian cancer. J Immunol. 2008;180:72–78. doi: 10.4049/jimmunol.180.1.72. [DOI] [PubMed] [Google Scholar]
- 30.Zhang T, Barber A, Sentman CL. Generation of antitumor responses by genetic modification of primary human T cells with a chimeric NKG2D receptor. Cancer Res. 2006;66:5927–5933. doi: 10.1158/0008-5472.CAN-06-0130. [DOI] [PubMed] [Google Scholar]
- 31.Baker J, Verneris MR, Ito M, Shizuru JA, Negrin RS. Expansion of cytolytic CD8(+) natural killer T cells with limited capacity for graft-versus-host disease induction due to interferon gamma production. Blood. 2001;97:2923–2931. doi: 10.1182/blood.v97.10.2923. [DOI] [PubMed] [Google Scholar]
- 32.Zhang T, Barber A, Sentman CL. Chimeric NKG2D modified T cells inhibit systemic T-cell lymphoma growth in a manner involving multiple cytokines and cytotoxic pathways. Cancer Res. 2007;67:11029–11036. doi: 10.1158/0008-5472.CAN-07-2251. [DOI] [PubMed] [Google Scholar]
- 33.Zhang T, Lemoi BA, Sentman CL. Chimeric NK-receptor-bearing T cells mediate antitumor immunotherapy. Blood. 2005;106:1544–1551. doi: 10.1182/blood-2004-11-4365. [DOI] [PMC free article] [PubMed] [Google Scholar]
- 34.Pende D, Rivera P, Marcenaro S, et al. Major histocompatibility complex class I-related chain A and UL16-binding protein expression on tumor cell lines of different histotypes: analysis of tumor susceptibility to NKG2D-dependent natural killer cell cytotoxicity. Cancer Res. 2002;62:6178–6186. [PubMed] [Google Scholar]
- 35.El-Sherbiny YM, Meade JL, Holmes TD, et al. The requirement for DNAM-1, NKG2D, and NKp46 in the natural killer cell-mediated killing of myeloma cells. Cancer Res. 2007;67:8444–8449. doi: 10.1158/0008-5472.CAN-06-4230. [DOI] [PubMed] [Google Scholar]
- 36.Smyth MJ, Swann J, Cretney E, Zerafa N, Yokoyama WM, Hayakawa Y. NKG2D function protects the host from tumor initiation. J Exp Med. 2005;202:583–588. doi: 10.1084/jem.20050994. [DOI] [PMC free article] [PubMed] [Google Scholar]
- 37.Valés-Gómez M, Chisholm SE, Cassady-Cain RL, Roda-Navarro P, Reyburn HT. Selective induction of expression of a ligand for the NKG2D receptor by proteasome inhibitors. Cancer Res. 2008;68:1546–1554. doi: 10.1158/0008-5472.CAN-07-2973. [DOI] [PubMed] [Google Scholar]