Abstract
Developmental science is rich with observations of social interactions, but few available methodological and statistical approaches take full advantage of the information provided by these data. The authors propose implementation of the unified structural equation model (uSEM), a network analysis technique, for observational data coded repeatedly across time; uSEM captures the temporal dynamics underlying changes in behavior at the individual level by revealing the ways in which a single person influences – concurrently and in the future – other people. To demonstrate the utility of uSEM, the authors applied it to ratings of positive affect and vigor of activity during children’s unstructured laboratory play with unfamiliar, same-sex peers. Results revealed the time-dependent nature of sex differences in play behavior. For girls more than boys, positive affect was dependent upon peers’ prior positive affect. For boys more than girls, vigor of activity was dependent upon peers’ current vigor of activity.
Keywords: observational methodology, interpersonal interaction, gender differences, play, socio-temporal dynamics, networks
Introduction
From students in classrooms to parents and children in conversation, developmental science is rich with observational data on social interactions. Indeed, observation is the best method for capturing the behavioral processes that underlie interpersonal interactions (Bakeman & Quera, 2012). Unfortunately, the information provided by observational data, especially of social interactions, is rarely utilized to its fullest capacity. Oftentimes the simple frequency or proportion of a behavior is calculated across a set of observations then averaged across participants in a group, losing information about time and individuals. Moreover, social interactions are dynamic processes, and aggregating across time and individuals may produce group-level results that fail to describe any individual in the group. Thus, the results might present inaccurate information about the ways in which individuals interact (Molenaar, 2004; Molenaar & Campbell, 2009).
There is emerging interest in analytic techniques that fully exploit the wealth of information provided by observational data on social interactions. These new techniques have been applied in some developmental domains (e.g., psychopathology; see Dishion & Snyder, 2004), with promising results that encourage application throughout developmental science. For example, an advanced analysis of panel (multidimensional) data, which incorporated playground observations rated in 10-second intervals, revealed that negative peer interactions mediated the link between impulsiveness-inattention and conduct problems for boys, but not for girls (Snyder, Prichard, Schrepferman, Patrick, & Stoolmiller, 2004). In an effort to increase the prevalence of novel findings such as this, we offer the unified structural equation model (uSEM; Kim, Zhu, Chang, Bentler, & Ernst, 2007) for the analysis of social interaction data, which are prevalent in developmental science.
What is Unified Structural Equation Modeling (uSEM)?
uSEM is a combination of two statistical techniques often used in time series data analysis: vector autoregression (VAR) and structural equation modeling (SEM). VAR estimates lagged (at future time points) relations among a set of variables, capturing sequential dependencies in a time series; for example, At1 → Bt2 or Ct1 → Dt3 where t = time. SEM estimates contemporaneous (at the same time point) relations among a set of variables, capturing simultaneous dependencies in a time series; for example, Et1 → Ft1, where t = time. Thus, uSEM estimates both lagged and contemporaneous relations among a set of variables; for example, At1 → Bt2 while Et1 → Ft1, where t = time. Recent evidence suggests that estimates of lagged and contemporaneous relations are accurate only when both types of relations are considered in the same model (Gates, Molenaar, Hillary, Ram, & Rovine, 2010; Kim et al., 2007).
uSEM is a tool of network science, the goal of which is to uncover how properties emerge from relations among a system’s component parts. In psychological and developmental science, network approaches have been used to elucidate static processes underlying behavior. For example, social network analysis has been widely used to understand the quantity and quality of relationships among people, particularly friendships (Borgatti, Mehra, Brass, & Labianca, 2009; Dishion & Tipsord, 2011). Network analysis techniques have also been implemented in psychopathology research to demonstrate how symptoms are related to multiple disorders (Borsboom, Cramer, Schmittmann, Epskamp, & Waldorp, 2011).
Network approaches have rarely been used to elucidate dynamic processes underlying behavior in developmental and psychological science. The neuroscience literature provides one exception: brain function has been shown to emerge from the interrelated activity among various brain regions (Smith et al., 2011; Sporns, 2011). In fact, uSEM has roots in network neuroscience; it was originally developed to identify relations among the activity of brain regions involved in specific tasks, as assessed with functional neuroimaging (Gates et al., 2010; Kim et al., 2007).
We purport that uSEM is a domain-general approach to the analysis of time series data, with applications across psychological and developmental science; it is not restricted to use with functional neuroimaging data. Just as it can reveal how task-related brain activity emerges from the relations among multiple brain regions, uSEM can, for example, reveal how play behavior emerges from the interactions among children in a group. The observational data prevalent in developmental science are recorded across time, but they are rarely analyzed with respect to time, providing great opportunity for time series-based analysis techniques like uSEM.
What are the Requirements for uSEM?
The requirements for conducting uSEM on observational data are minimal. First, the behaviors of interest must show within-individual variability across the observation period; multiple behaviors per person can be studied. Second, behaviors must be transformed into continuous time series (e.g., rated or reported repeatedly across time). Third, the behavioral time series must be converted into a covariance matrix. Fourth, analysis is most easily done with traditional SEM software (e.g., LISREL).
The statistical power for uSEM is based on time series length – not number of participants or groups in a study. The time series length required for uSEM depends on the nature of the data and complexity of the model. Long time series lengths are necessary to detect small effects in complex models, but short time series lengths may suffice if effects are large and models are parsimonious.
What are the Advantages of uSEM?
uSEM has several advantages for the analysis of observational data on social interactions. First, it has advantages over traditional group average approaches. These approaches often aggregate data across observational sessions and groups. Although this approach has yielded many important findings (e.g., same-sex peer play predicts behavior problems in arousable boys but not in arousable girls; Fabes, Shepard, Guthrie, & Martin, 1997), it often loses information about time and individuals. uSEM captures information about time and individuals by estimating both lagged and contemporaneous relations among behaviors and by analyzing behavior at the level of the individual, emphasizing intra-individual variation in the time series data.
Second, uSEM has advantages over other analysis approaches to social interaction data that extend beyond group averages; these advantages are particularly evident when the research goal is to capture intra-individual variation over time using previously-collected observational data. Multilevel models typically identify how individuals in a group differ from the group mean (i.e., inter-individual variation; see Ram & Grimm, 2007). For example, multilevel models showed that mothers who parent in high risk environments use more differential treatment than mothers who parent in low risk environments, and differential treatment predicts child behavior problems, especially for boys (Meunier, Boyle, O'Connor, & Jenkins, 2013). Although some multilevel modeling approaches capture intra-individual variation (e.g., Hoffman, 2007; Hoffman & Stawski, 2009), they usually do so at one future time point (lag of 1), and not at multiple future time points (lag of 2 or more), which is a feature of uSEM.
Sequential analysis identifies patterns in categorically-classified events that emerge across time (Bakeman & Gottman, 1997). For example, sequential analysis revealed that rough-and-tumble playground interactions led to rule-based games for popular children but led to aggression for rejected children, with more rejected boys than girls (Pellegrini, 1988). Unlike uSEM, sequential analysis has requirements about behavioral coding (i.e., categories) and makes inferences at the group level.
Dynamic systems approaches typically identify time-based relations among behaviors that occur at the individual level (Lewis, Lamey, & Douglas, 1999). For example, dynamic state space grids showed that sex segregation (interaction with only same-sex peers) in children’s play depended on child characteristics besides gender, such as emotionality (Martin, Fabes, Hanish, & Holleristein, 2005). Unlike uSEM, dynamic systems approaches often necessitate information in addition to the behavioral time series, such as the spatial location of “attractors” (e.g., presence of certain peer “types” – internalizing, externalizing, competent – in Martin et al., 2005); consequently, uSEM is better-positioned than some dynamic systems approaches to analyze previously collected observational data on social interactions. Other dynamic systems-based approaches have been used to map time-based changes in the self-reported behavior of a single adult dyad (Ferrer & Nesselroade, 2003; Hsieh, Ferrer, Chen, & Chow, 2010), but it is unclear how accurately and efficiently these approaches can be applied to observational data from groups (i.e., more than two people).
We emphasize that the most widely used analysis technique for developmental observational data is group averaging, and that techniques that extend beyond this are rare. Thus, researchers wishing to extend beyond group averages in their analysis of observational data must consider the advantages and disadvantages of each novel technique (see references above) with respect to their specific research goals before implementing one. If the research goal is to examine intra-individual change across time (particularly using previously-collected data), uSEM is an optimal choice.
Third, uSEM can advantageously be applied as a hypothesis-driven or data-driven analysis technique. Hypothesis-driven work provides a confirmatory test of theoretical expectations. To apply uSEM in this top-down fashion, researchers would specify which behaviors they expect to be related, including the direction and timing of each relation; for example, At1 → Bt2 while Et1 → Ft1, where t = time. Researchers would then compare their expected model to the covariance matrix (using SEM software) to statistically determine whether the model fit is acceptable. If the fit is acceptable, the hypothesis is supported; if the fit is unacceptable, the hypothesis is refuted. Data-driven work provides an exploratory investigation that is intended to provide new scientific discoveries. To apply uSEM in this bottom-up fashion, researchers would use the covariance matrix and SEM software to repeatedly add relations among behaviors (regardless of their direction or timing) to the model until the fit between the model and the covariance matrix is deemed acceptable. Relations specified in the acceptable model would then be interpreted. There are pros and cons to both approaches (for a discussion, see Mellenbergh et al., 2003), and the best approach to use depends on the research goals.
Current Study
The minimal requirements and multiple advantages of uSEM make it ideal for capturing the socio-temporal dynamics underlying observed behavior. To demonstrate this, we applied uSEM to observations of children playing in unstructured same-sex groups in order to reveal time-dependent (lagged and contemporaneous) sex differences in play behavior.
Sex differences in the nature of children’s play are well-known. Girls play in ways characterized by cooperation and affiliation typically centered around domestic themes (reviewed in Blakemore, Berenbaum, & Liben, 2009; Ruble, Martin, & Berenbaum, 2006), and positive affect characterizes affiliative play (Howes, 1988; Lyubomirsky, King, & Diener, 2005). Boys are more active than girls (especially in groups versus dyads) and more likely to engage in physical and rough and tumble play (reviewed in Blakemore et al., 2009; Ruble et al., 2006).
How does one child’s sex differential play behavior unfold over time in relation to the play of his or her peers? This is an important question because the interplay among children’s different behaviors is key to understanding peer interactions in childhood (Degnan et al., 2011; Henderson, Marshall, Fox, & Rubin, 2004), and gendered play has implications for children’s adjustment (DiDonato et al., 2012; Zahn-Waxler, Shirtcliff, & Marceau, 2008). uSEM affords a unique opportunity to address this question.
During same-sex group play sessions, we coded at 10-second intervals two behaviors that have been frequently observed in group play, reported to change across a play session, and shown to influence the dynamics of peer interactions: positive affect and vigor of activity (Howes, 1988; Rubin, Bukowski, & Parker, 2006). We then analyzed the behavioral ratings in three parts.
First, we used group averages to examine sex differences in positive affect and vigor of activity across the play session. This analysis is analogous to those that aggregate based on frequencies or proportions of a behavior observed during a play session, and they are typically used by researchers in this area (e.g., Coplan & Rubin, 1998; Sánchez-Martín et al., 2000). Based on the extant literature (Blakemore et al., 2009; Ruble et al., 2006), we expected to find sex differences, with girls displaying greater positive affect than boys, and boys displaying greater vigor of activity than girls.
Second, we used uSEM to examine sex differences in the socio-temporal dynamics underlying play behavior in groups of children in order to determine whether it provided information about the sex-typed nature of play that was missed by a group averages analysis approach. We used a data-driven application of uSEM because this was the first investigation of the temporal dynamics underlying sex differences in play. Based on the extant literature (Blakemore et al., 2009; Ruble et al., 2006), we expected to find sex differences, with more lagged and contemporaneous relations among groups of girls than groups of boys in positive affect, and more lagged and contemporaneous relations among groups of boys than groups of girls in vigor of activity.
Third, we used uSEM to examine sex differences in the temporal dynamics underlying the individual-level behaviors of children. We used the results of our data-driven application of uSEM to test whether there were sex differences in the number of lagged or contemporaneous relations between each child’s positive affect and vigor of activity. The purpose of this analysis was to demonstrate how uSEM captures intra-individual variation in behavior, so we did not have expectations regarding the direction of effects.
Method
Participants
Participants were 65 children (32 girls) aged 5.6 to 6.8 years (M = 6.2, SD = .30) who were part of a larger, longitudinal study of socioemotional development. Children were mostly White (92% Caucasian, non-Hispanic) and came from middle class families (Hollingshead Index; M = 48.9, SD = 10.5). Mothers of children in the study were married (> 94%) with college educations (M = 16.4 years, SD = 2.4); fathers also had college educations (M = 16.4 years, SD = 2.6). The play behavior of this sample has been previously reported (Buss et al., 2013; Davis & Buss, 2012).
Measures and Procedure
Children participated in a play session with other unfamiliar, same-sex children; the play session was one part of a multi-part laboratory visit. Children were divided into groups of three (N = 4 girl groups; N = 7 boy groups) or four (N = 5 girl groups; N = 3 boy groups), and each group played by themselves in a room that contained coloring books, hula-hoops, a set of bowling pins, jump ropes, and rubber balls. Children were instructed to play however they liked during the videotaped session, which lasted approximately 15 minutes; some play sessions were slightly shortened or extended according to the judgment of the research team.
Positive affect and vigor of activity were rated for each child on a 5-point Likert-type scale for every 10-second interval during the free play session, following Rubin (2001). Ratings for positive affect ranged from 1 (no positive affect shown) to 5 (intense displays of positive affect that lasted for the majority of the epoch); ratings for vigor of activity ranged from 1 (no movement at all) to 5 (high intensity activity that lasted for the majority of the epoch). Two independent coders established initial reliability through training (κ = .63 to .73), then rated each child’s positive affect and vigor of activity for each 10-second interval during the free play session. The number of observations per group ranged from 74 to 98 (M = 89.2, SD = 5.6), and this did not differ by sex, t(17) = .08, p = .93. Coders maintained good reliability (positive affect: κ = .65; vigor of activity: κ = .81), consistent with other work using similar samples and coding schemes (e.g., Kiel & Buss, 2011).
Data Analysis Plan: Group Averages
Positive affect and vigor of activity ratings were averaged across all time points for a child then across all children in a group. These averages were used in conventional statistical tests. As is typical for research in this area (e.g., Coplan & Rubin, 1998; Sánchez-Martín et al., 2000), t-tests were used to compare groups of boys and girls on (1) positive affect and (2) vigor of activity (using independent one-tailed tests with Type I error of .05 because of clear expectations regarding the direction of sex effects on behavior; Maccoby & Jacklin, 1980).
Data Analysis Plan: Unified Structural Equation Model (uSEM)
Relations among children’s positive affect and vigor of activity ratings were determined with uSEM (Kim et al., 2007). For a single “lag” (i.e., rating at the current time point predicting a rating at the next time point, 10 seconds later), uSEM was defined as:
η(t) = Aη(t) + Φ1η(t−1) + ζ(t).
η, is the p-variate time series of coded behaviors at time t = 1, 2, …T; p is the number of behavioral ratings for each play group, and T is the length of the time series (number of 10-second intervals) for each play group. Analysis occurs at the individual level, so p and T differed by play group. In this study, p ranged from 6 to 8 (2 time points per individual multiplied by the number of individuals in the play group), and T ranged from 74 to 98 (number of observations per group). A is the (p,p)-dimension matrix of contemporaneous relations among behaviors; it is the SEM part of the model. Φ1,is the (p,p)-dimension matrix of lag 1 relations among behaviors; it the VAR part of the model.1 ζ is the p-variate error series.
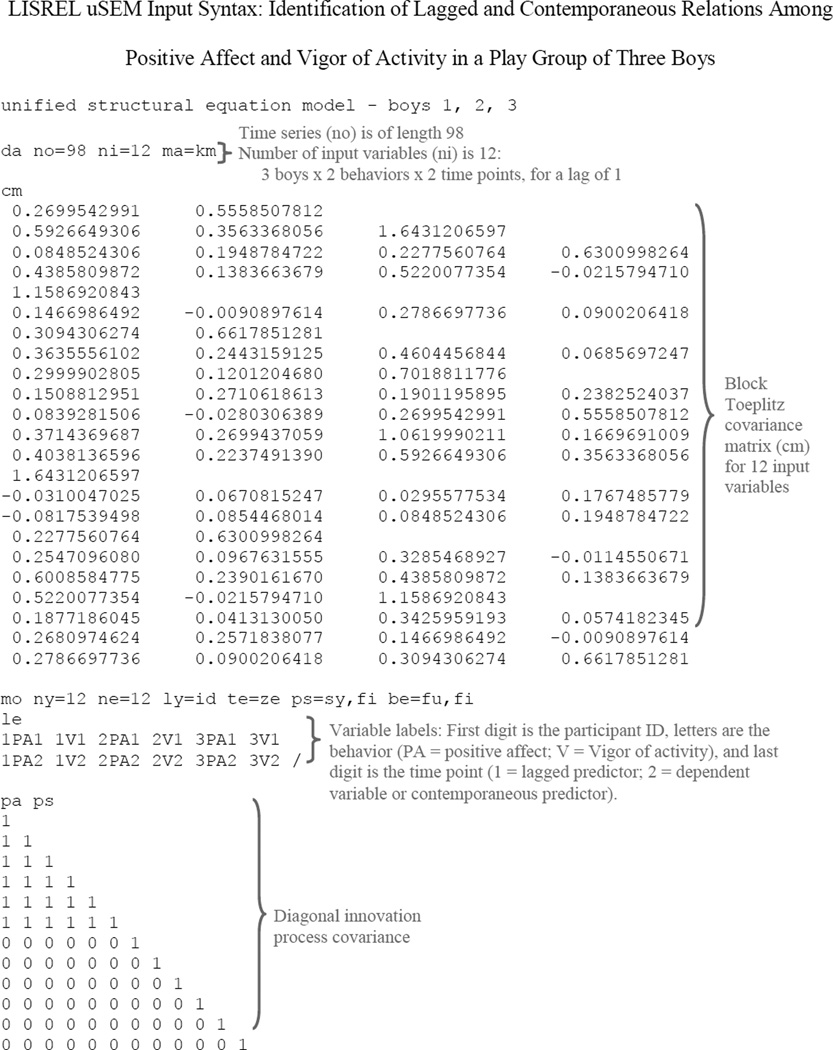
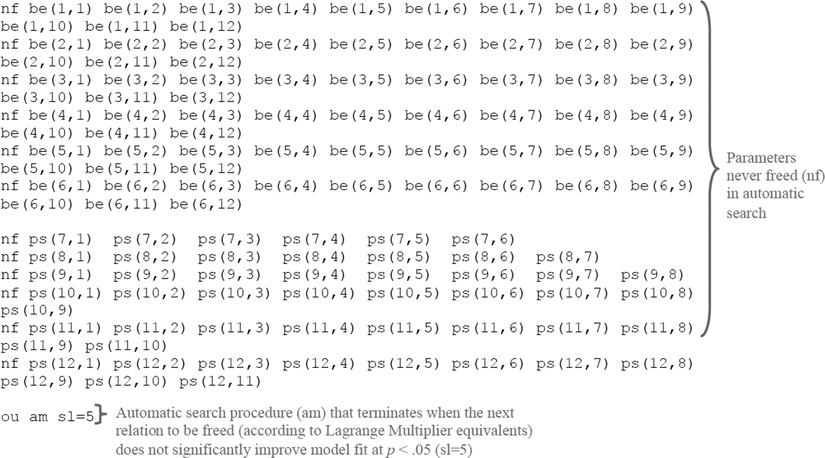
uSEM was programmed into traditional SEM software; LISREL (Jöreskog & Sörbom, 1992) was used because it contains an automatic search procedure (data-driven approach) to model fitting (for a discussion of the automatic search procedure in LISREL applied to uSEM, see Gates et al., 2010).2 LISREL input syntax for a group of three boys is provided in Appendix A (black text); key features of uSEM are annotated in the syntax (gray text).3 In order for the full integration of VAR (autocorrelated data with full innovation process covariance) into SEM, data analysis was carried out on a block Toeplitz covariance matrix (estimated from the raw time series data) with diagonal process covariance (Box, Jenkins, & Reinsel, 2008; Molenaar, 1985). The automatic search procedure in LISREL used Lagrange Multiplier equivalents (i.e., modification indices; Sörbom, 1989) to identify which relation among behavioral ratings in a play group, if freed, optimally improved model fit. The model was then estimated with this relation freed, and the program iterated (i.e., repeated the process of identifying which relation most improved model fit) until no relation, if freed, significantly improved model fit, according to a predetermined alpha level on a chi-square distribution with one degree of freedom; alpha was set to .05.4 After all iterations, relations that became nonsignificant after other relations were freed were removed from the model; thus, all relations were significant at the .05 level in final models. Because the chi-square test does not apply to dependent data (see Molenaar & Nesselroade, 1998), the fit of the final models was assessed with alternative fit indices (found to be reliable in simulation studies; Brown, 2006; Hu & Bentler, 1999; Tucker & Lewis, 1973): confirmatory fit index (CFI) ≥ .95; Tucker-Lewis index (TLI) ≥ .95; standardized root mean square residual (SRMR) ≤ .08; root mean square error of approximation (RMSEA) ≤ .10. Final models had to fit the data excellently according to at least two indices (see, e.g., Beltz et al., 2013).
In order to describe uSEM results in a way that permits their comparison to group average results, we tallied relations among children’s positive affect and vigor of activity that were identified with uSEM. Specifically, we counted the number of times in each final play group model (N = 19) that there were (1) lagged relations among children’s positive affect; (2) lagged relations among children’s vigor of activity; (3) contemporaneous relations among children’s positive affect; (4) contemporaneous relations among children’s vigor of activity. Frequency counts from each group were converted into percentages of relations possible in order to account for differences in group size.5 Percentages were used as dependent variables in a series of t-tests comparing groups of boys and girls on the percent of (1) lagged positive affect relations, (2) lagged vigor of activity relations, (3) contemporaneous positive affect relations, and (4) contemporaneous vigor of activity relations (using independent one-tailed tests with Type I error of .05 because of clear expectations regarding the direction of sex effects on behavior; Maccoby & Jacklin, 1980).
In order to demonstrate the utility of uSEM for capturing intra-individual processes, we tallied within-child relations between positive affect and vigor of activity that were identified with uSEM. Specifically, we counted for each child (N = 65) the number of times that there were (1) lagged relations between the same child’s positive affect and vigor of activity, and (2) contemporaneous relations between the same child’s positive affect and vigor of activity. Frequency counts were converted into percentages of relations possible; for each child, two lagged (positive affect → vigor of activity; vigor of activity → positive affect) and two contemporaneous (positive affect → vigor of activity; vigor of activity → positive affect) relations were possible. Percentages were used as dependent variables in a series of t-tests comparing individual boys and individual girls on the percent of (1) lagged relations between positive affect and vigor of activity, and (2) contemporaneous relations between positive affect and vigor of activity (using independent two-tailed tests with Type I error of .05).
Results
Group Averages
We examined sex differences in group average levels of positive affect and vigor of activity. These analyses were calculated at the level of the play group (N = 19) because multiple children must be present in order for their observed behavior to have implications for understanding social interactions. Consistent with our expectations, girls (M = 1.95, SD = .30) displayed more positive affect than boys (M = 1.64, SD = .39), t(17) = −1.95, p = .03, d = −.89, and there was a trend for boys (M = 2.83, SD = .41) to display more vigor of activity than girls (M = 2.59, SD = .37), t(17) = 1.36, p = .10, d = .61.
Unified Structural Equation Model (uSEM)
Model fits
The final models fit the data well. Eighteen groups had excellent fitting models according to all four alternative fit indices, and one group had an excellent fitting model according to two alternative fit indices. The number of observations varied among groups, but this did not influence the results: The number of observations and the number of relations in final uSEM models were not related, r(17) = −.28, p = .24.
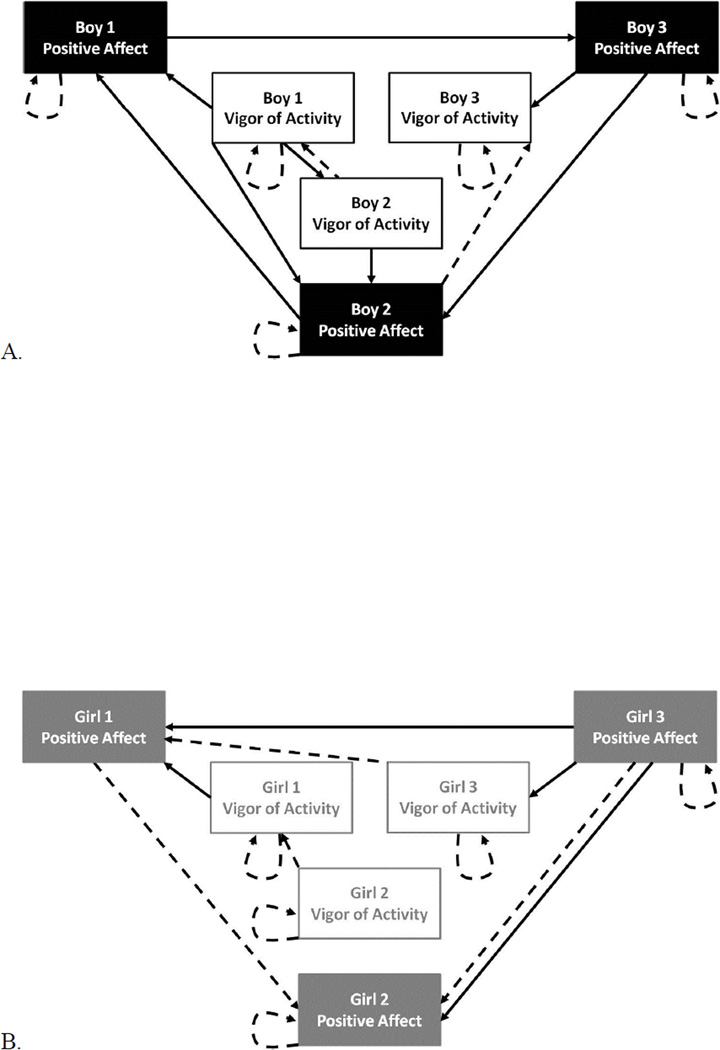
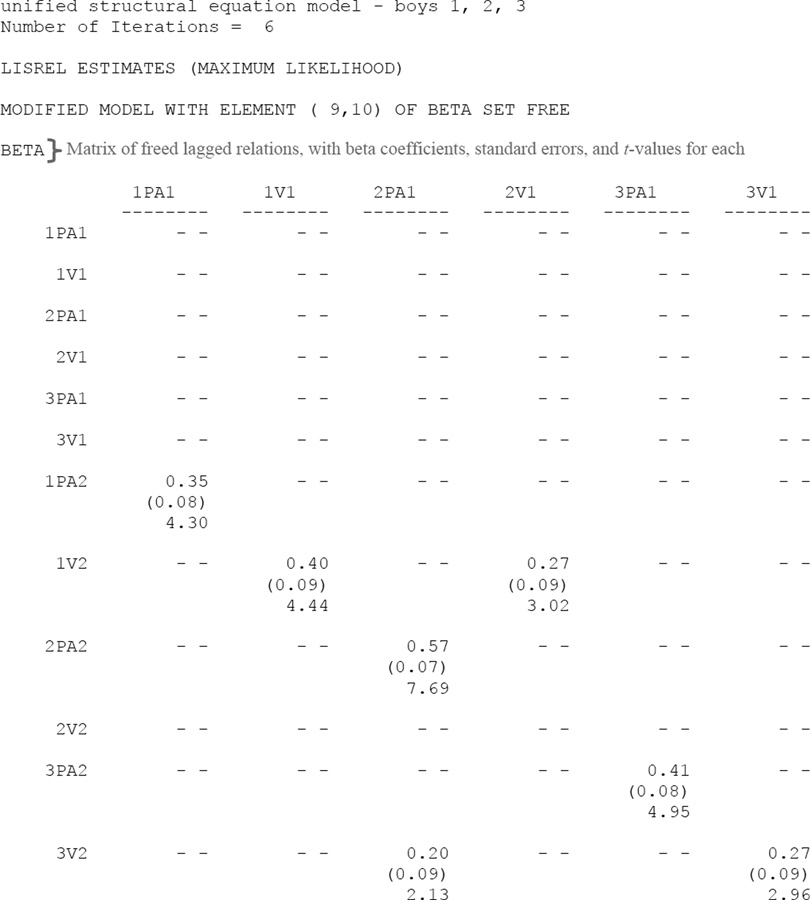
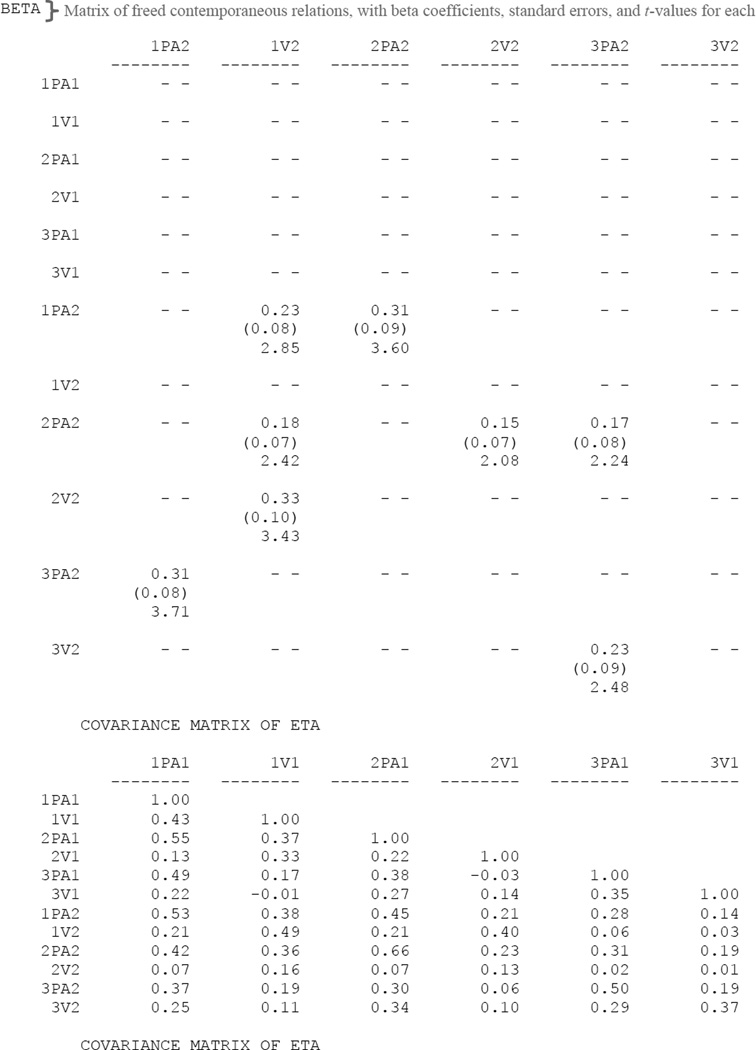
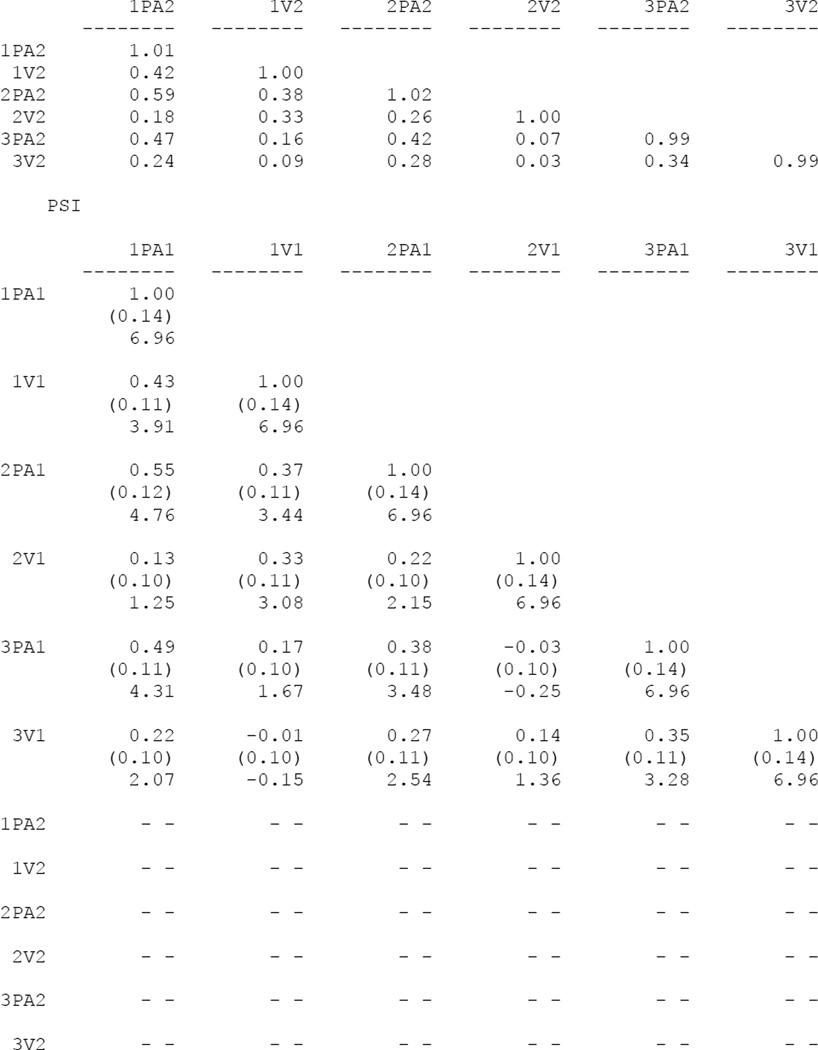
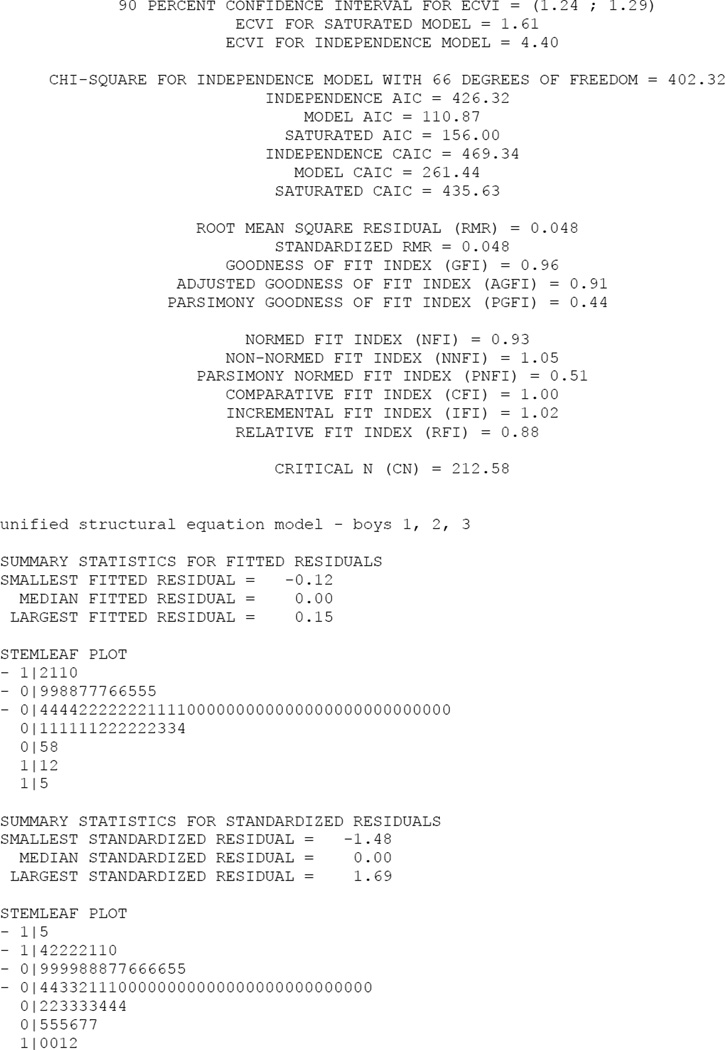
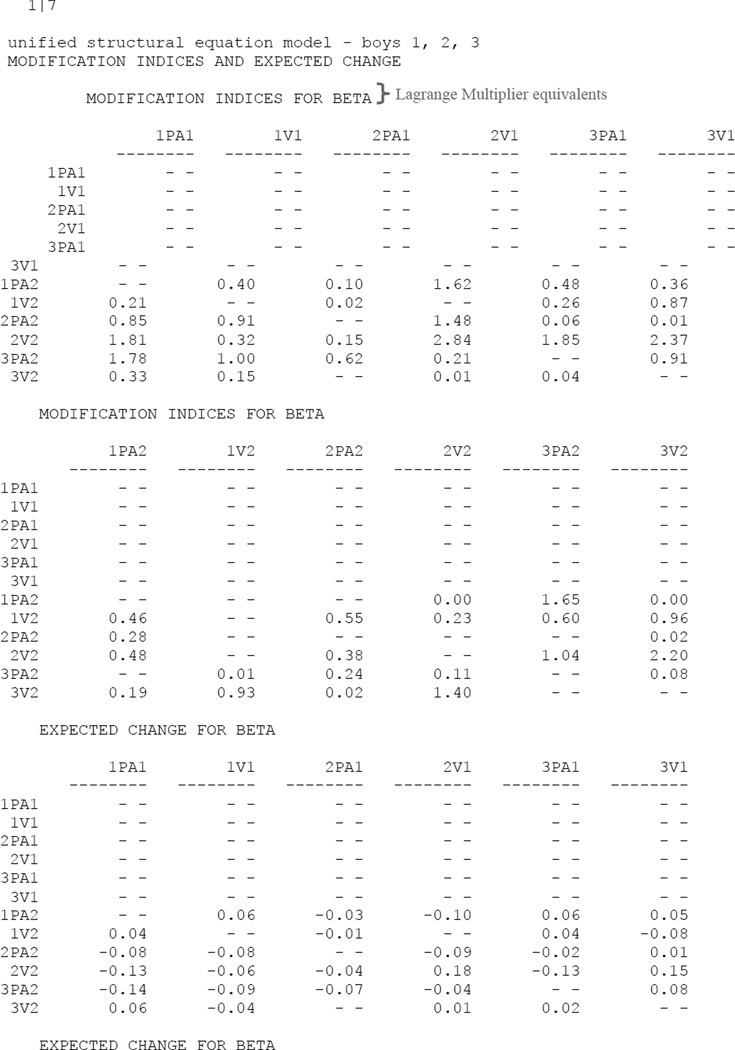
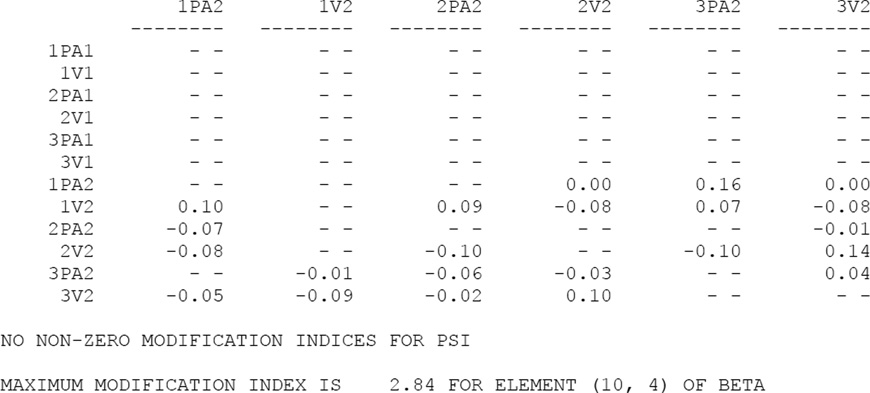
Output results from the final LISREL iteration for a group of three boys (the same group with LISREL input syntax provided in Appendix A) are provided in Appendix B (black text); key features of uSEM are annotated in the output (gray text). The output shows that each behavior of each child is the dependent variable of a regression equation, where the other behaviors are potential predictors (results presented in the BETA matrix), and where there is error (results presented in the PSI matrix).6 The final uSEM model for this group of boys is depicted in Figure 1A. The arrows represent associations (with beta-values in the BETA matrix of the LISREL output). Dashed arrows represent lagged relations, and solid arrows represent contemporaneous relations. Specifically, the arrows represent how variation in one behavior of one child is statistically predicted by variation in another behavior (either the behavior of another child, the previous behavior of the same child, or the second behavior of the same child). For example, Figure 1A shows that the positive affect of boy 1 is explained by the lagged positive affect of boy 1 (his own positive affect from 10 seconds prior), the contemporaneous vigor of activity of boy 1 (his own vigor of activity at the same time point), and the contemporaneous positive affect of boy 2 (the positive affect of boy 2 at the same time point).
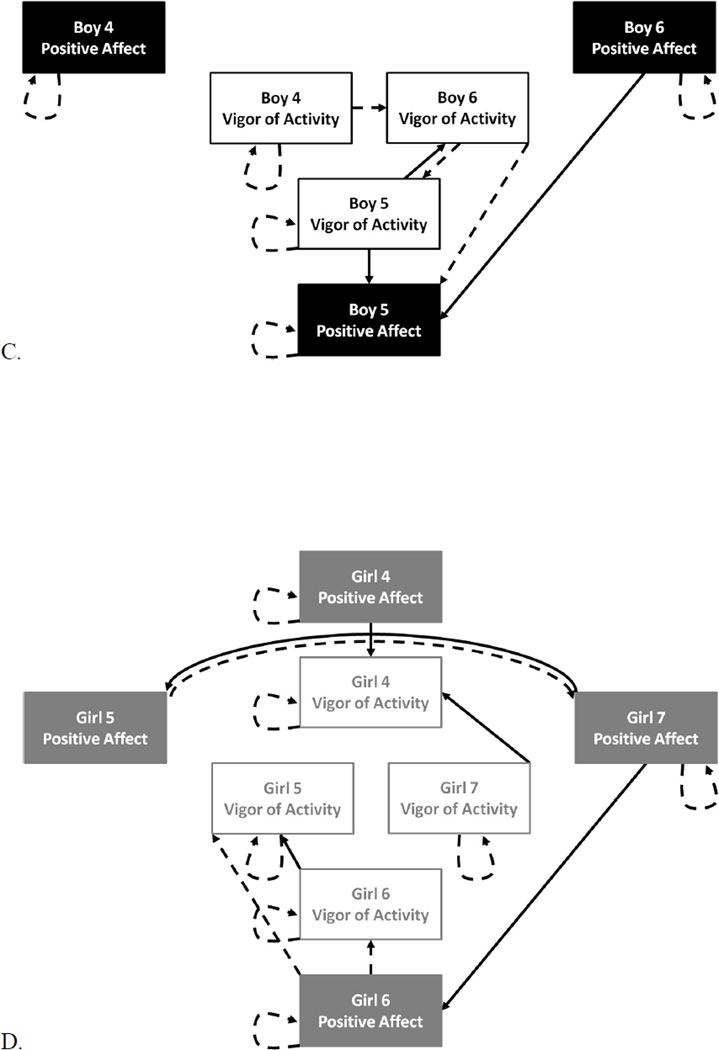
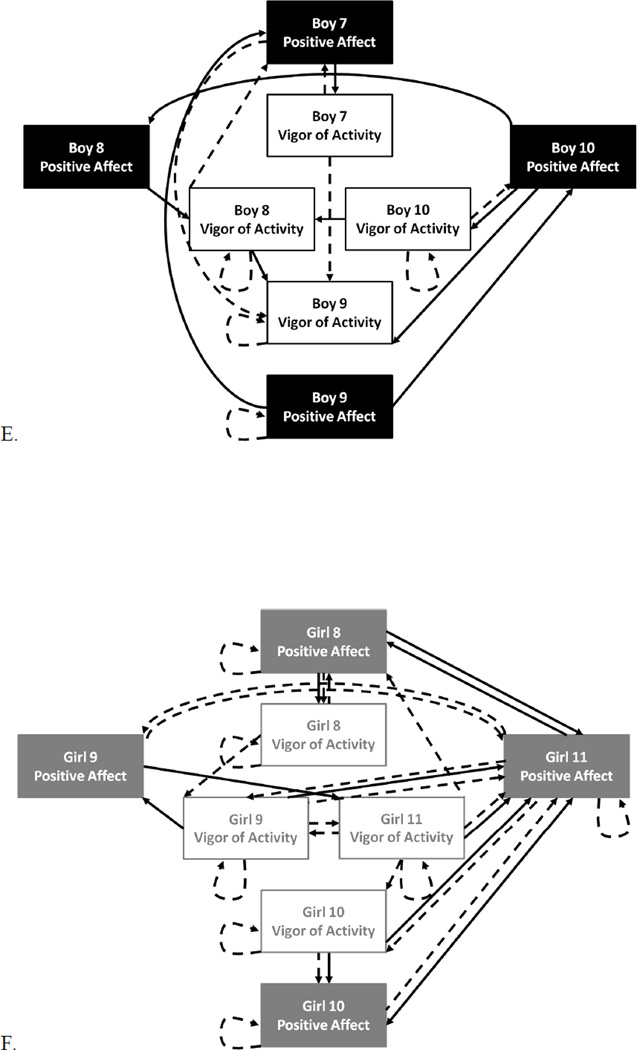
Figure 1.
- χ2(36, N=98) = 26.87, p = .860, CFI=1.00, TLI=1.00, SRMR=.048, RMSEA=.000;
- χ2(37, N=86) = 29.00, p = .820, CFI=1.00, TLI=1.00, SRMR=.055, RMSEA=.000;
- χ2(40, N=91) = 37.10, p = .600, CFI=1.00, TLI=1.00, SRMR=.076, RMSEA=.000;
- χ2(77, N=92) = 64.22, p = .820, CFI=1.00, TLI=1.00, SRMR=.061, RMSEA=.000;
- χ2(73, N=74) = 55.70, p = .930, CFI=1.00, TLI=1.00, SRMR=.061, RMSEA=.000;
- χ2(60, N=87) = 82.22, p = .0300, CFI=.98, TLI=.97, SRMR=.039, RMSEA=.066.
The final uSEM models for five other groups (two groups of boys and three groups of girls) are depicted in Figure 1B–F. These models illustrate the importance of an individual-level approach to the analysis of children’s unstructured group play. Although all five groups had excellent-fitting uSEM models, the differences among them are striking.
Sex differences in temporal dynamics of group-level play behavior
We quantified differences in the final uSEM models by counting the number of lagged positive affect relations, lagged vigor of activity relations, contemporaneous positive affect relations, and contemporaneous vigor of activity relations among children in each final group model (of 19). For example, the group of boys in Figure 1A had 0 lagged positive affect relations, 1 lagged vigor of activity relation, 3 contemporaneous positive affect relations, and 1 contemporaneous vigor of activity relation, whereas the group of girls in Figure 1B had 2 lagged positive affect relations, 1 lagged vigor of activity relation, 2 contemporaneous positive affect relations, and 0 contemporaneous vigor of activity relations. For all groups, we converted frequencies to percentages of relations possible to account for differences in group size.
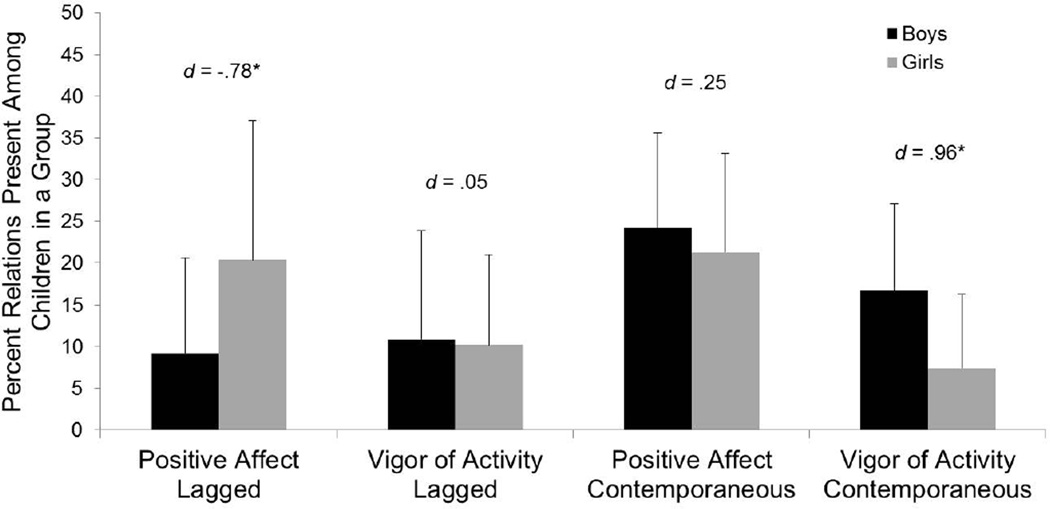
We examined sex differences in the percent lagged and contemporaneous relations for both positive affect and vigor of activity from the final uSEM models. These analyses were conducted at the level of the play group (N = 19) because multiple children must be present in order for links among their behavior to be observed. Girls had more lagged positive affect relations than boys, t(17) = −1.72, p = .05, and boys had more contemporaneous vigor of activity relations than girls, t(17) = 2.08, p = .03. There were no sex differences in lagged vigor of activity relations, t(17) = .12, p = .45, or contemporaneous positive affect relations, t(17) = .54, p = .30. Means, standard deviations, and effect sizes are displayed by sex in Figure 2.
Figure 2.
Sex differences in percent of lagged positive affect, lagged vigor of activity, contemporaneous positive affect, and contemporaneous vigor of activity relations among children in a play group in final uSEM models (N = 19). Error bars depict standard deviations; d’s indicate the effect sizes of the sex differences (Cohen, 1988).
*p < .05, one-tailed.
Sex differences in temporal dynamics of individual-level play behavior
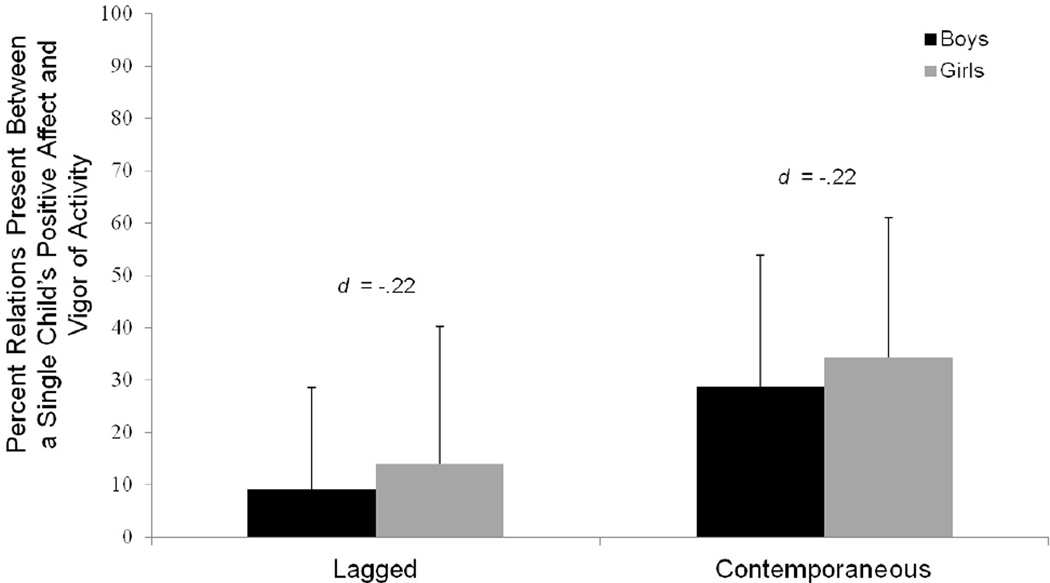
We also quantified differences in the final uSEM models by counting the number of relations between positive affect and vigor of activity in a single child (of 65) that were lagged and contemporaneous. For example, both boy 1 in Figure 1A and girl 1 in Figure 1B had 0 lagged relations between positive affect and vigor of activity and 1 contemporaneous relation between positive affect and vigor of activity. For all children, we converted frequencies to percentages of relations possible.
We examined sex differences in the percent lagged and contemporaneous relations between a single child’s positive affect and vigor of activity from the final uSEM models. These analyses were conducted at the level of the individual child (N = 65) because links among a single child’s behaviors can be observed with or without the presence of other children. There were no significant sex differences in lagged, t(63) = −.87, p = .39, or contemporaneous, t(63) = −.87, p =.39, relations. Means, standard deviations, and effect sizes are displayed by sex in Figure 3.
Figure 3.
Sex differences in percent of lagged relations between positive affect and vigor of activity of a single child, and in percent of contemporaneous relations between positive affect and vigor of activity of a single child in final uSEM models (N = 65). Error bars depict standard deviations; d’s indicate the effect sizes of the sex differences (Cohen, 1988).
Discussion
The temporal dynamics underlying changes in interpersonal behavior can be uniquely captured with uSEM; it affords a person-centered approach to the analysis of observational data coded repeatedly across time. Application of uSEM to ratings of positive affect and vigor of activity during children’s unstructured same-sex group play provided unique insight into the socio-temporal dynamics underlying sex differences in behavior.
Expectations regarding sex differences in play were partially confirmed with respect to the positive affect of girls. Traditional group averages showed that girls displayed greater positive affect than boys, and findings from uSEM showed that (lagged) time is a significant sex differential characteristic of girls’ positive affect. Thus, uSEM provided additional insight into the sex difference in positive affect by capturing its time-dependent nature. The positive affect of girls was predicted by the prior (10 seconds before) positive affect of their peers. This is consistent with evidence for greater emotional contagion and co-rumination (leading to higher levels of depression) in girls compared to boys (McLaughlin & Nolen-Hoeksema, 2011; Rose, 2002); the shared affect of girls is time-dependent.
Expectations regarding sex differences in play were partially confirmed with respect to the vigor of activity of boys. Traditional group averages did not show a significant sex difference in vigor of activity, but findings from uSEM showed that boys displayed more contemporaneous relations among vigor of activity than girls. Thus, uSEM revealed a sex difference that traditional analyses did not. This finding is methodologically consistent with past work on uSEM, demonstrating that both lagged and contemporaneous relations must be included in the same model in order to attain accurate parameter estimates (Gates et al., 2010; Kim et al., 2007). This finding is conceptually consistent with past work on same-sex play, highlighting a greater role for activity level in the play of boys than in the play of girls (Fabes, Martin, & Hanish, 2003; Fabes et al., 1997).
uSEM also afforded an examination of sex differences in the temporal links between a single child’s positive affect and vigor of activity. No significant effects were found, suggesting that positive affect and vigor of activity are related similarly (across time) within individual boys and individual girls. Nonetheless, this examination illustrated how uSEM can be used to extract context-dependent, individual-level results from social interaction data.
uSEM is a domain-general approach (relevant for time series data analysis across psychological and developmental science) to analyzing observations of social interactions that captures the wealth of information provided by these data, but there are considerations to be made before applying it. First, there are other analysis approaches to social interaction data that – like uSEM – move beyond group averages (e.g., Bakeman & Gottman, 1997; Ferrer & Nesselroade, 2003; Hoffman, 2007; Hoffman & Stawski, 2009; Hsieh et al., 2010; Lewis et al., 1999; Ram & Grimm, 2007; Snyder et al., 2004). Developmental scientists should carefully consider their research question and the implications of each approach before selecting one. Second, as implemented here, uSEM is a data-driven analysis technique, but uSEM can also be applied as a hypothesis-driven analysis technique; this will be a fruitful area for future research. Third, it is challenging to draw broad conclusions from person-centered analysis results. In this paper, we counted the frequency of connections within groups and individuals in order to make comparisons to traditional group averaging approaches (i.e., t-tests), but there are other ways to utilize uSEM results. For example, individual-level parameters (e.g., beta-weights) could be used in additional analyses. Fourth, time-invariant and time-varying moderators can be added to the uSEM model (see Gates, Molenaar, Hillary, & Slobounov, 2011). For instance, changes in positive affect and vigor of activity due to temperament (a time-invariant moderator) could be examined.
In conclusion, uSEM can be applied to observational data on interpersonal interactions in order to capture the temporal dynamics underlying behavioral changes during those interactions; this approach could provide particular insight to developmental science if it were used to reanalyze data that were initially analyzed using traditional group average approaches. For example, uSEM could be used to address the influence of the disruptive behavior of a single child on other children in a classroom (and vice versa; Bierman et al., 2004). It could also be used to examine whether depressed mothers’ communication with their children has instantaneous or time-delayed influences on children’s emotion regulation (Feng et al., 2008). Developmental research is rich with observational data on social interactions, and uSEM has the potential to capitalize on this wealth for the good of the science.
Acknowledgments
This research was supported in part by National Institutes of Health Grant MH075750 to K. Buss. K. Buss faculty position is, in part, supported by the Children, Youth and Family Consortium at The Pennsylvania State University. Some of the data reported in this manuscript were presented at the 2012 Society for Research in Child Development – Developmental Methodology Themed Meeting. We thank the staff and students of the Emotion Development Lab in the Child Study Center who contributed to this work. We also thank the participants and their families.
Appendix A
LISREL uSEM Input Syntax: Identification of Lagged and Contemporaneous Relations Among Positive Affect and Vigor of Activity in a Play Group of Three Boys
Appendix B
LISREL uSEM Results Output: Final Iteration from Input Syntax (Appendix A)
Footnotes
Additional terms can be added to the VAR part of the model in order to examine lags beyond order 1. For example, a uSEM model with contemporaneous relations and lagged relations of order 3 would be defined as: η(t) = Aη(t) + Φ1η(t−1) + Φ2η(t−2) + Φ3η(t−3) + ζ(t).
Although traditional SEM is not appropriate for autocorrelated data, simulation studies have shown that the approach used by uSEM to estimate contemporaneous relations yields parameter values close to those obtained with the genuine maximum likelihood method (e.g., Hamaker, Dolan, & Molenaar, 2005).
To modify the LISREL input syntax in Appendix A for hypothesis-driven testing, remove the automatic search procedure command (am) from the output line and specify which relations among behaviors should be freed (1) in the BETA matrix.
Criteria other than significant model improvement at an alpha of .05 can be used to terminate the automatic search procedure in LISREL. For example, alpha can be set to a more (e.g., .01) or less (e.g., .10) stringent level than .05. Moreover, model fit indices can be used; the model accepted as final could be the first model iteration in which two alternative fit indices indicate excellent fit (according to Brown, 2006; Hu & Bentler, 1999; Tucker & Lewis, 1973).
The percent of relations possible among children’s lagged positive affect, lagged vigor of activity, contemporaneous positive affect, and contemporaneous vigor of activity differed for groups of size three versus groups of size four. In each group, there were n(n – 1) relations possible, where n is group size.
For example, the equation explaining the time series of the positive affect of boy 1 (i.e., 1PA2) is: 1PA2 = .35*1PA1 + .23*1V2 + .31*2PA2 + .53.
Contributor Information
Adriene M. Beltz, Department of Psychology, The Pennsylvania State University
Charles Beekman, Department of Psychology, The Pennsylvania State University.
Peter C. M. Molenaar, Departments of Human Development and Family Studies and Psychology, The Pennsylvania State University
Kristin A. Buss, Department of Psychology, The Pennsylvania State University
References
- Bakeman R, Gottman JM. Observing inter-action: An introduction to sequential analysis. 2nd ed. New York: Cambridge University Press; 1997. [Google Scholar]
- Bakeman R, Quera V. Behavioral observation. In: Cooper H, editor. APA handbook of research methods in psychology: Vol. 1: Foundations, planning, methods, and psychometrics. Washington D.C.: American Psychological Association; 2012. [Google Scholar]
- Beltz AM, Gates KM, Engels AS, Molenaar PCM, Pulido C, Turrisi R, et al. Changes in alcohol-related brain networks across the first year of college: A prospective pilot study using fMRI connectivity mapping. Addictive Behaviors. 2013;38:2052–2059. doi: 10.1016/j.addbeh.2012.12.023. [DOI] [PMC free article] [PubMed] [Google Scholar]
- Bierman KL, Coie JD, Dodge KA, Foster EM, Greenberg MT, Lochman JE, et al. The effects of the fast track program on serious problem outcomes at the end of elementary school. Journal of Clinical Child and Adolescent Psychology. 2004;33(4):650–661. doi: 10.1207/s15374424jccp3304_1. [DOI] [PMC free article] [PubMed] [Google Scholar]
- Blakemore JEO, Berenbaum SA, Liben LS. Gender development. New York: Psychology Press / Taylor & Francis; 2009. [Google Scholar]
- Borgatti SP, Mehra A, Brass DJ, Labianca G. Network analysis in the social sciences. Science. 2009;323(5916):892–895. doi: 10.1126/science.1165821. [DOI] [PubMed] [Google Scholar]
- Borsboom D, Cramer AOJ, Schmittmann VD, Epskamp S, Waldorp LJ. The small world of psychopathology. PLoS ONE. 2011;6(11):e27407. doi: 10.1371/journal.pone.0027407. [DOI] [PMC free article] [PubMed] [Google Scholar]
- Box GEP, Jenkins GM, Reinsel GC. Time series analysis: Forecasting and control. 4th ed. Hoboken, NJ: John Wiley & Sons, Inc.; 2008. [Google Scholar]
- Brown TA. Confirmatory factor analysis for applied research. New York: Guilford Press; 2006. [Google Scholar]
- Buss KA, Davis EL, Kiel EJ, Brooker RJ, Beekman C, Early MC. Dysregulated fear predicts social wariness and social anxiety symptoms during kindergarten. Journal of Clinical Child and Adolescent Psychology. 2013 doi: 10.1080/15374416.2013.769170. [DOI] [PMC free article] [PubMed] [Google Scholar]
- Cohen J. Statistical power analysis for the behavioral sciences. 2nd ed. New York: Academic Press; 1988. [Google Scholar]
- Coplan RJ, Rubin KH. Exploring and assessing nonsocial play in the preschool: The development and validation of the preschool play behavior scale. Social Development. 1998;7(1):72–91. [Google Scholar]
- Davis EL, Buss KA. Moderators of the relation between shyness and behavior with peers: Cortisol dysregulation and maternal emotion socialization. Social Development. 2012;21(4):801–820. doi: 10.1111/j.1467-9507.2011.00654.x. [DOI] [PMC free article] [PubMed] [Google Scholar]
- Degnan KA, Hane AA, Henderson HA, Moas OL, Reeb-Sutherland BC, Fox NA. Longitudinal stability of temperamental exuberance and social-emotional outcomes in early childhood. Developmental Psychology. 2011;47(3):765–780. doi: 10.1037/a0021316. [DOI] [PMC free article] [PubMed] [Google Scholar]
- DiDonato MD, Martin CL, Hessler EE, Amazeen PG, Hanish LD, Fabes RA. Gender consistency and flexibility: Using dynamics to understand the relationship between gender and adjustment. Nonlinear Dynamics, Psychology, and Life Sciences. 2012;16(2):159–184. [PubMed] [Google Scholar]
- Dishion TJ, Snyder J. An introduction to the special issue on advances in process and dynamic system analysis of social interaction and the development of antisocial behavior. Journal of Abnormal Child Psychology. 2004;32(6):575–578. doi: 10.1023/b:jacp.0000047317.96104.ca. [DOI] [PubMed] [Google Scholar]
- Dishion TJ, Tipsord JM. Peer contagion in child and adolescent social and emotional development. In: Fiske ST, Schacter DL, Taylor SE, editors. Annual Review of Psychology. Vol. 62. 2011. pp. 189–214. [DOI] [PMC free article] [PubMed] [Google Scholar]
- Fabes RA, Martin CL, Hanish LD. Young children's play qualities in same-, other-, and mixed-sex peer groups. Child Development. 2003;74(3):921–932. doi: 10.1111/1467-8624.00576. [DOI] [PubMed] [Google Scholar]
- Fabes RA, Shepard SA, Guthrie IK, Martin CL. Roles of temperamental arousal and gender-segregated play in young children's social adjustment. Developmental Psychology. 1997;33(4):693–702. doi: 10.1037//0012-1649.33.4.693. [DOI] [PubMed] [Google Scholar]
- Feng X, Shaw DS, Kovacs M, Lane T, O'Rourke FE, Alarcon JH. Emotion regulation in preschoolers: The roles of behavioral inhibition, maternal affective behavior, and maternal depression. Journal of Child Psychology and Psychiatry. 2008;49(2):132–141. doi: 10.1111/j.1469-7610.2007.01828.x. [DOI] [PubMed] [Google Scholar]
- Ferrer E, Nesselroade JR. Modeling affective processes in dyadic relations via dynamic factor analysis. Emotion. 2003;3(4):344–360. doi: 10.1037/1528-3542.3.4.344. [DOI] [PubMed] [Google Scholar]
- Gates KM, Molenaar PC, Hillary FG, Ram N, Rovine MJ. Automatic search for fMRI connectivity mapping: an alternative to Granger causality testing using formal equivalences among SEM path modeling, VAR, and unified SEM. Neuroimage. 2010;50(3):1118–1125. doi: 10.1016/j.neuroimage.2009.12.117. [DOI] [PubMed] [Google Scholar]
- Gates KM, Molenaar PCM, Hillary FG, Slobounov S. Extended unified SEM approach for modeling event-related fMRI data. NeuroImage. 2011;54(2):1151–1158. doi: 10.1016/j.neuroimage.2010.08.051. [DOI] [PubMed] [Google Scholar]
- Hamaker EL, Dolan CV, Molenaar PCM. Statistical modeling of the individual: Rationale and application of multivariate stationary time series analysis. Multivariate Behavioral Research. 2005;40(2):207–233. doi: 10.1207/s15327906mbr4002_3. [DOI] [PubMed] [Google Scholar]
- Henderson HA, Marshall PJ, Fox NA, Rubin KH. Psychophysiological and behavioral evidence for varying forms and functions of nonsocial behavior in preschoolers. Child Development. 2004;75(1):251–263. doi: 10.1111/j.1467-8624.2004.00667.x. [DOI] [PubMed] [Google Scholar]
- Hoffman L. Multilevel models for examining individual differences in within-person variation and covariation over time. Multivariate Behavioral Research. 2007;42(4):609–629. [Google Scholar]
- Hoffman L, Stawski RS. Persons as contexts: Evaluating between-person and within-person effects in longitudinal analysis. Research in Human Development. 2009;6(2–3):97–120. [Google Scholar]
- Howes C. Peer interaction of young children. Monographs of the Society for Research in Child Development. 1988;53(217) [Google Scholar]
- Hsieh FS, Ferrer E, Chen SC, Chow SM. Exploring the dynamics of dyadic interactions via hierarchical segmentation. Psychometrika. 2010;75(2):351–372. [Google Scholar]
- Hu LT, Bentler PM. Cutoff criteria for fit indexes in covariance structure analysis: Conventional criteria versus new alternatives. Structural Equation Modeling: A Multidisciplinary Journal. 1999;6(1):1–55. [Google Scholar]
- Jöreskog KG, Sörbom D. LISREL: Scientific Software International, Inc.; 1992. [Google Scholar]
- Kiel EJ, Buss KA. Prospective relations among fearful temperament, protective parenting, and social withdrawal: The role of maternal accuracy in a moderated mediation framework. Journal of Abnormal Child Psychology. 2011;39(7):953–966. doi: 10.1007/s10802-011-9516-4. [DOI] [PMC free article] [PubMed] [Google Scholar]
- Kim J, Zhu W, Chang L, Bentler PM, Ernst T. Unified structural equation modeling approach for the analysis of multisubject, multivariate functional MRI data. Human Brain Mapping. 2007;28(2):85–93. doi: 10.1002/hbm.20259. [DOI] [PMC free article] [PubMed] [Google Scholar]
- Lewis MD, Lamey AV, Douglas L. A new dynamic systems method for the analysis of early socioemotional development. Developmental Science. 1999;2(4):457–475. [Google Scholar]
- Lyubomirsky S, King L, Diener E. The benefits of frequent positive affect: Does happiness lead to success? Psychological Bulletin. 2005;131(6):803–855. doi: 10.1037/0033-2909.131.6.803. [DOI] [PubMed] [Google Scholar]
- Maccoby EE, Jacklin CN. Sex differences in aggression: A rejoinder and reprise. Child Development. 1980;51(4):964–980. [PubMed] [Google Scholar]
- Martin CL, Fabes RA, Hanish LD, Holleristein T. Social dynamics in the preschool. Developmental Review. 2005;25(3–4):299–327. [Google Scholar]
- McLaughlin K, Nolen-Hoeksema S. The role of rumination in promoting and preventing depression in adolescent girls. In: Strauman TJ, Costanzo PR, Garber J, editors. Depression in adolescent girls: Science and prevention. New York: Guilford Press; 2011. pp. 112–129. [Google Scholar]
- Mellenbergh GJ, Ader HJ, Baird D, Berger MPF, Cornell JE, Hagenaars JAP, et al. Conceptual issues of research methodology for the behavioural, life and social sciences. Journal of the Royal Statistical Society Series D - The Statistician. 2003;52:211–218. [Google Scholar]
- Meunier JC, Boyle M, O'Connor TG, Jenkins JM. Multilevel mediation: Cumulative contextual risk, maternal differential treatment, and children's behavior within families. Child Development. 2013 doi: 10.1111/cdev.12066. [DOI] [PubMed] [Google Scholar]
- Molenaar PCM. A dynamic factor model for the analysis of multivariate time series. Psychometrika. 1985;50(2):181–202. [Google Scholar]
- Molenaar PCM. A manifesto on psychology as idiographic science: Bringing the person back into scientific psychology, this time forever. Measurement. 2004;2(4):201–218. [Google Scholar]
- Molenaar PCM, Campbell CG. The new person-specific paradigm in psychology. Current Directions in Psychological Science. 2009;18(2):112–117. [Google Scholar]
- Molenaar PCM, Nesselroade JR. A comparison of pseudo-maximum likelihood and asymptotically distribution-free dynamic factor analysis parameter estimation in fitting covariance-structure models to block-Toeplitz matrices representing single-subject multivariate time-series. Multivariate Behavioral Research. 1998;33(3):313–342. doi: 10.1207/s15327906mbr3303_1. [DOI] [PubMed] [Google Scholar]
- Pellegrini AD. Elementary-school children's rough-and-tumble play and social competence. Developmental Psychology. 1988;24(6):802–806. [Google Scholar]
- Perkins KA, Gerlach D, Vender J, Grobe J, Meeker J, Hutchinson S. Sex differences in the subjective and reinforcing effects of visual and olfactory cigarette smoke stimuli. Nicotine & Tobacco Research. 2001;3:141–150. doi: 10.1080/14622200110043059. [DOI] [PubMed] [Google Scholar]
- Ram N, Grimm K. Using simple and complex growth models change: Matching theory to articulate developmental to method. International Journal of Behavioral Development. 2007;31(4):303–316. [Google Scholar]
- Rose AJ. Co-rumination in the friendships of girls and boys. Child Development. 2002;73(6):1830–1843. doi: 10.1111/1467-8624.00509. [DOI] [PubMed] [Google Scholar]
- Rubin KH, Bukowski W, Parker J. Peer interactions, relationships, and groups. In: Eisenberg N, editor. Handbook of child psychology: Vol 3: Social, emotional, and personality development. 6th ed. New York: Wiley; 2006. pp. 571–645. [Google Scholar]
- Ruble DN, Martin CL, Berenbaum SA. Gender development. In: Eisenberg N, editor. Handbook of child psychology: Vol 3: Social, emotional, and personality development. 6th ed. New York: Wiley; 2006. pp. 858–932. [Google Scholar]
- Sánchez-Martín JR, Fano E, Ahedo L, Cardas J, Brain PF, Azpíroz A. Relating testosterone levels and free play social behavior in male and female preschool children. Psychoneuroendocrinology. 2000;25(8):773–783. doi: 10.1016/s0306-4530(00)00025-1. [DOI] [PubMed] [Google Scholar]
- Smith SM, Miller KL, Salimi-Khorshidi G, Webster M, Beckmann CF, Nichols TE, et al. Network modelling methods for fMRI. NeuroImage. 2011;54(2):875–891. doi: 10.1016/j.neuroimage.2010.08.063. [DOI] [PubMed] [Google Scholar]
- Snyder J, Prichard J, Schrepferman L, Patrick MR, Stoolmiller M. Child impulsiveness-inattention, early peer experiences, and the development of early onset conduct problems. Journal of Abnormal Child Psychology. 2004;32(6):579–594. doi: 10.1023/b:jacp.0000047208.23845.64. [DOI] [PubMed] [Google Scholar]
- Sörbom D. Model modificiation. Psychometrika. 1989;54(3):371–384. [Google Scholar]
- Sporns O. Networks of the brain. Cambridge, MA: MIT Press; 2011. [Google Scholar]
- Tucker LR, Lewis C. Reliability coefficient for maximum likelihood factor analysis. Psychometrika. 1973;38(1):1–10. [Google Scholar]
- Zahn-Waxler C, Shirtcliff EA, Marceau K. Disorders of childhood and adolescence: Gender and psychopathology. Annual Review of Clinical Psychology. 2008;Vol. 4:275–303. doi: 10.1146/annurev.clinpsy.3.022806.091358. [DOI] [PubMed] [Google Scholar]


