Abstract
The neural response to touch stimuli is influenced by skin properties as well as the delivery of stimuli. Here, we compare stimuli controlled by displacement and force, and analyze the impact on firing rates of slowly adapting type I afferents as skin thickness and elasticity change. Uniaxial compression tests were used to measure the mechanical properties of mouse hind limb skin (n=5), resulting in a range of skin thickness measurements (211.6–530.6 μm) and hyper- and visco-elastic properties (average coefficient of variation=0.27).Values were integrated to an axisymmetric finite element model using an Ogden strain energy function. This calculated the propagation of surface loads to tactile end-organ locations, where maximum compressive stress and its rate were sampled and linearly regressed to firing rate. For the observed range of skin thickness, firing response was predicted under both force and displacement control of a ramp-and-hold stimulus. Over the ramp phase of stimulation, the variance in predicted firing rate was higher under displacement than under force control (22.2versus 4.9 Hz) with a similar trend in the sustained phase of stimulation (4.6versus1.3Hz). Given that skin thickness varies significantly between specimens, for human skin perhaps seven more so than for mice, the use of force control is predicted to decrease experimental variance in neurophysiological and psychophysical responses.
Keywords: Tactile, touch, mechanoreceptor, somatosensory afferent, biomechanics, finite element analysis, neurophysiology, skin mechanics, compression
1 Introduction
Our tactile perception of spatial curves, edges, and varying stimulus magnitudes is essential to daily interactions. In mammals, these functions are supported by four classes of mechanosensitive afferents, including slowly adapting type I (SAI) afferents which innervate Merkel cell-neurite complexes [1], [2]. Tactile perception is typically studied at one of two levels: neurophysiological recordings of action potentials from single afferents and psychophysical experiments of human perception that measure stimulus thresholds and difference discrimination[3]. To close the gap between these two levels, modeling efforts have sought to mimic skin mechanics as well as neuronal dynamics.
Spanning neurophysiological and psychophysical experiments as well as modeling efforts, the indentation of mechanical stimuli into the skin has been controlled both by displacement and force. A review of the literature reveals that psychophysical experiments generally use force control, whether considering grating orientation [4] sphere size [5], or spatial anisotropy [6]. There are two potential reasons for this preference. First, investigations of grasp [7] indicate that people systematically control their load and grip forces during dexterous manipulation. Second, during active touch, it is much easier to control one’s applied force than displacement, especially when visual cues are eliminated. By contrast, displacement control is typically used in modeling studies of skin mechanics, including continuum mechanics [8], [9] and finite element models [10–12]. This may be due to the fact that most validate to surface deflection [13], based on experiments that used prescribed displacements. In the case of neurophysiological studies, the modes of control have been employed about equally, with displacement [14], [15] and force [16], [17] used in both animal and human studies.
The impact of stimulus delivery on variability of neural and behavioral responses has not been previously considered. At the same time, we know that the skin’s mechanical properties vary not only with age[18–20], but also intuitively with size, weight, and occupation. Given such variance, we hypothesize that stimulus control by force might better equalize between-subject responses. Specifically, if skin thickness changes while elasticity remains the same, a displacement-controlled stimulus might generate much greater local stresses in thinner skin due to greater strain exerted at the skin’s surface. Such understanding is relevant in the design of the next generation of tactile interfaces [21].
This study examines, informed by compressive measurements of mouse skin and use of solid mechanics models, the predicted variation of firing rate of SAI afferents under stimulus control by both displacement and force. First, using uniaxial compression, we measured the skin’s thickness and hyper-viscoelasticity for five skin samples to determine the variation in properties. Second, we built and validated a numerical model (with finite elements to represent skin and an empirically fitted equation for neural firing) for a single SAI afferent to predict firing rates. Third, we performed exploratory numerical experiments whereby the skin thickness in the model was varied over the measured range to determine its impact on predicted firing rate under both modes of control.
2 Methods
2.1 Mouse Skin Measurements
Animals and dissection
All animal use was conducted according to the National Institutes of Health Guide for the Care and Use of Laboratory Animals and was approved by the Institutional Animal Care and Use Committee of Columbia University. Animal preparation and dissection was performed as previously reported[14]. Five skin samples were harvested from a total of four mice (Table 1), and numbered as #0 for model fitting and validation, #1–#4 for simulation. Once a skin specimen from the mouse hind limb was dissected, skin punches were obtained using 6-mm diameter punch (Acuderm Inc., Ft. Lauderdale, FL) at sampling sites on the hind limb as these sites contain tactile end organs.
Table 1.
Material parameters of the different skin specimens, as well as Sylgard and nylon in skin-nerve preparation.
| Material | Age (days) | Thickness (μm) | Hyper-elastic (Instantaneous) | Visco-elastic (Prony series) | ||
|---|---|---|---|---|---|---|
| Type | Parameters | τ values | g values | |||
| Skin #0 | 101 | 325.80 | 1st order Ogden | μ1=9188.5 Pa, α1=16.88 | τ1=0.16 s, τ2=2.14 s | g1=0.70, g2=0.15 |
| Nylon | - | 338.80 | 1storder Ogden | μ1=42368 Pa, α1=9.00 | τ1=0.25 s, τ2=5.00 s | g1=0.48, g2=0.02 |
| Sylgard | - | 10134.8 | Neo-Hookean | C10=105169Pa | τ1=0.7 | g1=0.03 |
| Skin #1 | 101 | 211.57 | 1storder Ogden | μ1=9188.5 Pa, α1=16.49 | τ1=0.09 s, τ2=0.73 s | g1=0.68, g2=0.25 |
| Skin #2 | 111 | 341.67 | 1storder Ogden | μ1=9188.5 Pa, α1=15.83 | τ1=0.11 s, τ2=1.13 s | g1=0.61, g2=0.17 |
| Skin #3 | 240 | 454.01 | 1storder Ogden | μ1=9188.5 Pa, α1=15.04 | τ1=0.02 s, τ2=0.33 s | g1=0.65, g2=0.20 |
| Skin #4 | 228 | 530.60 | 1storder Ogden | μ1=9188.5 Pa, α1=15.85 | τ1=0.11 s, τ2=1.58 s | g1=0.64, g2=0.11 |
Apparatus
A custom-built test machine was used to perform uniaxial compression tests of skin samples (Figure 1). Overall, the test instrumentation consisted of a vertically oriented load sled with a tip, whose position was tracked by a laser and force by a load cell. The compression tip was an aluminum plate, 3 mm thick and 2.54 cm diameter, connected by a rod to the load cell (Honeywell, Miniature Model 31, Columbus, OH) with full capacity of 2.45 N. The load cell was mounted to the motion controlled sled (motion controller: Newport, Model ESP300, Mountain View, CA; linear stage: Newport, Model ILS100). The tip compressed the skin specimens against a rigid plate parallel to the plate tip’s surface. A laser displacement sensor (optoNCDT Model ILD 1402, Micro-Epsilon, Raleigh, NC) measured displacement of the controlled movements, with resolution of 1 μm. Two classes of data were logged: force at the compression tip by the load cell and position from the laser sensor, both at a 1kHz sampling frequency. A closed-loop temperature system was integrated to control the temperature of the rigid plate using BASIC Stamp microcontroller module (Parallax Inc., Rocklin, CA).
Figure 1.
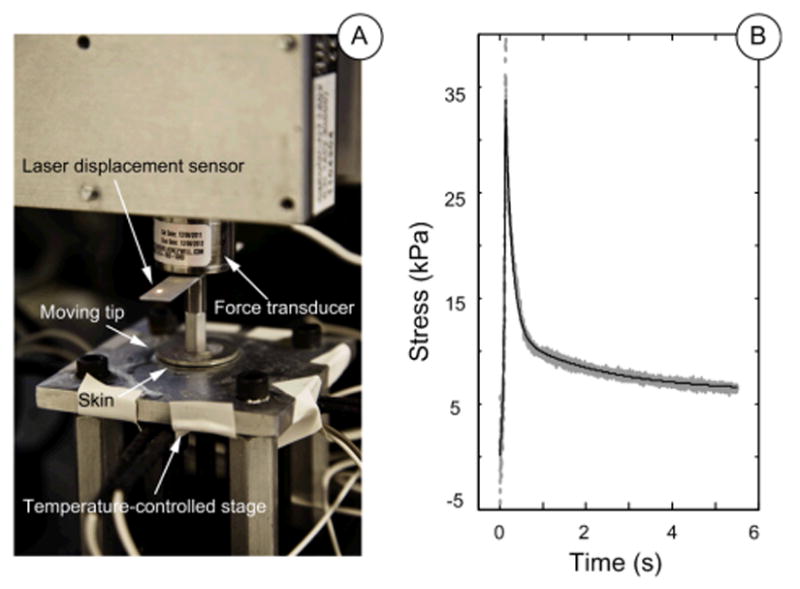
A: Uniaxial compression test machine. B: Example of recorded stress-time data (grey dots) and model fit (black line).
Skin Test Procedure
Maximum indentation depths were determined by manually searching for an instantaneous reaction force around 2 N, which is on the approximate order to generate a strain level of 25% similar to indentation in electrophysiological recordings [14]. The starting position of the compression tip was set to make sure that the tip was positioned above the skin surface. Skin punches were approximately 0.2–0.6 mm thick and were placed flat under the center of the tip. Displacement stimuli with a constant ramp-up speed of 1 mm/s were loaded on the samples while the reaction force was logged. Droplets of synthetic interstitial fluid (SIF) were added via eye dropper to prevent skin from drying out. Experiment temperature was set at 32 Celsius degrees to match in vivo skin temperatures. Five pre-conditioning runs were performed; force traces from the 6th run were analyzed.
Parameter fitting
The 1st order Ogden type of strain energy function was used for instantaneous hyperelasticity [22], whereas the quasi-linear viscoelastic model [23] with 2-term Prony series was used for viscoelasticity. Note that parameter μ1is fixed during fitting. The fitting is done with Matlab (MathWorks, Natick, MA).
2.2 Numerical Model
Two sub-models constituted the numerical model: skin mechanics sub-model (FE model), and the neural transduction sub-model.
Construction of FE model
The commercial software ABAQUS (Dassault Systèmes, Vélizy-Villacoublay, France) was used for FE modeling. An axisymmetric finite element model (Figure 2) with hyper- and visco-elastic material properties was developed to mimic the reactions of the skin properties given indentation techniques of ramp-and-hold stimuli in both displacement and force control. The model comprised ∼14,000 elements (element type CAX4RH) and three layers to match neurophysiological recordings: top layer, skin; middle layer, nylon perfusion wick; and a bottom substrate of silicone elastomer. Silicone elastomer, often Sylgard, is used in electrophysiological recordings to mimic muscle tissue, and nylon serves to improve SIF circulation [14], [24]. Thicknesses and mechanical properties of skin were set according to measured values on samples by uniaxial compression test by a rigid cylindrical indenter tip (3.42 mm diameter and with 0.32 mm radius edge-rounded fillet, based on the one used in electrophysiological recordings), and those of Sylgard and nylon were obtained from inverse FE model fitting with indentations by a spherical indenter tip (3.5mm diameter). The surface interaction between indenter and skin was set as frictionless. Maximum compressive stresses[8] at the center top element and the immediate element below were extracted and averaged, since the intersection of the two elements was at 15 μm below skin surface which approximates the locations of Merkel cell-neurite complexes.
Figure 2.
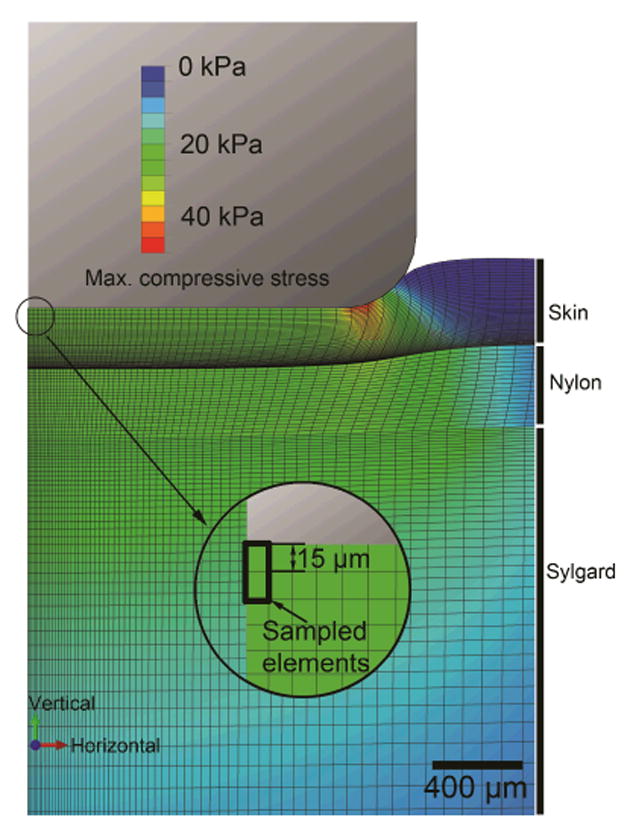
Contour map of maximum compressive stress in the FE model upon indentation by a 3.42 mm diameter cylinder. The highlighted elements represent locations of the tactile end organs of the SAI afferent.
Electrophysiological recording data and FE model validation
Previously published electrophysiological recordings [25] were used to compare and validate the numerical model. In the experiment, ramp-and-hold displacement stimuli were delivered to skin, with nylon and Sylgard as substrate. Ramp durations varied between 100–400 ms, and the duration of the sustained load was 5 s. Two distinct phases were identified [26]: a) dynamic ramp phase (also noted as dynamic phase), defined from t=0 s to the time when the peak force was achieved; b) sustained hold phase (also noted as static phase), defined from t=2 to 5 s. For model validation, predicted force traces were compared with those experimentally recorded.
Neural transduction sub-model fitting and validation
Absolute values of stress and stress rate (derivative of stress with respect to time) were averaged within span of dynamic and static phases individually. Then, a linear regression (Eqn. 1) was performed with independent variables as absolute values of averaged stress and stress rate, and dependent variable as average firing rate (inverse of average inter-spike intervals), respectively in dynamic and static phases. Note that there was no constant term in this regression. The regression equation is:
| (1) |
where denotes average firing rate, denotes the absolute value of average stress, denotes the absolute value of average stress rate, and k1,k2 are stress and stress rate coefficients to be calculated from the regression.
2.3 Exploratory Numerical Experiments
To systematically explore how changes in skin thickness might impact firing rate under both displacement and force control, we performed four additional experiments varying values for thickness as well as material properties. For each thickness of model, two stimulus types were applied: a) for displacement-controlled stimuli, the load was 0.19 mm with linear ramp over 148.89 ms; b) for force-controlled stimuli, the load was 0.2 N with linear ramp over 148.89 ms. These magnitude and rise time were set to be 1) consistent with electrophysiological recording set-up, as 0.19 mm lies in the middle between minimal absolute threshold of SAI and the saturating magnitude; 2) comparable between two stimuli types. For all model simulations, parameters of the neural transduction function were held constant.
3 Results
Material measurements
The result of the parameter fits to the skin measurements are listed in Table 1, as well as properties of nylon and Sylgard. The average R2 for skin parameter fitting is 0.97. Note that the variation in skin thicknesses between #1–#4 (CV=0.36) is more pronounced than in elasticity parameter α1 (CV=0.04).
Numerical model fit and validation
Linear regression gave values for stress coefficient k1=0.505Hz/kPa, and stress rate coefficient k2=0.349Hz/( ). Both independent variables are significant (P<10-4), and the R2 for the regression is 0.97. This model was validated by a) comparing predicted and recorded force traces (Figure 3A); b) comparing model output with recorded firing rate (Figure 3B) in dynamic and static phases (Figure 4A, 4B) respectively.
Figure 3.
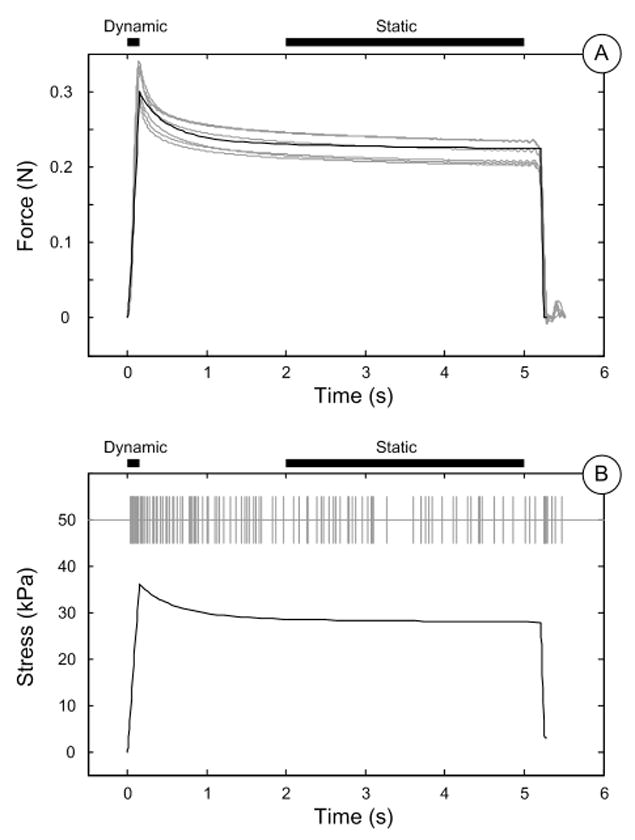
A: FE model prediction (black) and recorded (gray) force. B: Model predicted maximum compressive stress at receptor location (black solid line) compared with recorded SAI action potential trains (gray vertical dashes).
Figure 4.
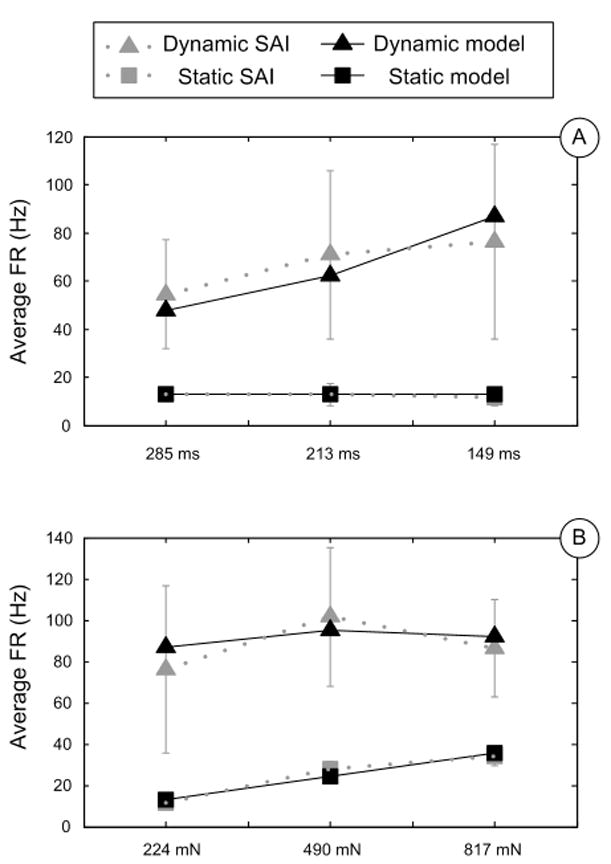
Model predictions (black) and SAI recordings (gray) showing average firing rates in dynamic ramp (square) and sustained hold (triangle) phases. A: Comparisons at different ramp times; B: Comparisons at different sustained force.
Exploratory numerical experiments
The outputs of FE models are shown in Figure 5. The maximum compressive stress traces from models with displacement control stimuli were significantly more variant than those from models with force control stimuli. Predicted neural outputs gave similar results, as the average firing rates with different skin thicknesses was much steadier for force-controlled stimuli compared with displacement control (Figure 6). A quantitative comparison of standard deviations between two indentation methodologies is shown in Table 2, where the variance of displacement-controlled response is ∼3–5 greater than that from force-controlled stimuli.
Figure 5.
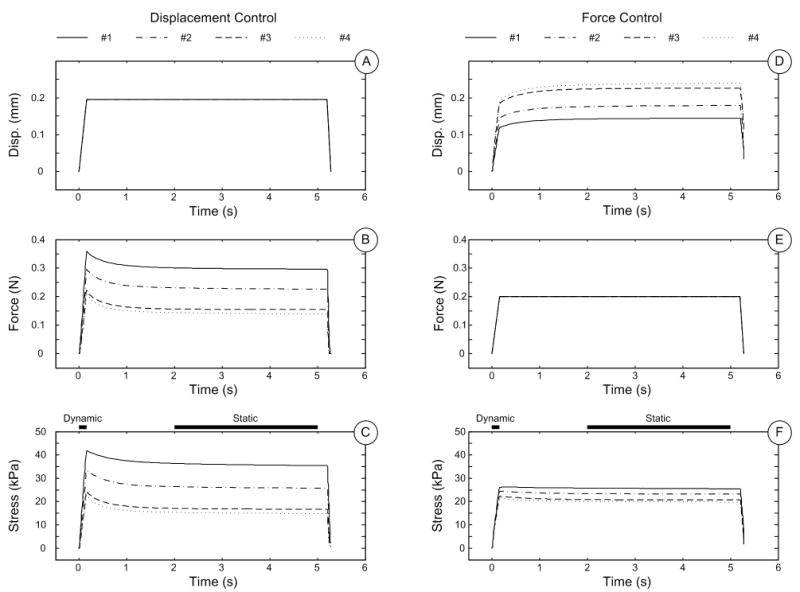
FE results using skin measurements #1-4. A-C: displacement trace, force trace and maximum compressive stress at receptor site, under displacement-controlled mechanical stimuli. D-F: displacement trace, force trace and maximum compressive stress at receptor site, under force-controlled mechanical stimuli.
Figure 6.
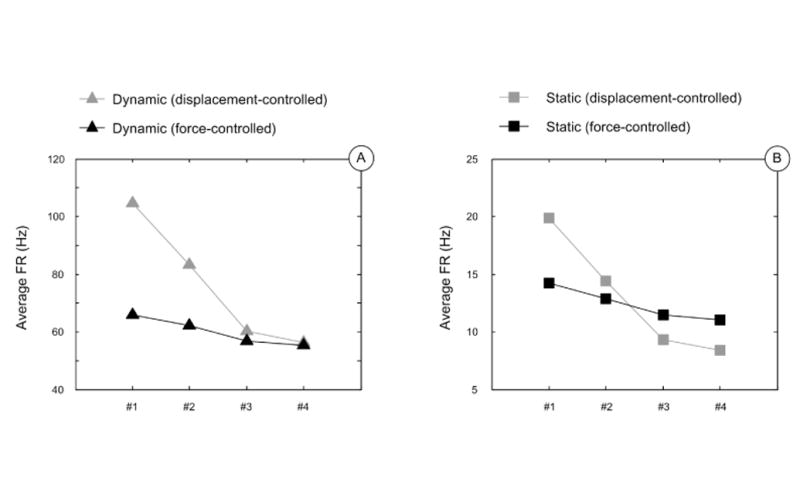
SAI simulation results of sample #1-4 under displacement-controlled stimuli (grey) and force-controlled stimuli (black). A: The variation of average firing rates at dynamic phase (triangle); B: variation of average firing rates at static phase (square). Force-controlled results are much less variable compared to displacement-controlled ones.
Table 2.
Comparison of variation between displacement and force control stimuli.
| Stimuli control | SD of firing rate (Hz) | SD of stress (Pa) | SD of stress rate (Pa/s) | |||
|---|---|---|---|---|---|---|
| Dynamic ramp | Sustained hold | Dynamic | Static | Dynamic | Static | |
| Displacement | 22.48 | 5.31 | 4914.23 | 9556.45 | 60312.95 | 77.08 |
| Force | 4.91 | 1.44 | 909.17 | 2596.20 | 13458.48 | 28.06 |
| Ratio | 4.58 | 3.68 | 5.41 | 3.68 | 4.48 | 2.75 |
4 Discussion
Our modeling results indicate that force control may lead to less variation in neural responses between individuals. This is due to the biological observation, in the mouse, that between-animals the hyper-elasticity of the skin remains relatively consistent, though there are drastic differences in skin thickness. In specific, the variability in skin thickness much less impacts the predicted SAI response under control of the stimulus by force, by ∼25%, as compared to control by displacement (Table 2). Existing tactile display devices rely upon both force [21] and displacement control [8]. One of the desired characteristics of these devices is reliability of stimulus delivery independent of end-user, and therefore the results of this work argue for employing force-controlled technologies.
The time-dependent visco-elastic parameters of the mouse skin also varies significantly between-animals, as noted in Table 1, but do not stand out as a major factor in our results, because of how we setup our dependent metrics. Our window for calculating static firing rate window is set at 2-5 seconds, as has been done by others before [26], which is well after the point that the skin has relaxed from the beginning of the stimulus hold. The stimulus ramp, on the other hand, happens so rapidly (∼100 ms) that the viscoelasticity is minimal relative to the contribution of the hyperelasticity. A further analysis might consider the impact of the visco-elastic decay over the time-frame of the beginning of the hold to about 1-2 seconds, which might correlate with the firing rate [14].
Finally, note that the neural responses of SAI afferents vary significantly between animals [27], and the source of such variation may come from the biological events which constitute our touch perception: the object in the environment first contacts and deforms the skin, and these spatial distributions of forces propagate through the skin to the locations of the end organs. Local stresses/strains are transduced into trains of action potentials and then carried by somastoensory afferents to the central nervous system. For SAI afferents, at least three factors impact the transfer function: a) mechanical properties of the skin which modulate the distal stimulus to stress/strain local to Merkel cells; b) transduction properties at individual Merkel cell-neurite complexes; c) branch-structured morphology of the SAI afferent, which integrates information from Merkel cell-neurite complexes. Given the many sources of natural variation in propagation of a touch stimulus to receptors, it is essential that measures are taken to minimize experimental variables. However, only the mechanical properties of the skin were analysed herein. In the future, we will confirm our modeling result with neurophysiological recordings, from the skin of animals of known difference in thickness.
Acknowledgments
This work was supported by a grant from the National Institutes of Health (NINDS R01NS073119 to EAL and GJG). The content is solely the responsibility of the authors and does not necessarily represent the official views of the National Institutes of Health. The authors would also like to thank Elmer K. Kim for help in analysis of the electrophysiological data used herein.
References
- 1.Maricich SM, Wellnitz SA, Nelson AM, Lesniak DR, Gerling GJ, Lumpkin EA, Zoghbi HY. Merkel cells are essential for light-touch responses. 5934. Vol. 324. Science; New York, N.Y.: Jun, 2009. pp. 1580–2. [DOI] [PMC free article] [PubMed] [Google Scholar]
- 2.Johnson K. The roles and functions of cutaneous mechanoreceptors. Current Opinion in Neurobiology. 2001 Aug;11(4):455–461. doi: 10.1016/s0959-4388(00)00234-8. [DOI] [PubMed] [Google Scholar]
- 3.Johnson KO. Neural Coding. Neuron. 2000 Jun;26(3):563–566. doi: 10.1016/s0896-6273(00)81193-9. [DOI] [PubMed] [Google Scholar]
- 4.Craig JC. Grating orientation as a measure of tactile spatial acuity. Somatosensory & Motor Research. 1999 Jan;16(3):197–206. doi: 10.1080/08990229970456. [DOI] [PubMed] [Google Scholar]
- 5.Goodwin AW, John KT, Marceglia AH. Tactile discrimination of curvature by humans using only cutaneous information from the fingerpads. Experimental Brain Research. 1991 Sep;86(3) doi: 10.1007/BF00230540. [DOI] [PubMed] [Google Scholar]
- 6.Gibson GO, Craig JC. Tactile spatial sensitivity and anisotropy. Perception & Psychophysics. 2005 Aug;67(6):1061–1079. doi: 10.3758/bf03193632. [DOI] [PubMed] [Google Scholar]
- 7.Westling G, Johansson RS. Factors influencing the force control during precision grip. Experimental Brain Research. 1984 Jan;53(2) doi: 10.1007/BF00238156. [DOI] [PubMed] [Google Scholar]
- 8.Sripati AP, Bensmaia SJ, Johnson KO. A continuum mechanical model of mechanoreceptive afferent responses to indented spatial patterns. Journal of neurophysiology. 2006 Jun;95(6):3852–64. doi: 10.1152/jn.01240.2005. [DOI] [PMC free article] [PubMed] [Google Scholar]
- 9.Phillips JR, Johnson KO. Tactile spatial resolution. III. A continuum mechanics model of skin predicting mechanoreceptor responses to bars, edges, and gratings. Journal of neurophysiology. 1981 Dec;46(6):1204–25. doi: 10.1152/jn.1981.46.6.1204. [DOI] [PubMed] [Google Scholar]
- 10.Maeno T, Kobayashi K, Yamazaki N. Relationship between the Structure of Human Finger Tissue and the Location of Tactile Receptors. JSME International Journal Series C. 1998;41(1):94–100. [Google Scholar]
- 11.Gerling GJ, Thomas GW. Fingerprint lines may not directly affect SA-I mechanoreceptor response. Somatosensory & motor research. 2008 Mar;25(1):61–76. doi: 10.1080/08990220701838996. [DOI] [PubMed] [Google Scholar]
- 12.Dandekar K, Raju BI, Srinivasan MA. 3-D finite-element models of human and monkey fingertips to investigate the mechanics of tactile sense. Journal of biomechanical engineering. 2003 Oct;125(5):682–91. doi: 10.1115/1.1613673. [DOI] [PubMed] [Google Scholar]
- 13.Srinivasan MA. Surface deflection of primate fingertip under line load. Journal of biomechanics. 1989 Jan;22(4):343–9. doi: 10.1016/0021-9290(89)90048-1. [DOI] [PubMed] [Google Scholar]
- 14.Wellnitz SA, Lesniak DR, Gerling GJ, Lumpkin EA. The regularity of sustained firing reveals two populations of slowly adapting touch receptors in mouse hairy skin. Journal of Neurophysiology. 2010;103(6):3378–3388. doi: 10.1152/jn.00810.2009. [DOI] [PMC free article] [PubMed] [Google Scholar]
- 15.Phillips JR, Johnson KO. Tactile spatial resolution. II. Neural representation of Bars, edges, and gratings in monkey primary afferents. Journal of neurophysiology. 1981 Dec;46(6):1192–203. doi: 10.1152/jn.1981.46.6.1192. [DOI] [PubMed] [Google Scholar]
- 16.Khalsa PS, Friedman RM, Srinivasan MA, Lamotte RH. Encoding of shape and orientation of objects indented into the monkey fingerpad by populations of slowly and rapidly adapting mechanoreceptors. Journal of neurophysiology. 1998 Jun;79(6):3238–51. doi: 10.1152/jn.1998.79.6.3238. [DOI] [PubMed] [Google Scholar]
- 17.Birznieks I, Jenmalm P, Goodwin AW, Johansson RS. Encoding of direction of fingertip forces by human tactile afferents. The Journal of neuroscience : the official journal of the Society for Neuroscience. 2001 Oct;21(20):8222–37. doi: 10.1523/JNEUROSCI.21-20-08222.2001. [DOI] [PMC free article] [PubMed] [Google Scholar]
- 18.Daly CH, Odland GF. Age-related Changes in the Mechanical Properties of Human Skin. Journal of Investigative Dermatology. 1979 Jul;73(1):84–87. doi: 10.1111/1523-1747.ep12532770. [DOI] [PubMed] [Google Scholar]
- 19.Baumann KI, Hamann W, Leung MS. Mechanical properties of skin and responsiveness of slowly adapting type I mechanoreceptors in rats at different ages. The Journal of physiology. 1986 Feb;371:329–37. doi: 10.1113/jphysiol.1986.sp015978. [DOI] [PMC free article] [PubMed] [Google Scholar]
- 20.Agache PG, Monneur C, Leveque JL, De Rigal J. Mechanical properties and Young’s modulus of human skin in vivo. Archives of dermatological research. 1980 Jan;269(3):221–32. doi: 10.1007/BF00406415. [DOI] [PubMed] [Google Scholar]
- 21.Wall SA, Brewster S. Sensory substitution using tactile pin arrays: Human factors, technology and applications. Signal Processing. 2006 Dec;86(12):3674–3695. [Google Scholar]
- 22.Holzapfel G. Nonlinear Solid Mechanics: A Continuum Approach for Engineering. 2000. [Google Scholar]
- 23.Fung YC, Cowin SC. Biomechanics: Mechanical Properties of Living Tissues. Journal of Applied Mechanics. (2) 1994;61(4):1007. [Google Scholar]
- 24.Khalsa PS, Lamotte RH, Grigg P. Tensile and Compressive Responses of Nociceptors in Rat Hairy Skin. J Neurophysiol. 1997 Jul;78(1):492–505. doi: 10.1152/jn.1997.78.1.492. [DOI] [PubMed] [Google Scholar]
- 25.Kim EK, Gerling GJ, Bourdon SM, Wellnitz SA, Lumpkin EA. Force sensor in simulated skin and neural model mimic tactile sai afferent spiking response to ramp and hold stimuli. Journal of NeuroEngineering and Rehabilitation. 2012;9(1):45. doi: 10.1186/1743-0003-9-45. [DOI] [PMC free article] [PubMed] [Google Scholar]
- 26.Iggo A, Muir AR. The structure and function of a slowly adapting touch corpuscle in hairy skin. The Journal of physiology. 1969 Feb;200(3):763–96. doi: 10.1113/jphysiol.1969.sp008721. [DOI] [PMC free article] [PubMed] [Google Scholar]
- 27.Lesniak DR, Wellnitz SA, Gerling GJ, Lumpkin EA. Statistical analysis and modeling of variance in the SA-I mechanoreceptor response to sustained indentation. Annual International Conference of the IEEE Engineering in Medicine and Biology Society. IEEE Engineering in Medicine and Biology Society. 2009;2009:6814–7. doi: 10.1109/IEMBS.2009.5334487. [DOI] [PMC free article] [PubMed] [Google Scholar]


