

Abstract
Objective:
A brief speech expression protocol that can be administered and scored without special training would aid in the differential diagnosis of the 3 principal forms of primary progressive aphasia (PPA): nonfluent/agrammatic PPA, logopenic variant PPA, and semantic variant PPA.
Methods:
We used a picture-description task to elicit a short speech sample, and we evaluated impairments in speech-sound production, speech rate, lexical retrieval, and grammaticality. We compared the results with those obtained by a longer, previously validated protocol and further validated performance with multimodal imaging to assess the neuroanatomical basis of the deficits.
Results:
We found different patterns of impaired grammar in each PPA variant, and additional language production features were impaired in each: nonfluent/agrammatic PPA was characterized by speech-sound errors; logopenic variant PPA by dysfluencies (false starts and hesitations); and semantic variant PPA by poor retrieval of nouns. Strong correlations were found between this brief speech sample and a lengthier narrative speech sample. A composite measure of grammaticality and other measures of speech production were correlated with distinct regions of gray matter atrophy and reduced white matter fractional anisotropy in each PPA variant.
Conclusions:
These findings provide evidence that large-scale networks are required for fluent, grammatical expression; that these networks can be selectively disrupted in PPA syndromes; and that quantitative analysis of a brief speech sample can reveal the corresponding distinct speech characteristics.
Recent consensus criteria have identified 3 variants of primary progressive aphasia (PPA).1 These include nonfluent/agrammatic PPA (naPPA), characterized by effortful speech and agrammatic language production with impaired comprehension of complex syntax.2 In a second variant, termed semantic variant PPA (svPPA), the most prominent impairment involves semantics, including deficits in confrontation naming, single-word comprehension, and object knowledge.3 The third variant, known as logopenic variant PPA (lvPPA), features impaired word retrieval and sentence repetition, with slowed spontaneous speech and frequent pauses.4,5
Each PPA variant may be related in part to distinct underlying pathology.6 naPPA has been linked to tau-positive pathology,7 svPPA to TDP43-positive pathology,8 and lvPPA to Alzheimer disease pathology.9 As disease-modifying clinical trials for these histopathologic conditions emerge, the need to screen quantitatively for variants of PPA becomes more urgent. This is particularly crucial given recent reports documenting unreliable clinical diagnosis of lvPPA.10,11
In this study, we tested whether a brief protocol that is easy to score and interpret without special training would be a significant aid to the differential diagnosis of these 3 similar conditions. In previous quantitative assessments of PPA speech, lengthy, semistructured narrative speech samples analyzed by an experienced linguist were used.12–14 Analyses of briefer protocols have been reported.15,16 However, these have not been validated by a lengthier narrative that is more closely representative of everyday speech, demonstrative of the speaker's full range of expressive language capacity. We further validated the brief protocol with imaging studies of gray matter (GM) atrophy and reduced white matter (WM) fractional anisotropy (FA).
METHODS
Standard protocol approvals, registrations, and patient consents.
All subjects provided written informed consent in accordance with the Declaration of Helsinki using a procedure approved by the Institutional Review Board of the University of Pennsylvania.
Subjects.
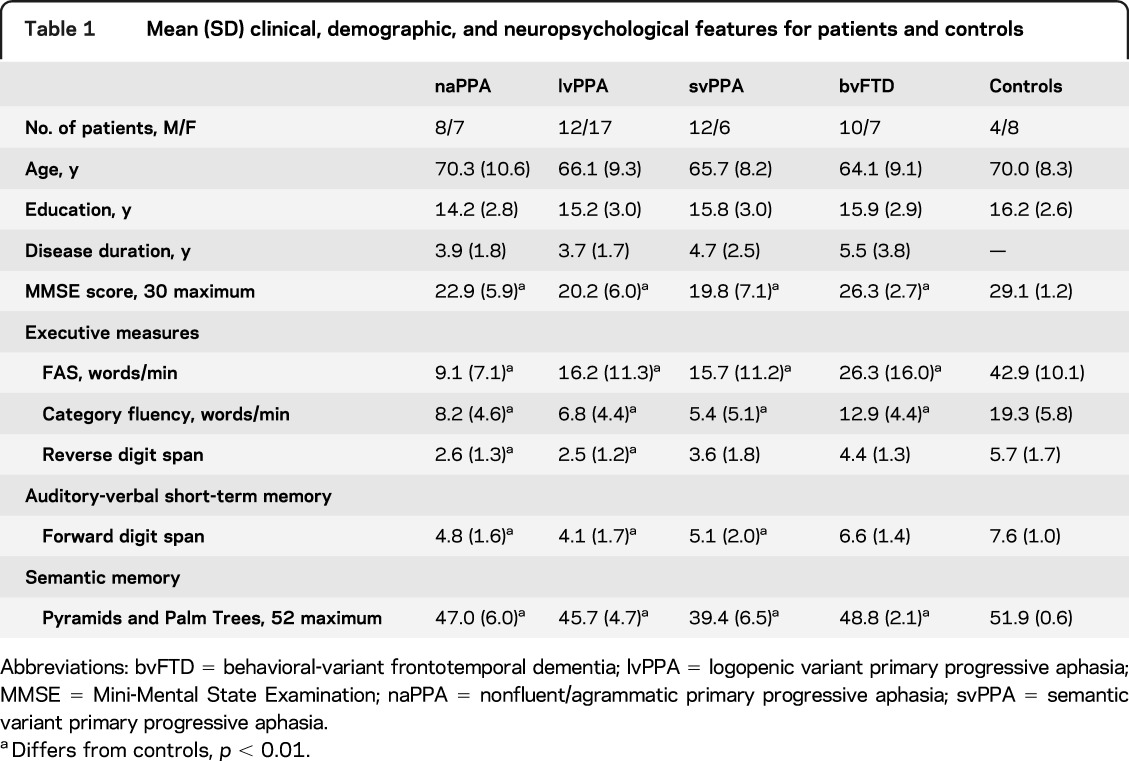
We studied 79 patients with PPA or behavioral-variant frontotemporal dementia (bvFTD) diagnosed by experienced neurologists (M.G., D.J.I.) in the Department of Neurology at the University of Pennsylvania according to published criteria.17 All participants met published criteria for their phenotype diagnosis, as reviewed by 2 independent investigators.1,18 Differences in the judges' classifications were resolved by consensus. Participants included 15 patients with naPPA, 29 with lvPPA, 18 with svPPA, and 17 neurodegenerative controls with bvFTD. Neuropsychological testing was administered within an average of 82 (±112) days of recording the speech sample; these tests are described briefly in appendix e-1 on the Neurology® Web site at www.neurology.org. Patients had mild dementia according to the Mini-Mental State Examination; patients with naPPA and lvPPA showed impairment on measures of working memory. Clinical, demographic, and neuropsychological characteristics are summarized in table 1. Exclusionary criteria included other neurologic conditions such as stroke, head trauma, or hydrocephalus; other causes of dementia; medical conditions associated with cognitive difficulty; and primary psychiatric disorders. We also excluded subjects with visual-perceptual difficulties that could interfere with perceiving the stimulus picture. We also studied 12 healthy seniors recruited from the community.
Table 1.
Mean (SD) clinical, demographic, and neuropsychological features for patients and controls
Speech evaluation procedures.
We elicited a brief speech sample by asking subjects to describe a single complex picture, the Cookie Theft scene from the Boston Diagnostic Aphasia Examination.19 This is a black-and-white line drawing of a lively kitchen scene. On the left, a boy is standing on a stool that is tipping over as he reaches for a cookie jar in a cabinet, while a girl standing next to the stool is reaching for a cookie in his hand. On the right, a woman is washing a plate while water from the sink overflows onto the floor. Subjects were instructed to describe the picture in as much detail as possible for a specified amount of time, usually 90 seconds (n = 58) but sometimes 60 seconds (n = 33). Examiners minimized prompts to allow uninterrupted speech, although a prompt was offered after 10 seconds of silence.
The descriptions were recorded digitally, transcribed by trained transcribers using the signal processing software Praat,20 and then scored from the transcripts with reference to the sound files as necessary. Close transcription of the speech samples requires about an hour, and coding requires approximately a quarter of an hour. The speech was analyzed for features of speech rate, grammar, and lexicon, summarized in table 2, as in our previous analyses of longer narrative speech samples.12–14 Speech rate was quantified by words per minute, calculated from the duration of the subject's description in the sound file. The transcription marks pauses ≥2 seconds; to simulate assessment in a clinical setting, these pauses were included in speech rate calculation.
Table 2.
Mean (±SD) speech production measures in patients and controlsa
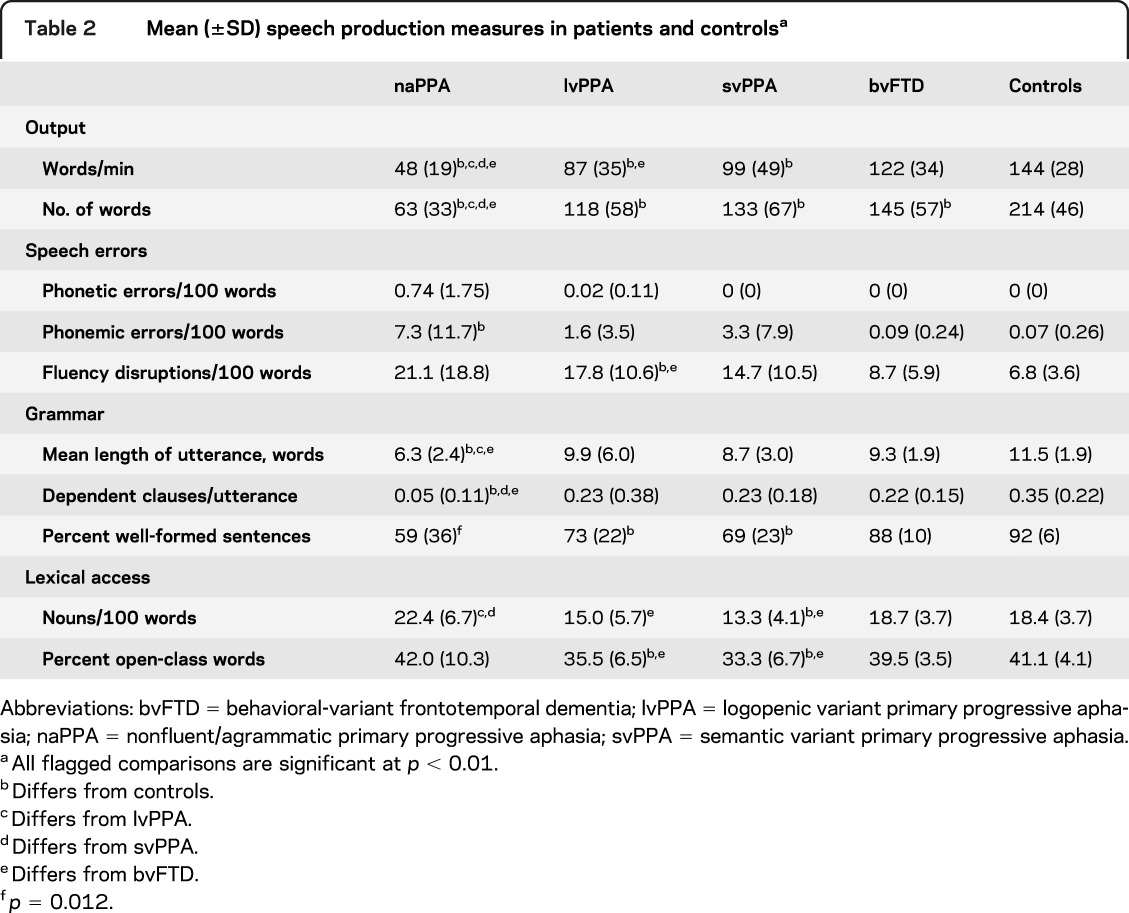
Speech errors were classified as phonetic, phonemic, or dysfluent. A phonetic error occurs when a speaker produces segments that are not in the inventory of English phonetics; such an error may be caused by a motor impairment known as apraxia of speech (AOS). A phonemic error occurs when actual phonemes of English are inserted, deleted, or substituted for a required segment and may be caused by impaired knowledge of the word form or incorrect sequencing of the segments constituting the word. Many reports of naPPA ascribe speech impairments to AOS. Phonetic errors logically may result from a motor-related impairment. Phonemic errors could result from a motor impairment, but there is no obvious way to distinguish errors in the selection of phonemes from a coincidence of multiple motor errors producing a well-formed phoneme. Therefore, we attribute phonemic errors to a deficit in phoneme selection, not to AOS. Transcription of speech that is unintelligible on first hearing is aided by a variety of techniques, including using the signal-processing software Praat,20 with headphones, to adjust the signal amplitude and to focus on stretches of speech that are difficult to understand. These techniques often reveal that a stretch of speech consists of well-formed phonemes, despite initial difficulty.
Dysfluencies include incomplete words (false starts), hesitation markers (filled pauses), and extraneous words (words that are repeated or replaced in the stream of speech). Examples are given in appendix e-2.
To assess grammatical features, the speech sample was parsed into utterances, where an utterance is defined as an independent clause and all clauses dependent on it.21 An incomplete sentence is defined as an utterance if it stands alone in the stream of speech. Grammatical complexity was quantified by the mean length of utterances (MLU) in words; the average number of dependent clauses per utterance; and the percent of utterances that were well-formed sentences, that is, complete sentences free of grammatical errors, regardless of content. Lexical access was quantified as the number of nouns occurring per 100 words and the number of open-class (content) words per 100 words.
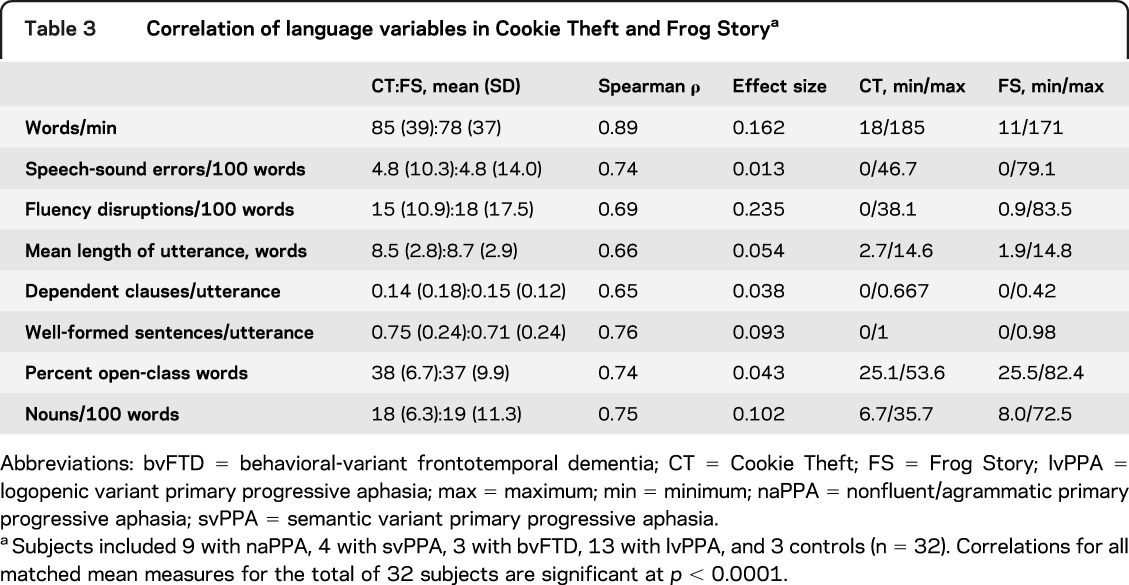
A subgroup of subjects (n = 32) also completed a lengthier protocol elicited by the children's picture book Frog Where Are You?22 within a mean of 4.4 months of completing the Cookie Theft protocol. This subgroup included 9 subjects with naPPA, 4 with svPPA, 3 with bvFTD, 13 with lvPPA, and 3 controls. We considered all 32 subjects together to determine whether participants performed comparably on the 2 tasks regardless of condition. The Frog Story protocol, an untimed narrative that approximates everyday speech in its variety of lexical and grammatical forms, yields a substantially longer speech sample, as reported including some of these cases.12–14,23 The narratives average approximately 4.5 minutes for controls to 10 minutes for subjects with lvPPA. The average number of words produced also varies: approximately 600 for controls, 450 for bvFTD, 550 for svPPA, 350 for naPPA, and 800 for lvPPA.
Statistical considerations.
The Levene test indicated that some measures of language performance did not meet the requirement of homogeneity of variance for parametric statistical tests. Therefore, nonparametric tests were used to compare groups on linguistic variables using the Mann-Whitney U statistic. Statistical analyses were performed using SPSS version 12 (SPSS, Inc., Chicago, IL). The selection of variables was guided by our previous work; thus, we set the p value for significance at the conservative level of p < 0.01.
Imaging methods.
High-resolution structural MRI scans made within a mean of 117 days of the Cookie Theft recording were available for 30 PPA patients (8 naPPA, 11 lvPPA, and 11 svPPA).
GM atrophy.
Details of GM density imaging, reported previously,24,25 are provided in appendix e-3. Voxel-wise comparisons using 2-sample t tests identified clusters surviving a q < 0.025 (false discovery rate (FDR)–corrected) height threshold and 50-voxel extent. Regression analyses related GM density to language performance at a height threshold of p < 0.05 (uncorrected) and 50-voxel extent.
WM FA.
Details of the imaging methods for WM FA, reported previously,7 are provided in appendix e-3. Two-sample t tests comparing patients with controls used a q < 0.01 (FDR-corrected) height threshold and 200 adjacent voxel extent to identify areas of reduced FA in naPPA and lvPPA, which were localized to probabilistically defined WM regions.26 In svPPA, a height threshold of p < 0.005 (uncorrected) was used because svPPA is usually associated with TDP-43 pathology,6 which manifests with relative sparing of WM.27 Regression analyses related FA to language performance at p < 0.01 (uncorrected) with a 50-voxel extent.
RESULTS
Characteristics of the subjects' speech output are summarized in table 2. Speech rate as measured by words per minute was reduced in all patient groups. Segmental speech errors were more frequent in naPPA than in control subjects. Phonemic errors were evident in all groups, but phonetic errors were rare: n = 5 in naPPA (produced by 4 different patients); n = 1 in lvPPA. Only lvPPA produced significantly frequent dysfluency errors (hesitation markers and false starts). There was a trend toward more dysfluency errors in naPPA and svPPA relative to controls. Grammatical complexity, as measured by both MLU and the proportion of dependent clauses per utterance, was reduced in naPPA. All 3 PPA groups were impaired in the production of well-formed sentences. The svPPA and lvPPA groups exhibited impairments in producing content words, specifically for nouns in svPPA.
Comparison of Cookie Theft and Frog Story.
We compared analyses of the Cookie Theft descriptions and Frog Story narratives. The t tests confirmed for each subgroup that characteristics of Cookie Theft descriptions of patients providing Frog Story narratives did not differ from those of the entire cohort who completed the Cookie Theft protocol. As summarized in table 3, we found a strong correlation between subjects' performance on the 2 tasks across all 32 subjects (p < 0.0001 for all comparisons). The effect size for all comparisons was small, providing further evidence that performance on the features of speech production studied here is comparable in Cookie Theft and Frog Story.
Table 3.
Correlation of language variables in Cookie Theft and Frog Storya
Imaging results.
GM imaging.
Coordinates of GM atrophy peaks and reduced FA for naPPA, lvPPA, and svPPA are summarized in appendix e-4 and tables e-1 to e-4. Regressions related speech impairments to atrophy in each group. Figure 1 displays regional GM atrophy and regressions with a measure of grammaticality, derived by averaging the z scores of MLU, proportion of sentences with dependent clauses, and percentage of well-formed sentences for each patient group. Figure 2 displays the regressions of other speech production variables with GM atrophy: segmental speech errors in naPPA, dysfluencies in lvPPA, and nouns per 100 words in svPPA.
Figure 1. Gray matter atrophy and reduced white matter fractional anisotropy in primary progressive aphasia and regressions relating grammaticality to neuroimaging.

(A) Nonfluent/agrammatic primary progressive aphasia (naPPA). (B) Logopenic variant primary progressive aphasia (lvPPA). (C) Semantic variant primary progressive aphasia (svPPA). In the left (left hemisphere) and center (right hemisphere) columns, gray matter atrophy is shown in green (q < 0.025, FDR-corrected), and regressions relating grammaticality to atrophy are shown in red (p < 0.05). On the right, reduced white matter fractional anisotropy is shown in orange (q < 0.01, FDR-corrected, except svPPA p < 0.005 uncorrected), and regressions relating grammaticality to fractional anisotropy are shown in pink (p < 0.01). Yellow arrows highlight regressions in naPPA and lvPPA. FDR = false discovery rate.
Figure 2. Regressions relating speech production variables to gray matter atrophy and reduced white matter fractional anisotropy in primary progressive aphasia.

(A) Regressions for speech errors per 100 words in nonfluent/agrammatic primary progressive aphasia (naPPA). (B) Regressions for dysfluencies per 100 words in logopenic variant primary progressive aphasia (lvPPA). (C) Regressions for nouns per 100 words in semantic variant primary progressive aphasia (svPPA). In the left (left hemisphere) and center (right hemisphere) columns, gray matter atrophy is shown in green (q < 0.025, FDR-corrected), and regressions are in other colors (p < 0.05). On the right, reduced white matter fractional anisotropy is shown in orange (q < 0.01, FDR-corrected, except svPPA p < 0.005 uncorrected), and regressions are shown in pink (p < 0.01). Right hemisphere gray matter atrophy is not shown in panels B and C and white matter reduced fractional anisotropy is not shown in panel B because there were no significant regression results. FDR = false discovery rate.
Subgroup naPPA (figure 1A) revealed GM atrophy in bilateral inferior frontal, dorsolateral prefrontal cortex, and anterior cingulate (not illustrated) regions, more prominently on the left, and left insula, anterior-superior temporal, and inferior parietal regions. Grammaticality was related to atrophy in left inferior frontal, dorsolateral prefrontal cortex, insula, and anterior-superior temporal regions (figure 1A). Regression analyses in naPPA related speech errors to atrophy in left insula and anterior cingulate (not illustrated) and in right supplementary motor regions (figure 2A).
Subgroup lvPPA (figure 1B) showed GM atrophy bilaterally in frontal, temporal, and parietal regions, more prominently on the left than the right. Regression analyses related grammaticality to left inferior parietal and superior temporal regions (figure 1B) and related nonsegmental dysfluencies in lvPPA to left inferior parietal and superior temporal regions (figure 2B).
Subgroup svPPA (figure 1C) showed GM atrophy bilaterally in anterior and ventral temporal regions and in left frontal and posterior temporal regions. Grammaticality was related to left temporal, orbital frontal, and insula regions (figure 1C). The frequency of nouns in svPPA was related to left orbital frontal, anterior cingulate (not illustrated), middle temporal, and fusiform (not illustrated) regions (figure 2C).
WM imaging.
The coordinates of peak loci of reduced FA for naPPA, lvPPA, and svPPA are summarized in appendix e-4 and table e-4. Figure 1 displays reduced FA in WM for all 3 patient groups and the regressions of FA with grammaticality for naPPA and lvPPA. Figure 2 displays the regressions of speech production variables with FA.
In naPPA (figure 1A), WM changes were found in left anterior corona radiata, cingulum, genu of corpus callosum, and in right fornix. Regression analyses in naPPA related grammaticality to FA in left cingulum and corpus callosum. Regressions related speech-sound errors to corpus callosum (figure 2A).
In lvPPA (figure 1B), WM changes were found in left cingulum, superior longitudinal fasciculus, posterior corona radiata, and posterior thalamic radiations, bilaterally in the body of the corpus callosum, and in right fornix. Regression analyses in lvPPA related grammaticality to left cingulum.
In svPPA (figure 2C), WM changes were found in left external capsule, crus of fornix or stria terminalis, corpus callosum, and cingulum. Regression analyses did not reveal a relationship of WM FA to grammaticality, but FA was related to nouns per 100 words in left fornix, cingulum, and corpus callosum (figure 2C).
DISCUSSION
We identified linguistic features and anatomical correlates that quantitatively distinguish PPA subgroups by analyzing a brief speech sample consisting of the description of a single complex picture. Linguistic features were highly correlated with corresponding measures from a lengthier, validated protocol. Speech rate in naPPA was slower than in other PPA subgroups.12,14–16 naPPA also exhibited the most extreme grammatical impairment. Although subjects in both lvPPA and svPPA subgroups produced sentences that were often incomplete or otherwise ill-formed, their sentences were otherwise normal in length and grammatical complexity, emphasizing the distinctiveness of the grammatical impairment in naPPA. Only naPPA subjects produced significant numbers of speech-sound errors.
Patients with lvPPA were unique in exhibiting significant disruptions to the flow of speech, including false starts and hesitation markers. This may be related in part to the disruption of a mechanism important for producing content words in spontaneous connected speech.
Patients with svPPA produced a paucity of content words, consistent with previous findings,16,28,29 particularly affecting nouns, concordant with their deficits in understanding object meaning.3,30–32
Patients with bvFTD were impaired relative to controls on measures of executive functioning, short-term auditory memory, and overall cognitive ability. Nevertheless, this neurodegenerative control group did not display the speech deficits characteristic of patients with PPA.
Imaging analyses are consistent with distinctive patterns of linguistic impairment in each PPA subgroup. The naPPA subgroup showed reduced GM density in the left frontal lobe, extending to right frontal and left anterior-superior temporal regions. Grammaticality was related to GM regions associated with grammatical expression in left frontal and anterior-superior temporal regions.7,33 Regression analysis also related grammatical expression to an area approximating the superior longitudinal and arcuate fasciculi, a portion of the dorsal stream with projections between frontal and posterior temporal regions. Although these and other regressions should be interpreted cautiously because we used uncorrected analyses, this large-scale neural network has been implicated in long-distance syntactic relations,34 and previous observations have related interruption of this network to grammatical deficits in naPPA.7 Additional work is needed to verify these regressions prospectively in larger PPA groups.
Speech-sound deficits in naPPA were related to atrophy in the insula, a GM region implicated in speech articulation,35 and to right premotor and supplementary motor regions. We also found FA in the corpus callosum related to speech-sound errors. Thus, speech errors in naPPA may be attributable in part to disruption of a bilateral frontal network mediated by projections through the anterior corpus callosum. Other reports from our laboratory have implicated this network in the reduced speech rate of naPPA,7 consistent with the strong correlation of speech rate and speech errors in naPPA (s = −0.69, p < 0.01).
Grammaticality in lvPPA was associated with left inferior parietal atrophy, in a large cluster extending into temporal regions. This regression implicates short-term memory in grammatical production deficits.5,15,16 Grammaticality in lvPPA also was related to reduced FA in the left cingulum. Although limited auditory-verbal short-term memory has been related to sentence processing difficulty in lvPPA,4 the precise contribution of cingulum to this proposed mechanism is not clear.
Dysfluencies in lvPPA also were associated with atrophy in the left parietal region. Others have found an association of the same region with repairs to speech in lvPPA using a variant of the task employed in the present study.16 This region may be involved in sensory-motor coordination needed to produce fluent speech.36
In svPPA, impaired noun production was related to GM regions implicated in noun production, including ventral and middle temporal regions. Regression analyses also related noun production to WM tracts projecting between temporal and frontal regions, including the cingulum and fornix, implicating a frontotemporal network in noun production during speech. Grammaticality also was related to temporal and frontal areas important for lexical expression, presumably to support integration of individual words into sentence contexts.
The evidence of sound, word, and sentence production derived from the Cookie Theft protocol can contribute quantitatively to the effort to distinguish among variants of PPA. A minimal set of linguistic features provides a guide to this differentiation, and these features, with the investment of a little more than an hour, can be tabulated without requiring special training on the part of the examiner. They include grammatical and speech-sound errors in naPPA, nonsegmental fluency disruptions in lvPPA, and access to the lexicon in svPPA. These speech markers are validated by the richer speech sample elicited by narration of an entire story. Additional validation of the distinct speech characteristics of PPA variants comes from the different regions of GM atrophy and reduced FA that are related to the speech deficits in these PPA variants.
Supplementary Material
GLOSSARY
- AOS
apraxia of speech
- bvFTD
behavioral-variant frontotemporal dementia
- FA
fractional anisotropy
- FDR
false discovery rate
- GM
gray matter
- lvPPA
logopenic variant primary progressive aphasia
- MLU
mean length of utterance
- naPPA
nonfluent/agrammatic primary progressive aphasia
- PPA
primary progressive aphasia
- svPPA
semantic variant primary progressive aphasia
- WM
white matter
Footnotes
Supplemental data at www.neurology.org
AUTHOR CONTRIBUTIONS
Sharon Ash drafted/revised the manuscript for content, contributed to study concept/design, contributed to acquisition of the data, performed analysis/interpretation of the data, and performed statistical analysis. Emily Evans and Jessica O'Shea drafted/revised the manuscript for content and contributed to acquisition and analysis/interpretation of the data. John Powers contributed to acquisition and analysis/interpretation of the data and performed statistical analysis. Ashley Boller, Danielle Weinberg, and Jenna Haley contributed to the acquisition and analysis/interpretation of the data. Corey McMillan contributed to acquisition and analysis/interpretation of the data and performed statistical analysis. David Irwin and Katya Rascovsky contributed to the acquisition and analysis/interpretation of the data. Murray Grossman drafted/revised the manuscript for content, contributed to study concept/design, contributed to analysis/interpretation of the data, obtained funding, and provided supervision.
STUDY FUNDING
This work was supported by the NIH (AG017586, AG015116, NS044266, NS053488, AG038490, and AG032953), the Wyncote Foundation, and a grant to support clinical research for first-year medical students from the Perelman School of Medicine of the University of Pennsylvania.
DISCLOSURE
The authors report no disclosures relevant to the manuscript. Go to Neurology.org for full disclosures.
REFERENCES
- 1.Gorno-Tempini ML, Hillis AE, Weintraub S, et al. Classification of primary progressive aphasia and its variants. Neurology 2011;76:1006–1014 [DOI] [PMC free article] [PubMed] [Google Scholar]
- 2.Grossman M. The non-fluent/agrammatic variant of primary progressive aphasia. Lancet Neurol 2012;11:545–555 [DOI] [PMC free article] [PubMed] [Google Scholar]
- 3.Hodges JR, Patterson K. Semantic dementia: a unique clinicopathological syndrome. Lancet Neurol 2007;6:1004–1014 [DOI] [PubMed] [Google Scholar]
- 4.Gorno-Tempini ML, Brambati SM, Ginex V, et al. The logopenic/phonological variant of primary progressive aphasia. Neurology 2008;71:1227–1234 [DOI] [PMC free article] [PubMed] [Google Scholar]
- 5.Gorno-Tempini ML, Dronkers NF, Rankin KP, et al. Cognition and anatomy in three variants of primary progressive aphasia. Ann Neurol 2004;55:335–346 [DOI] [PMC free article] [PubMed] [Google Scholar]
- 6.Grossman M. Primary progressive aphasia: clinical-pathological correlations. Nat Rev Neurol 2010;6:88–97 [DOI] [PMC free article] [PubMed] [Google Scholar]
- 7.Grossman M, Powers J, Ash S, et al. Disruption of large-scale neural networks in non-fluent/agrammatic variant primary progressive aphasia associated with frontotemporal degeneration pathology. Brain Lang Epub 2012 Dec 3 [DOI] [PMC free article] [PubMed]
- 8.Knibb JA, Xuereb JH, Patterson K, Hodges JR. Clinical and pathological characterization of progressive aphasia. Ann Neurol 2006;59:156–165 [DOI] [PubMed] [Google Scholar]
- 9.Mesulam MM, Wicklund A, Johnson N, et al. Alzheimer and frontotemporal pathology in subsets of primary progressive aphasia. Ann Neurol 2008;63:709–719 [DOI] [PMC free article] [PubMed] [Google Scholar]
- 10.Mesulam MM, Wieneke C, Thompson C, Rogalski E, Weintraub S. Quantitative classification of primary progressive aphasia at early and mild impairment stages. Brain 2012;135:1537–1553 [DOI] [PMC free article] [PubMed] [Google Scholar]
- 11.Sajjadi SA, Patterson K, Arnold RJ, Watson PC, Nestor PJ. Primary progressive aphasia: a tale of two syndromes and the rest. Neurology 2012;78:1670–1677 [DOI] [PMC free article] [PubMed] [Google Scholar]
- 12.Ash S, Moore P, Vesely L, et al. Non-fluent speech in frontotemporal lobar degeneration. J Neurolinguistics 2009;22:370–383 [DOI] [PMC free article] [PubMed] [Google Scholar]
- 13.Gunawardena D, Ash S, McMillan C, et al. Why are patients with progressive nonfluent aphasia nonfluent? Neurology 2010;75:588–594 [DOI] [PMC free article] [PubMed] [Google Scholar]
- 14.Ash S, Moore P, Antani S, et al. Trying to tell a tale: discourse impairments in progressive aphasia and frontotemporal dementia. Neurology 2006;66:1405–1413 [DOI] [PubMed] [Google Scholar]
- 15.Rogalski E, Cobia D, Harrison TM, et al. Anatomy of language impairments in primary progressive aphasia. J Neurosci 2011;31:3344–3350 [DOI] [PMC free article] [PubMed] [Google Scholar]
- 16.Wilson SM, Henry ML, Besbris M, et al. Connected speech production in three variants of primary progressive aphasia. Brain 2010;133:2069–2088 [DOI] [PMC free article] [PubMed] [Google Scholar]
- 17.McKhann G, Trojanowski JQ, Grossman M, et al. Clinical and pathological diagnosis of frontotemporal dementia: report of a work group on frontotemporal dementia and Pick's disease. Arch Neurol 2001;58:1803–1809 [DOI] [PubMed] [Google Scholar]
- 18.Rascovsky K, Hodges JR, Knopman D, et al. Sensitivity of revised diagnostic criteria for the behavioural variant of frontotemporal dementia. Brain 2011;134:2456–2477 [DOI] [PMC free article] [PubMed] [Google Scholar]
- 19.Goodglass H, Kaplan E. The Assessment of Aphasia and Related Disorders. Philadelphia: Lea & Febiger; 1983 [Google Scholar]
- 20.Praat, version 5.1.09 [computer program]. Institute of Phonetic Sciences, University of Amsterdam; 1992–2009
- 21.Hunt KW. Grammatical Structures Written at Three Grade Levels. Champaign, IL: National Council of Teachers of English; 1965 [Google Scholar]
- 22.Mayer M. Frog, Where Are You? New York: Penguin Books; 1969 [Google Scholar]
- 23.Ash S, McMillan C, Gunawardena D, et al. Speech errors in progressive non-fluent aphasia. Brain Lang 2010;113:13–20 [DOI] [PMC free article] [PubMed] [Google Scholar]
- 24.Klein A, Ghosh SS, Avants BB, et al. Evaluation of volume-based and surface-based brain image registration methods. Neuroimage 2010;51:214–220 [DOI] [PMC free article] [PubMed] [Google Scholar]
- 25.Avants BB, Epstein CL, Grossman M, Gee JC. Symmetric diffeomorphic image registration with cross-correlation: evaluating automated labeling of elderly and neurodegenerative brain. Med Image Anal 2008;12:26–41 [DOI] [PMC free article] [PubMed] [Google Scholar]
- 26.Oishi K, Faria A, van Zijl P, Mori S. MRI Atlas of Human White Matter, 2nd ed Amsterdam: Elsevier; 2011 [Google Scholar]
- 27.Geser F, Martinez-Lage M, Robinson J, et al. Clinical and pathological continuum of multisystem TDP-43 proteinopathies. Arch Neurol 2009;66:180–189 [DOI] [PMC free article] [PubMed] [Google Scholar]
- 28.Bird H, Lambon Ralph MA, Patterson K, Hodges JR. The rise and fall of verb frequency and imageability: noun and verb production in semantic dementia. Brain Lang 2000;73:17–49 [DOI] [PubMed] [Google Scholar]
- 29.Patterson K, McDonald MC. Sweet nothings: narrative speech in semantic dementia. In: Andrews S, editor. From Inkmarks to Ideas: Current Issues in Lexical Processing. Hove, UK: Psychology Press; 2006:299–317 [Google Scholar]
- 30.Bozeat S, Lambon Ralph MA, Patterson K, Hodges JR. When objects lose their meaning: what happens to their use? Cogn Affect Behav Neurosci 2002;2:236–251 [DOI] [PubMed] [Google Scholar]
- 31.Kertesz A, Jesso S, Harciarek M, Blair M, McMonagle P. What is semantic dementia? A cohort study of diagnostic features and clinical boundaries. Arch Neurol 2010;67:483–489 [DOI] [PubMed] [Google Scholar]
- 32.Bonner MF, Vesely L, Price C, et al. Reversal of the concreteness effect in semantic dementia. Cogn Neuropsychol 2009;26:568–579 [DOI] [PMC free article] [PubMed] [Google Scholar]
- 33.Grossman M, Mickanin J, Onishi K, et al. Progressive nonfluent aphasia: language, cognitive and PET measures contrasted with probable Alzheimer's disease. J Cogn Neurosci 1996;8:135–154 [DOI] [PubMed] [Google Scholar]
- 34.Friederici AD. The brain basis of language processing: from structure to function. Physiol Rev 2011;91:1357–1392 [DOI] [PubMed] [Google Scholar]
- 35.Dronkers NF. A new brain region for coordinating speech articulation. Nature 1996;384:159–161 [DOI] [PubMed] [Google Scholar]
- 36.Hickok G, Poeppel D. The cortical organization of speech processing. Nat Rev Neurosci 2007;8:393–402 [DOI] [PubMed] [Google Scholar]
Associated Data
This section collects any data citations, data availability statements, or supplementary materials included in this article.