

Abstract
Purpose
We developed an absolute risk model to identify individuals in the general population at elevated risk of pancreatic cancer.
Patients and Methods
Using data on 3,349 cases and 3,654 controls from the PanScan Consortium, we developed a relative risk model for men and women of European ancestry based on non-genetic and genetic risk factors for pancreatic cancer. We estimated absolute risks based on these relative risks and population incidence rates.
Results
Our risk model included current smoking (multivariable adjusted odds ratio (OR) and 95% confidence interval: 2.20 [1.84–2.62]), heavy alcohol use (>3 drinks/day) (OR: 1.45 [1.19–1.76]), obesity (body mass index >30 kg/m2) (OR: 1.26 [1.09–1.45]), diabetes >3 years (nested case-control OR: 1.57 [1.13–2.18], case-control OR: 1.80 [1.40–2.32]), family history of pancreatic cancer (OR: 1.60 [1.20–2.12]), non-O ABO genotype (AO vs. OO genotype) (OR: 1.23 [1.10–1.37]) to (BB vs. OO genotype) (OR 1.58 [0.97–2.59]), rs3790844(chr1q32.1) (OR: 1.29 [1.19–1.40]), rs401681(5p15.33) (OR: 1.18 [1.10–1.26]) and rs9543325(13q22.1) (OR: 1.27 [1.18–1.36]). The areas under the ROC curve for risk models including only non-genetic factors, only genetic factors, and both non-genetic and genetic factors were 58%, 57% and 61%, respectively. We estimate that fewer than 3/1,000 U.S. non-Hispanic whites have more than a 5% predicted lifetime absolute risk.
Conclusion
Although absolute risk modeling using established risk factors may help to identify a group of individuals at higher than average risk of pancreatic cancer, the immediate clinical utility of our model is limited. However, a risk model can increase awareness of the various risk factors for pancreatic cancer, including modifiable behaviors.
Introduction
Pancreatic Cancer is the 4th leading cause of cancer death in the United States [1]. While the lifetime risk (age 85) of pancreatic cancer for US Caucasians is only 1.5% [1], the five-year survival rate is less than 4.8%, the poorest of any major tumor type [1]. The primary reason for the poor survival rate is the high proportion of patients (>80%) who are diagnosed with locally advanced or metastatic disease. However, five-year survival rates for patients with early-stage resectable disease can exceed 20% [1], [2], underscoring the need to improve early detection. Numerous studies are underway to identify and validate promising biomarkers [3], [4] for early detection. In addition, several clinical studies have shown that imaging via e ndoscopic ultrasound, MRI or CT scan can detect pre-cancerous changes in the pancreas among high-risk individuals [5]–[8].
Given the low incidence of pancreatic cancer in the general population, widespread screening may not be practically feasible, even with a highly sensitive and specific test. Therefore, identification of individuals with substantially elevated risk will be important to the success of early detection studies. Pancreatic cancer tends to cluster in families and the heritability has been estimated to 0.36, indicating a strong genetic influence [9]. Although high-penetrance germline mutations have been identified, they only explain a small fraction of cases (less than 5%), indicating that many susceptibility variants (rare and common) remains to be identified. There appears to be no demographic differences between sporadic and familial pancreatic cancers. While there has been some suggestion that familial pancreatic cancers may have a slightly earlier age-of-onset (approximately 5 years) this finding has been inconsistent [10], [11]. No differences in the pathology of invasive pancreatic cancers in patients with familial vs non-familial pancreatic cancers have been reported [12] (A. Klein, unpublished work). However, non-invasive precursors are more common in patients with familial pancreatic cancer and these precursor lesions of higher-grade than the lesions that occur in patients without a family history [12]
Pancreatic cancer risk has been associated with cigarette smoking [13], heavy alcohol use [14], [15], diabetes mellitus [16], increased body mass index [17], family history of pancreatic cancer [18] and inherited genetic variation. Germline mutations in several genes, BRCA2, PALB2, p16, ATM, STK11, PRSS1, SPINK1 and DNA mis-match repair, have been associated with an increased pancreatic cancer risk [19]–[26]. In addition, two recently completed genome-wide association studies (GWAS), PanScan1 and PanScan2, have identified variants in ABO (rs505922), 1q32.1 (rs3790844), 13q22.1 (rs9543325) and 5p15.3 (rs401681) that are associated with a modestly increased risks of pancreatic cancer [27], [28]. The ABO single nucleotide polymorphism (SNP) rs505922 is in strong linkage disequilibrium with O/non-O blood group alleles indicating that individuals with non-O blood groups are at an increased risk of developing pancreatic cancer [29], [30]. In addition, haplotypes of SNPs rs505922 and rs8176746 are perfectly correlated with the O and B alleles, respectively [29], [30], and the assessment of both SNPs allow for complete discrimination between blood groups.
The aim of this study was to derive an absolute risk model for pancreatic cancer in the general population. By using data from both prospective cohort studies and retrospective case-control studies, we developed a relative risk model that included established risk factors for pancreatic cancer. We then estimated participants' absolute risk of developing pancreatic cancer by combining the derived risk model with incidence data from the SEER registries.
Methods
Study Population
The PanScan Consortium is comprised of 12 case-control studies nested within prospective cohorts and 8 retrospective case-control studies that participated in two GWAS of pancreatic cancer [27], [28]. The cohorts include: The Alpha-Tocopherol Beta-Carotene Prevention Study (ATBC), Give us a Clue to Cancer and Heart Disease Study (CLUEII), Cancer Prevention Study (CPSII), European Prospective Investigation Into Cancer and Nutrition Study (EPIC), Health Professionals Follow-Up Study (HPFS), Nurses' Health Study (NHS), The New York University, Women's Health Study (NYU-WHS), Physicians Health Study (PHS), Prostate, Lung, Colorectal Ovarian Cancer Screening Trial (PLCO), Shanghai Men's and Women's Health Study (SMWHS), Women's Health Initiative (WHI), and the Women's Health Study (WHS). The retrospective case-control studies were conducted at the Mayo Clinic, Yale University (Connecticut Pancreas Cancer Case Control Study), Group Health (Seattle Puget Sound) and Kaiser Permanente in Northern California (PACIFIC Study), Memorial Sloan Kettering Cancer Center, MD Anderson Cancer Center, University of California San Francisco, Johns Hopkins Medical School, and Mount Sinai Toronto.
Ethics Statement
The Institutional Review Boards approval, including approval of the consent procedure, was obtained for each of the studies as follows: ATBC and Ag.Health (National Cancer Institute Special Studies Institutional Review Board (SSIRB)), CLUE (Johns Hopkins School of Public Health (JHSPH) Institutional Review Board Office), CPS II (Emory University Institutional Review Board), EPIC (International Agency for Research on Cancer (IARC) Institutional Review Board Office), HPFS, WHS, NHS and PHS (Partners Healthcare System, Human Research Committee, Partners Human Research Office), PLCO (National Cancer Institute Special Studies Institutional Review Board (SSIRB)), SMWHS (Vanderbilt University Institutional Review Board), WHI (Fred Hutchinson Cancer Research Center Institutional Review Board), Group Health – PACIFIC (Group Health Research Institute, Human Subjects Review Office), JHU (Johns Hopkins Medicine, Office of Human Subjects Research, Institutional Review Board), MAYO (Mayo Clinic Institutional Review Board), MDA (MD Anderson Cancer Center, Office of Protocol Research, Institutional Review Board), MSKCC (Memorial Sloan-Kettering Cancer Center, Institutional Review Board/Privacy Board), TORONTO (University Health Network, Research Ethics Board),(UCSF) University of California San Francisco, Human Research Protection Program, Committee on Human Research, YALE (Yale University, Human Investigation Committee). Written consent was obtained from all study participants. In addition, because the National Cancer Institute is the coordinating center for the PanScan I and II studies, the National Cancer Institute Special Studies Institutional Review Board (SSIRB) reviewed and approved the PanScan protocol in its entirety.
A brief description of each study is provided in Tables S1 and S2. Genotype and covariate data were available for 3,851 cases and 3,924 controls. Analyses were restricted to non-Hispanic whites as four percent of study participants reported non-European ancestry (n = 493), precluding meaningful analyses within this subgroup. Participants with diabetes diagnosed (n = 467) within 3 years of pancreatic cancer diagnosis were excluded because of possible reverse causation. To ascertain potential confounding effects of diabetes proximal to pancreatic cancer diagnosis, we conducted sensitivity analyses including/excluding these participants as well as modeling an indicator variable denoting diabetes diagnosis within three years prior to pancreatic cancer diagnosis. Point estimates for the other key risk factors were not substantially changed among the models. A total of 3,349 cases and 3,654 controls were included in our analyses.
Description of covariate and SNP data
For each study, we collected information on age, sex, ethnicity, cigarette smoking history (never/former/current), history of diabetes mellitus (never/>3 years duration), body mass index (BMI, ≤30/>30), heavy alcohol consumption (≤3 drinks per day/>3 drinks per day), and family history of pancreatic cancer (yes/no). Age was defined as age at diagnosis for cases and age at interview for controls (Table 1). The following criteria were used to select risk factors for inclusion in the model 1) factor has been consistently associated with pancreatic cancer risk and 2) data was available from both the case-control and cohort studies. Missing covariate data were modeled using the missing indicator method where a separate ‘missing’ level is created within each covariate. Details on data collection for the various covariates have been described in previous publications [15], [17], [31], [32] Genotyping in PanScan has been described earlier [27], [28]. ABO alleles were derived from genotypes for rs505922 and rs8176746 as described previously [30]. Complete case analysis was conducted for the genotype data; the small number of participants for whom data were missing on at least one of the genetic markers (n = 6) were excluded from any analyses that included genetic risk factors.
Table 1. Participants' Characteristics, the PanScan Consortium.
| Characteristic | Cohort | Case-Control | ||
| Cases n (%) | Controls n (%) | Cases n (%) | Controls n (%) | |
| Sex | ||||
| Male | 676 (50) | 732 (51) | 1076 (54) | 1171 (53) |
| Female | 667 (50) | 713 (49) | 930 (46) | 1038 (47) |
| Age in years categories | ||||
| <50 | 39 (3) | 20 (1) | 184 (9) | 219 (10) |
| 51–60 | 185 (14) | 161 (11) | 498 (25) | 494 (22) |
| 61–65 | 241 (18) | 239 (17) | 339 (17) | 361 (16) |
| 66–70 | 290 (22) | 349 (24) | 328 (16) | 366 (16) |
| 71–75 | 290 (22) | 349(24) | 299 (15) | 369 (17) |
| 76–80 | 200(15) | 224(16) | 225 (11) | 270 (12) |
| 81+ | 98(7) | 103(7) | 133 (7) | 130 (6) |
| Cigarette smoking status | ||||
| Never smoker | 768(59) | 902(63) | 661 (39) | 900 (48) |
| Former smoker | 357(27) | 405(28) | 772 (45) | 820 (44) |
| Current smoker | 176(14) | 116(8) | 270 (15) | 154 (8) |
| Missing/Not Available | 42 | 22 | 293 | 315 |
| Diabetes mellitus | ||||
| Never | 1147(93) | 1309 (95) | 1103 (86) | 1352 (91) |
| >3 years duration | 89 (7) | 67 (5) | 181 (14) | 130 (9) |
| Unknown | 107 | 69 | 722 | 727 |
| Family history of pancreatic cancer | ||||
| No | 524 (94) | 577 (97) | 1507 (94) | 1620 (96) |
| Yes | 33 (6) | 20 (3) | 89 (6) | 66 (4) |
| Missing/Not Available | 786 | 848 | 410 | 523 |
| Heavy Alcohol Use (>3 drinks per day) | ||||
| No | 1083 (92) | 1188 (94) | 942 (85) | 1224 (90) |
| Yes | 99 (8) | 82 (6) | 168 (15) | 136 (10) |
| Missing/Not Available | 161 | 175 | 896 | 849 |
| Body Mass Index | ||||
| <18.5 | 10 (1) | 17 (1) | 16(1) | 17(1) |
| 18.5–25 | 499 (38) | 585 (41) | 574(38) | 695(40) |
| 25–30 | 565 (42) | 566 (39) | 606(40) | 723(42) |
| >30 | 256 (19) | 267 (19) | 323(21) | 287(17) |
| Missing/Not Available | 13 | 10 | 487 | 487 |
| ABO genotype | ||||
| O/O | 449 (33) | 603 (42) | 772 (38) | 961 (44) |
| A/O | 493 (37) | 498 (34) | 728 (36) | 773 (35) |
| A/A | 135 (10) | 102 (7) | 167 (8) | 159 (7) |
| B/O | 163 (12) | 152 (11) | 221 (11) | 215 (10) |
| B/B | 20 (2) | 11 (1) | 17 (1) | 19 (1) |
| A/B | 81 (6) | 78 (5) | 97 (5) | 80 (4) |
| 1q32 rs3790844 | ||||
| T/T | 835 (62) | 817 (57) | 1319 (66) | 1273 (58) |
| T/C | 436 (32) | 534 (37) | 605 (30) | 798 (36) |
| C/C | 72 (5) | 94 (7) | 82 (4) | 137 (6) |
| 5p15 rs401681 | ||||
| C/C | 376 (28) | 434 (30) | 506 (25) | 698 (32) |
| C/T | 649 (48) | 688 (48) | 1029 (51) | 1098 (50) |
| T/T | 318 (24) | 323 (22) | 471 (23) | 413 (19) |
| 13q22 rs9543325 | ||||
| T/T | 448(33) | 573 (40) | 670 (33) | 879 (40) |
| T/C | 672(50) | 683 (47) | 952 (47) | 1027 (47) |
| C/C | 223(17) | 189 (13) | 382 (19) | 302 (14) |
Statistical Methods
Before pooling data from the cohort and case-control studies, logistic regression models were fit separately to both the case-control and cohort data. We compared OR estimates for each risk factor from the case-control and cohort studies and looked for substantive differences. With the exception of history of diabetes mellitus, no substantive differences were observed. Data were pooled in the subsequent analysis.
To build a relative risk model for pancreatic cancer, we fit a logistic regression model for case-control status as a function of smoking history, history of diabetes, family history of pancreatic cancer, alcohol consumption, obesity and GWAS-identified risk markers including ABO blood group, adjusted for sex, age and study. In particular, we fit the following logistic regression model:
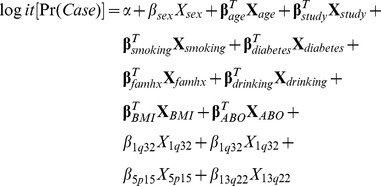 |
The terms X age, X study, X smoking et cetera are vectors of categorical indicator variables, corresponding to the categories in Tables 1 and 2. For example, a former smoker would have X smoker = (1,0,0)T, while a never smoker would have X smoker = (0,0,0)T. The SNPs X1q32, X5p15 and X13q22 were coded as counts of risk alleles, and Xsex was an indicator for female sex. We modeled the effect of history of diabetes mellitus separately for retrospective case-control and prospective nested case-control studies.
Table 2. Association between pancreatic cancer risk and smoking, personal history of diabetes, family history of pancreatic cancer, alcohol use, body mass index, and known genetic markers.
| Characteristic | Multivariate Odds Ratio (95% CI) Final Model |
| Cigarette smoking | |
| Never | 1.00 |
| Former | 1.22 (1.09, 1.37) |
| Current | 2.20 (1.84, 2.62) |
| Diabetes mellitus | |
| Never | 1.00 |
| >3 years duration (cohort studies) | 1.62 (1.15, 2.28) |
| Unknown (cohort studies) | 2.37 (1.64, 3.44) |
| >3 years duration (case-control studies) | 1.77 (1.37, 2.31) |
| Unknown (case-control studies) | 1.10 (0.80, 1.50) |
| Family history of pancreatic cancer | |
| No | |
| Yes | 1.00 |
| Heavy alcohol use (>3 drinks per day) | 1.60 (1.20, 2.12) |
| No | 1.00 |
| Yes | 1.45 (1.19, 1.76) |
| Body mass index | |
| <18.5 | 0.91 (0.54, 1.53) |
| 18.5–25 | 1.00 |
| 25–30 | 1.08 (0.96, 1.22) |
| >30 | 1.26 (1.09, 1.45) |
| ABO genotype | |
| OO | 1.00 |
| AO | 1.23 (1.10, 1.37) |
| AA | 1.49 (1.24, 1.79) |
| BO | 1.35 (1.15, 1.59) |
| BB | 1.58 (0.97, 2.59) |
| AB | 1.44 (1.15, 1.81) |
| 1q32 rs3790844 (per risk allele) | 1.29 (1.19, 1.40) |
| 5p15 rs401681 (per risk allele) | 1.18 (1.10, 1.26) |
| 13q22 rs9543325 (per risk allele) | 1.27 (1.18, 1.36) |
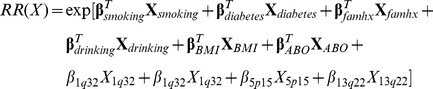
Given estimates of the log odds ratios, we calculated the relative risk for an individual with a specific risk profile 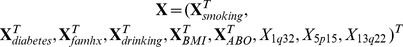 as follows:
 |
This relative risk model was then used to calculate Receiver Operating Characteristic (ROC) curves (by comparing the distribution of ORs in cases versus controls) and age-specific incidence rates (described below). We also fit relative risk models a) excluding the genetic factors and b) including only the genetic factors, in order to compare the relative contribution of genetic and non-genetic factors to risk prediction.
We calculated the area under the ROC curves using the Mann-Whitney statistic and compared the areas for different models using the method described by DeLong et al. [33] as implemented in SAS PROC LOGISTIC. These calculations were performed in the subset of data with no missing genetic or non-genetic covariate data (435 cases and 458 controls from the cohort studies and 885 cases and 1,093 controls from the case-control studies).
Age-specific incidence for an individual with risk factor profile X was calculated as ρSEX(t) RR(X), where the sex-specific baseline incidence rate ρSEX(t) was calculated as the appropriate sex-and age-specific average incidence rate divided by the average relative risk in controls with no missing covariate data [34]. Average incidence rates by age for white men and women were based on SEER (Surveillance, Epidemiology and End Results, http://seer.cancer.gov/) data for years 2000–2008 (SEER17). The baseline incidence was the incidence among participants who had never smoked, had never been diagnosed with diabetes, had no family history of pancreatic cancer, drank an average of ≤3 alcoholic drinks/day, had an adult BMI between 18.5 and 25, and did not carry any of the risk alleles at the four known risk loci. Lifetime risks were calculated by integrating the age-specific incidence rates, accounting for mortality due to other causes [34], [35].
To examine the value of adding genotype data to a classic non-genetic risk prediction tool, we plotted the estimated lifetime risk for cases and controls based on a model without genetic factors and a model with genetic factors. We also calculated the net reclassification index (NRI) for men and women separately, using twice the average lifetime risk to define high and low risk categories [36], [37].
Results
Demographic and risk factor characteristics of study participants are presented in Table 1. Multivariable adjusted odds ratios (OR) are presented in Table 2 for the association between the risk factors included in our model and pancreatic cancer. In our study population, current smoking was associated with an increased risk of pancreatic cancer (OR: 2.21, 95% confidence interval [CI] 1.85, 2.64) as were heavy alcohol use (OR 1.37, 95%CI 1.12, 1.68), BMI >30 (OR 1.20, 95%CI 1.04, 1.40), diabetes of >3 year duration (cohort OR 1.62, 95%CI 1.15, 2.28; case-control OR: 1.77, 95%CI: 1.37, 2.31) and family history of pancreatic cancer (OR 1.58, 95%CI: 1.19, 2.11). In addition, all four genetic variants tested were associated with pancreatic cancer (OR for non-O ABO genotypes ranged from 1.25 to 1.58, and the per-allele odds ratios for the other three risk SNPs ranged from 1.18 to 1.49).
The area under the ROC curve (AUROC) for a risk model including only genetic factors was 57% (95%CI 0.55–0.59), whereas the AUROC for a model including only non-genetic factors was 58% (95%CI 0.56–0.60). The AUROC for a model including both genetic and non-genetic factors was 61% (95%CI 0.58–0.63), which was statistically significantly larger than both the model including only non-genetic factors and the model including only genetic factors (p<0.0001).
Figure 1 displays the ten-year risks of pancreatic cancer for men and women in different age categories (51–60, 61–65, 66–70, 71–75, and 76–80) as a function of risk percentile based on a model including all risk factors (see Methods). This figure demonstrates the importance of age as predictor of pancreatic cancer risk, with risk increasing with increasing age. Only a few individuals had a 10 year absolute risk greater than 2% even if all genetic and non-genetic risk factors were present.
Figure 1. Ten-year risks of pancreatic cancer (y-axis), by age, gender, and risk score percentile (x-axis).

The risk score includes smoking history, heavy alcohol intake, BMI, history of diabetes, family history of pancreatic cancer, ABO genotype and three common genetic variants associated with pancreatic cancer.
Figure 2 shows the distribution of estimated lifetime risks for models that include or do not include genetic factors. Individual risks varied slightly depending on which model was used to estimate them. The median difference in lifetime risk estimates from the model with genetics to the model without genetics was 0.0% (inter-quartile range −0.2% to 0.2%) for both male and female controls. The NRI comparing the risk model with genetics to the risk model with no genetic factors was −0.010±0.0.008 and −0.020±0.011 for men and women respectively (Table 3). Neither of these estimates was statistically significant (one-sided p = 0.89 and p = 0.97, respectively), suggesting that adding genetic factors to the risk model did not improve clinical utility (defined as the ability to correctly classify individuals at twice average risk).
Figure 2. Reclassification of lifetime risk of pancreatic cancer among cohort controls after adding genetic information to the risk model.

Table 3. Reclassification of lifetime risk of pancreatic cancer after adding genetic information to the risk model with both genetic and non-genetic covariates.
| Men | Women | ||||
| Risk model with non-genetic covariates only | Less than twice average lifetime risk (≤2.94%) | More than twice average lifetime risk (>2.94%) | Less than twice average lifetime risk (≤2.62%) | More than twice average lifetime risk (>2.62%) | |
| Controls | Less than twice | 858 | 11 | 620 | 20 |
| average risk | |||||
| More than twice | 9 | 20 | 2 | 7 | |
| average risk | |||||
| Cases | Less than twice | 716 | 10 | 517 | 11 |
| average risk | |||||
| More than twice | 16 | 28 | 7 | 15 | |
| average risk |
As expected, considering that we included established risk factors for pancreatic cancer in our non-genetic risk model, this model improved classification relative to a null model that classified individuals according to their sex-specific average. The NRI comparing the model with non-genetic risk factors alone to this null model was 0.025±0.010 (one-sided p = 0.009) for men and 0.026±0.010 (one-sided p = 0.0004) for women. However, because we evaluated model performance in the same data set used to build the risk model, these NRIs may be somewhat overestimated. Moreover, it is unclear whether twice the average lifetime risk is a clinically actionable threshold: only 8.4% of male cases (3.5% of female) have more than twice the average lifetime risk. Most of those identified as high risk will not go on to develop pancreatic cancer, because the average lifetime risks in both men and women are low. Twice the average lifetime risk is 2×1.47% = 2.94% in men and 2×1.31% = 2.62% in women, and 96.3% of men and 96.6% of women above these risk thresholds will not develop pancreatic cancer in their lifetimes.
The risk models with and without the genetic variables do not identify subsets of individuals at very high lifetime risks. Using controls to estimate the distribution of risks in U.S. non-Hispanic whites, 4/1,000 men and 2/1,000 women would be classified as having lifetime risk greater than 5%, and none would be classified as having more than 7% lifetime risk.
Discussion
In this study, we generated a pancreatic cancer risk model based on established non-genetic and genetic risk factors and calculated absolute risks based on relative risk estimates and US incidence. The risk factors considered were smoking, heavy alcohol intake, high BMI, diabetes, family history of pancreatic cancer, ABO non-O blood group and three common genetic variants identified by GWAS. We found that even if all these known risk factors are included in the model, most individuals will only be at modestly increased risks because relatively few individuals have a high number of risk factors. In addition, we found that the genetic factors did not add substantively to a risk model based on life-style factors only, as most individuals remained in the same risk strata.
The low absolute risks observed here for most individuals, together with the current lack of non-invasive and low cost screening tools, argue against screening programs for the general population and underscore the importance of research to identify novel risk markers. Given the very high mortality rate of pancreatic cancer, it remains an open question whether future screening tools could be implemented for individuals in the population who are at the highest risks, for example individuals with estimated lifetime risks above 5%. It is important to note that our model does not account for known high-penetrant genetic variants or strong familial risk. Individuals with a strong family history of cancer may benefit from genetic counseling. For such individuals genetic counseling in conjunction with the PancPRO [38] model can provide individual level risk estimates.
This study is based on data from a series of cohort and case-control studies and constitutes the largest risk model analysis of pancreatic cancer to date. It is also the first risk model for pancreatic cancer that includes non-genetic risk factors. Our model can easily be modified to include any new discovered risk factors.
Our study has several limitations. As with all risk scores that include genetic variants identified from GWAS, we are most likely including proxies for the causative genetic variants. Identification of the causal alleles might result in better performance in our model. Moreover, by focusing on genome-wide significant markers, we are not including markers that are truly associated with pancreatic cancer risk but did not achieve statistical significance. More sophisticated multivariable modeling techniques might be able to use these latent risk markers to improve predictive ability, but these methods greatly increase the risk of overfitting and require sample sizes an order of magnitude larger than the number of cases and controls used in this study [39], [40].
We only measured modifiable risk factors during one point in time. As these risk factors may change over time, our assessment does not completely capture the cumulative lifetime exposure. We categorized continuous variables in order to balance model parsimony and flexibility; however, this approach may have led to a loss of fine-scale information on exposure distribution. The list of non-genetic risk factors included here is not complete and future studies should consider other risk factors. Here we limited the list of non-genetic factors to well-established non-genetic risk factors that were assessed in our study population. For example, information on chronic pancreatitis was not included in these analyses due to limited availability of pancreatitis data from the cohorts and the low prevalence of this disease. We included data from both prospective cohort studies and retrospective case-control studies. For the prospective data exposure information may have changed between data collection and occurrence of pancreatic cancer, while retrospective data can be subject to recall bias. However, the risk estimates were consistent across study designs for all exposures other than diabetes mellitus (Table S3).
Our model does not directly measure absolute risk but rather relies on incidence estimates from the SEER data. We used our controls data to estimate the distribution of risk factors among U.S. non-Hispanic whites. The distribution of risk factors in these controls is likely different than that of the general U.S. population, as cohort participants are likely healthier and risk factors such as smoking are less prevalent, and not all studies were based in the United States. These differences may have affected our risk estimates in several ways. On the one hand, we may have underestimated the proportion of U.S. non-Hispanic whites who would be classified as high risk. On the other hand, by underestimating the average relative risk (which is inversely related to the baseline risk), we may have overestimated risk for individuals with particular genetic and non-genetic profiles. Given that lifetime risk estimates remained quite low (most less than 5% and all less than 7.5%) with little variation across the study population, this possible overestimation does not impact our conclusions on the utility of this model.
Our analysis is based solely on a population of European ancestry, so it cannot be generalized to other ethnicities, some of which have a greater risk of pancreatic cancer [42].
Model fit and reclassification were assessed in the same populations used to obtain the risk estimates for the model; therefore, it is possible that the results presented here overestimate how the risk model would perform in an independent study population. However, we deliberately chose a parsimonious approach to modeling, focusing on well-established risk factors, in order to minimize the risk of overfitting [41]. The risk estimates for non-genetic covariates observed in this study are consistent with the existing literature; thus, we would expect our non-genetic model to perform similarly in other non-Hispanic white populations. Because the genetic risk markers were discovered in this set of samples [27], [28], the per-allele odds ratios for these markers may be overestimated due to the “winner's curse” phenomenon [42]. We used the weighted maximum likelihood method of Zhong and Prentice to adjust for inflation due to winner's curse [43]. The effects at the ABO and 13q22 loci were not appreciably inflated; the estimates for rs3790844 at chr1q32.1 and rs401681 at 5p15.33 were slightly inflated, with inflation factors of 2% and 7%, respectively. The AUROCs using the winner's-curse-adjusted per-allele odds ratio estimates change only slightly: AUROC = 0.55 (0.53,0.47) for the model using risk alleles alone (as compared to 0.57) and c = 0.60 (0.58,0.62) for the model with both the risk alleles and clinical risk factors (as compared to 0.61).
In summary, in a large study sample, we derived an absolute- risk model for pancreatic cancer and used our model to estimate risks in the Non-Hispanic White US population. We found that although all risk factors were individually associated with pancreatic cancer, the low frequencies of many of the exposures, along with the small magnitudes of their risks and even that of their aggregated sum resulted in relatively low ten-year absolute risks. Thus, absolute risk modeling can identify a subset of the general population at higher than average risk of pancreatic cancer, but with the risk factors so far considered, the clinical utility of such general population models at this time may be limited.
Supporting Information
Case-control studies in PanScan.
(DOC)
Nested case-control studies from cohorts in PanScan.
(DOC)
Association between pancreatic cancer risk and smoking, personal history of diabetes, family history of pancreatic cancer, alcohol use, body mass index, and known genetic markers stratified by study design (case-control vs cohort).
(DOCX)
Funding Statement
The NYU Women's Health Study is supported by research grants R01CA034588, R01CA098661, center grant P30CA016087 from the NCI and the center grant ES000260 from the National Institute of Environmental Health Sciences. The WHI program is funded by the National Heart, Lung, and Blood Institute, NIH, through contracts N01WH22110, 24152, 32100-2, 32105-6, 32108-9, 32111-13, 32115, 32118-32119, 32122, 42107-26, 42129-32, and 44221. The Mayo Clinic Molecular Epidemiology of Pancreatic Cancer study is supported by the Mayo Clinic SPORE in Pancreatic Cancer (P50 CA102701). The authors would like to acknowledge Traci Hammer, Jodi Cogswell, Hugues Sicotte, Ann Oberg, Janet Olson, Martha Matsumoto, and Dennis Robinson. The Yale University study was supported by grant number 5R01CA098870 from the NCI, NIH. The cooperation of 30 Connecticut hospitals, including Stamford Hospital, in allowing patient access, is gratefully acknowledged. This study was approved by the State of Connecticut Department of Public Health Human Investigation Committee. Certain data used in this study were obtained from the Connecticut Tumor Registry in the Connecticut Department of Public Health. The authors assume full responsibility for analyses and interpretation of these data. The PHS, NHS, HPFS and WHS at Harvard were supported by the NCI, NIH (Grants No. P01 CA87969, P01 CA55075, P50 CA127003, R01 CA124908, RO1 CA97193, RO1 CA34944, RO1 CA40360, RO1 HL26490, RO1 HL34595, RO1 CA047988, RO1 HL043851, RO1 HL080467). The work at Johns Hopkins University was supported by the NCI (Grants P50CA62924 and R01CA97075) and the Lustgarten Foundation for Pancreatic Cancer Research. The Shanghai Men's Health Study was supported by the National Cancer Institute extramural research grant [R01 CA82729]. The Shanghai Women's Health Study was supported by the National Cancer Institute extramural research grant [R37 CA70867] and, partially for biological sample collection, by the Intramural Research Program of National Cancer Institute (Division of Cancer Epidemiology and Genetics). The authors are in debt to the contributions of Drs. Yu-Tang Gao and Yong-Bing Xiang in these two cohort studies. The studies would not be possible without the continuing support and devotion from the study participants and staff of the SMHS and SWHS. Memorial Sloan Kettering Cancer Center acknowledges the work of Jennifer A. Simon and Irene Orlow. The work at MD Anderson was supported by NIH grant RO1 CA98380. The UCSF study was supported in part by National Cancer Institute grants CA59706, CA108370, CA109767, CA89726 (E.A. Holly, PI) and CA98889 (E.J. Duell, PI) and by the Rombauer Pancreatic Cancer Research Fund. The University of Toronto study was supported by grants from the NIH (R01 CA97075, as part of the PACGENE consortium), The Lustgarten Foundation for Pancreatic Cancer Research and the Ontario Cancer Research Network. The authors acknowledge the Pancreatic Cancer Canada Foundation (www.pancreaticcancercanada.ca) for their continued support of research into the early detection of pancreatic cancer, and the Pancreas Cancer Screening Study at Mount Sinai Hospital and Princess Margaret Hospital. The authors acknowledge Ayelet Borgida and Heidi Rothenmund for their dedicated contributions towards data collection and study co-ordination. PLCO was supported by individual contracts from the NCI to the University of Colorado Denver NO1-CN-25514, Georgetown University NO1-CN-25522, Pacific Health Research Institute NO1-CN-25515, Henry Ford Health System NO1-CN-25512, University of Minnesota, NO1-CN-25513, Washington University NO1-CN-25516, University of Pittsburgh NO1-CN-25511, University of Utah NO1-CN-25524, Marshfield Clinic Research Foundation NO1-CN-25518, University of Alabama at Birmingham NO1-CN-75022, Westat, Inc. NO1-CN-25476, University of California, Los Angeles NO1-CN-25404. The ATBC Study was supported by funding provided by the Intramural Research Program of the NCI, NIH, and through U.S. Public Health Service contracts (N01-CN-45165, N01-RC-45035, and N01-RC-37004) from the NCI. For the EPIC cohorts, all coauthors coordinated the initial recruitment and management of the studies. The authors thank all of the participants who took part in this research and the funders and support and technical staff who made this study possible. The work described in this paper was carried out with the support of the European Commission: Public Health and Consumer Protection Directorate 1993–2004; Research Directorate-General 2005-.”; Ligue contre le Cancer, Societé 3M, Mutuelle Générale de l'Education Nationale, Institut National de la Santé et de la Recherche Médicale (INSERM) (France); German Cancer Aid, German Cancer Research Center, Federal Ministry of Education and Research (Germany); Danish Cancer Society (Denmark); ISCIII RETIC (RD06/0020) of the Spanish Ministry of Health, The participating regional governments and institutions (Spain); Cancer Research UK, Medical Research Council, Stroke Association, British Heart Foundation, Department of Health, Food Standards Agency, the Wellcome Trust (United Kingdom); Greek Ministry of Health and Social Solidarity, Hellenic Health Foundation and Stavros Niarchos Foundation (Greece); Italian Association for Research on Cancer (AIRC) (Italy); Dutch Ministry of Public Health, Welfare and Sports, Dutch Prevention Funds, LK Research Funds, Dutch ZON (Zorg Onderzoek Nederland), World Cancer Research Fund (WCRF) (the Netherlands); Swedish Cancer Society, Swedish Scientific Council, Regional Government of Skane and Västerbotten (Sweden). CLUE II was supported by National Institute of Aging grant (5U01AG018033) and National Cancer Institute grants (CA105069, CA73790). The authors express their appreciation to the participants of the CLUE II cohort and thank the staff at the George W. Comstock Center for Public Health Research and Prevention for their dedication and contributions to the study: Judy Hoffman-Bolton, Clara Krumpe, Kitty Spoonire and Betty Miner. The Cancer Prevention Study II Nutrition Cohort is supported by the American Cancer Society. The authors thank all of the men and women in the Cancer Prevention Study II Nutrition Cohort for their many years of dedicated participation in the study. The authors wish to thank Debbie Winn, Daniela Seminara and Scott Rogers for assisting with funding coordination for the project and Donghui Li for supporting the study with supplemental grant CA98380. This project has been funded in whole or in part with federal funds from the National Cancer Institute, National Institutes of Health, under Contract No. HHSN261200800001E. The content of this publication does not necessarily reflect the views or policies of the Department of Health and Human Services, nor does mention of trade names, commercial products, or organizations imply endorsement by the U.S. Government. The authors acknowledge the contribution of the staff of the Core Genotyping Facility, specifically, Zhaoming Wang, Chenwei Liu, Xiang Deng, Laurie Burdett, Aurelie Vogt, and Belynda Hicks. The funders had no role in study design, data collection and analysis, decision to publish, or preparation of the manuscript.
References
- 1.Howlader N, Noone A, Krapcho M, Neyman N, Aminou R, et al. (2011) SEER Cancer Statistics Review, 1975–2008. National Cancer Institute. Bethesda, MD. [Google Scholar]
- 2. Winter JM, Cameron JL, Campbell KA, Arnold MA, Chang DC, et al. (2006) 1423 pancreaticoduodenectomies for pancreatic cancer: A single-institution experience. J Gastrointest Surg 10: 1199–1210; discussion 1210–1191. [DOI] [PubMed] [Google Scholar]
- 3. Gold DV, Goggins M, Modrak DE, Newsome G, Liu M, et al. (2010) Detection of early-stage pancreatic adenocarcinoma. Cancer Epidemiol Biomarkers Prev 19: 2786–2794. [DOI] [PMC free article] [PubMed] [Google Scholar]
- 4. Gronborg M, Bunkenborg J, Kristiansen TZ, Jensen ON, Yeo CJ, et al. (2004) Comprehensive proteomic analysis of human pancreatic juice. J Proteome Res 3: 1042–1055. [DOI] [PubMed] [Google Scholar]
- 5. Canto MI, Goggins M, Hruban RH, Petersen GM, Giardiello FM, et al. (2006) Screening for early pancreatic neoplasia in high-risk individuals: a prospective controlled study. Clin Gastroenterol Hepatol 4: 766–781; quiz 665. [DOI] [PubMed] [Google Scholar]
- 6. Canto MI, Goggins M, Yeo CJ, Griffin C, Axilbund JE, et al. (2004) Screening for pancreatic neoplasia in high-risk individuals: an EUS-based approach. Clin Gastroenterol Hepatol 2: 606–621. [DOI] [PubMed] [Google Scholar]
- 7. Poley JW, Kluijt I, Gouma DJ, Harinck F, Wagner A, et al. (2009) The yield of first-time endoscopic ultrasonography in screening individuals at a high risk of developing pancreatic cancer. Am J Gastroenterol 104: 2175–2181. [DOI] [PubMed] [Google Scholar]
- 8. Verna EC, Hwang C, Stevens PD, Rotterdam H, Stavropoulos SN, et al. (2010) Pancreatic cancer screening in a prospective cohort of high-risk patients: a comprehensive strategy of imaging and genetics. Clin Cancer Res 16: 5028–5037. [DOI] [PubMed] [Google Scholar]
- 9. Lichtenstein P, Holm NV, Verkasalo PK, Iliadou A, Kaprio J, et al. (2000) Environmental and heritable factors in the causation of cancer–analyses of cohorts of twins from Sweden, Denmark, and Finland. N Engl J Med 343: 78–85. [DOI] [PubMed] [Google Scholar]
- 10. Petersen GM, de Andrade M, Goggins M, Hruban RH, Bondy M, et al. (2006) Pancreatic cancer genetic epidemiology consortium. Cancer Epidemiol Biomarkers Prev 15: 704–710. [DOI] [PubMed] [Google Scholar]
- 11. Klein AP, Brune KA, Petersen GM, Goggins M, Tersmette AC, et al. (2004) Prospective risk of pancreatic cancer in familial pancreatic cancer kindreds. Cancer Res 64: 2634–2638. [DOI] [PubMed] [Google Scholar]
- 12. Shi C, Klein AP, Goggins M, Maitra A, Canto M, et al. (2009) Increased Prevalence of Precursor Lesions in Familial Pancreatic Cancer Patients. Clin Cancer Res 15: 7737–7743. [DOI] [PMC free article] [PubMed] [Google Scholar]
- 13. Iodice S, Gandini S, Maisonneuve P, Lowenfels AB (2008) Tobacco and the risk of pancreatic cancer: a review and meta-analysis. Langenbecks Arch Surg 393: 535–545. [DOI] [PubMed] [Google Scholar]
- 14. Lucenteforte E, La Vecchia C, Silverman D, Petersen GM, Bracci PM, et al. (2011) Alcohol consumption and pancreatic cancer: a pooled analysis in the International Pancreatic Cancer Case-Control Consortium (PanC4). Ann Oncol [DOI] [PMC free article] [PubMed] [Google Scholar]
- 15. Michaud DS, Vrieling A, Jiao L, Mendelsohn JB, Steplowski E, et al. (2010) Alcohol intake and pancreatic cancer: a pooled analysis from the pancreatic cancer cohort consortium (PanScan). Cancer Causes Control 21: 1213–1225. [DOI] [PMC free article] [PubMed] [Google Scholar]
- 16. Ben Q, Xu M, Ning X, Liu J, Hong S, et al. (2011) Diabetes mellitus and risk of pancreatic cancer: A meta-analysis of cohort studies. Eur J Cancer 47: 1928–1937. [DOI] [PubMed] [Google Scholar]
- 17. Arslan AA, Helzlsouer KJ, Kooperberg C, Shu XO, Steplowski E, et al. (2010) Anthropometric measures, body mass index, and pancreatic cancer: a pooled analysis from the Pancreatic Cancer Cohort Consortium (PanScan). Arch Intern Med 170: 791–802. [DOI] [PMC free article] [PubMed] [Google Scholar]
- 18. Permuth-Wey J, Egan KM (2009) Family history is a significant risk factor for pancreatic cancer: results from a systematic review and meta-analysis. Fam Cancer 8: 109–117. [DOI] [PubMed] [Google Scholar]
- 19. Goggins M, Schutte M, Lu J, Moskaluk CA, Weinstein CL, et al. (1996) Germline BRCA2 gene mutations in patients with apparently sporadic pancreatic carcinomas. Cancer Res 56: 5360–5364. [PubMed] [Google Scholar]
- 20. Jones S, Hruban RH, Kamiyama M, Borges M, Zhang X, et al. (2009) Exomic sequencing identifies PALB2 as a pancreatic cancer susceptibility gene. Science 324: 217. [DOI] [PMC free article] [PubMed] [Google Scholar]
- 21. Kastrinos F, Mukherjee B, Tayob N, Wang F, Sparr J, et al. (2009) Risk of pancreatic cancer in families with Lynch syndrome. Jama 302: 1790–1795. [DOI] [PMC free article] [PubMed] [Google Scholar]
- 22. Murphy KM, Brune KA, Griffin C, Sollenberger JE, Petersen GM, et al. (2002) Evaluation of candidate genes MAP2K4, MADH4, ACVR1B, and BRCA2 in familial pancreatic cancer: deleterious BRCA2 mutations in 17%. Cancer Res 62: 3789–3793. [PubMed] [Google Scholar]
- 23. Vasen HF, Gruis NA, Frants RR, van Der Velden PA, Hille ET, et al. (2000) Risk of developing pancreatic cancer in families with familial atypical multiple mole melanoma associated with a specific 19 deletion of p16 (p16-Leiden). Int J Cancer 87: 809–811. [PubMed] [Google Scholar]
- 24. Whitcomb DC, Gorry MC, Preston RA, Furey W, Sossenheimer MJ, et al. (1996) Hereditary pancreatitis is caused by a mutation in the cationic trypsinogen gene. Nat Genet 14: 141–145. [DOI] [PubMed] [Google Scholar]
- 25. Whitcomb DC, Preston RA, Aston CE, Sossenheimer MJ, Barua PS, et al. (1996) A gene for hereditary pancreatitis maps to chromosome 7q35. Gastroenterology 110: 1975–1980. [DOI] [PubMed] [Google Scholar]
- 26. Roberts NJ, Jiao Y, Yu J, Kopelovich L, Petersen GM, et al. (2012) ATM Mutations in Patients with Hereditary Pancreatic Cancer. Cancer Discovery 2. [DOI] [PMC free article] [PubMed] [Google Scholar]
- 27. Amundadottir L, Kraft P, Stolzenberg-Solomon RZ, Fuchs CS, Petersen GM, et al. (2009) Genome-wide association study identifies variants in the ABO locus associated with susceptibility to pancreatic cancer. Nat Genet 41: 986–990. [DOI] [PMC free article] [PubMed] [Google Scholar]
- 28. Petersen GM, Amundadottir L, Fuchs CS, Kraft P, Stolzenberg-Solomon RZ, et al. (2010) A genome-wide association study identifies pancreatic cancer susceptibility loci on chromosomes 13q22.1, 1q32.1 and 5p15.33. Nat Genet 42: 224–228. [DOI] [PMC free article] [PubMed] [Google Scholar]
- 29. Wolpin BM, Chan AT, Hartge P, Chanock SJ, Kraft P, et al. (2009) ABO blood group and the risk of pancreatic cancer. J Natl Cancer Inst 101: 424–431. [DOI] [PMC free article] [PubMed] [Google Scholar]
- 30. Wolpin BM, Kraft P, Gross M, Helzlsouer K, Bueno-de-Mesquita HB, et al. (2010) Pancreatic cancer risk and ABO blood group alleles: results from the pancreatic cancer cohort consortium. Cancer Res 70: 1015–1023. [DOI] [PMC free article] [PubMed] [Google Scholar]
- 31. Jacobs EJ, Chanock SJ, Fuchs CS, Lacroix A, McWilliams RR, et al. (2010) Family history of cancer and risk of pancreatic cancer: a pooled analysis from the Pancreatic Cancer Cohort Consortium (PanScan). International journal of cancer Journal international du cancer 127: 1421–1428. [DOI] [PMC free article] [PubMed] [Google Scholar]
- 32. Lynch SM, Vrieling A, Lubin JH, Kraft P, Mendelsohn JB, et al. (2009) Cigarette smoking and pancreatic cancer: a pooled analysis from the pancreatic cancer cohort consortium. American journal of epidemiology 170: 403–413. [DOI] [PMC free article] [PubMed] [Google Scholar]
- 33. DeLong ER, DeLong DM, Clarke-Pearson DL (1988) Comparing the areas under two or more correlated receiver operating characteristic curves: a nonparametric approach. Biometrics 44: 837–845. [PubMed] [Google Scholar]
- 34. Dupont WD (1989) Converting relative risks to absolute risks: a graphical approach. Stat Med 8: 641–651. [DOI] [PubMed] [Google Scholar]
- 35. Harrington D, Gail MH (2008) Lifetime data analysis. Editorial. Lifetime Data Anal 14: 1–5. [DOI] [PubMed] [Google Scholar]
- 36. Roberts NJ, Vogelstein JT, Parmigiani G, Kinzler KW, Vogelstein B, et al. (2012) The Predictive Capacity of Personal Genome Sequencing. Sci Transl Med [DOI] [PMC free article] [PubMed] [Google Scholar]
- 37. Pencina MJ, D'Agostino RB Sr, D'Agostino RB Jr, Vasan RS (2008) Evaluating the added predictive ability of a new marker: from area under the ROC curve to reclassification and beyond. Stat Med 27: 157–172; discussion 207–112. [DOI] [PubMed] [Google Scholar]
- 38. Wang W, Chen S, Brune KA, Hruban RH, Parmigiani G, et al. (2007) PancPRO: risk assessment for individuals with a family history of pancreatic cancer. J Clin Oncol 25: 1417–1422. [DOI] [PMC free article] [PubMed] [Google Scholar]
- 39. Machiela MJ, Chen CY, Chen C, Chanock SJ, Hunter DJ, et al. (2011) Evaluation of polygenic risk scores for predicting breast and prostate cancer risk. Genetic Epidemiology 35: 506–514. [DOI] [PMC free article] [PubMed] [Google Scholar]
- 40. Chatterjee N, Wheeler B, Sampson J, Hartge P, Chanock SJ, et al. (2013) Projecting the performance of risk prediction based on polygenic analyses of genome-wide association studies. Nat Genet [DOI] [PMC free article] [PubMed] [Google Scholar]
- 41. Steyerberg EW (2009) Clinical Prediction Models: A Practical Approach to Development, Validation, and Updating:. Springer [Google Scholar]
- 42. Kraft P (2008) Curses–winner's and otherwise–in genetic epidemiology. Epidemiology 19: 649–651; discussion 657–648. [DOI] [PubMed] [Google Scholar]
- 43. Zhong H, Prentice RL (2008) Bias-reduced estimators and confidence intervals for odds ratios in genome-wide association studies. Biostatistics [DOI] [PMC free article] [PubMed] [Google Scholar]
Associated Data
This section collects any data citations, data availability statements, or supplementary materials included in this article.
Supplementary Materials
Case-control studies in PanScan.
(DOC)
Nested case-control studies from cohorts in PanScan.
(DOC)
Association between pancreatic cancer risk and smoking, personal history of diabetes, family history of pancreatic cancer, alcohol use, body mass index, and known genetic markers stratified by study design (case-control vs cohort).
(DOCX)