Abstract
The prostate biopsy method shows a high false negative result because the suspicious tissue considered as cancer is not confirmed during tissue sampling. Thus, repeated biopsy procedures and diagnostic errors in relation to prostate cancer frequently occur. The purpose of this research is to enhance the prostate cancer detection rate by using microfluidic electrical impedance spectroscopy (μEIS), which allows real-time measurement of the electrical impedance of a single human prostate normal cell and cancer cell. The μEIS was equipped with a movable flexible membrane, which is operated by pneumatic pressure to capture the single cell on the surface of sensing electrodes. The forced tight contact between the cell and electrodes makes it possible to measure the electrical characteristics of the cell with a high sensitivity. The μEIS discriminates well between normal human prostate cells (RWPE-1) and cancer cells (PC-3) at 8.7 kHz based on the electrical signal responses of the cells. The average difference rates of admittance magnitude and susceptance are 54.55% and 54.59%, respectively. The developed μEIS also shows high repeatability, which was verified by a deionized water test conducted before and after each cell assay; the maximum variance of both the impedance and admittance at 8.7 kHz was as small as 9.48%.
INTRODUCTION
Globally, prostate cancer is estimated to be the second most common new cancer and the sixth most common cause of death in males.1 Mortalities and morbidities of prostate cancer are becoming great health burden for the males in the world. The screening of prostate cancer is based on digital rectal examination and prostate specific antigen (PSA) test. The PSA test, a widely used method to diagnose prostate cancer, measures small quantities of the glycoprotein enzyme secreted by the prostate.2 PSA is detected by a blood test, and the PSA level is often elevated when not only prostate cancer but also other prostate diseases (benign prostatic hyperplasia and prostatic inflammation).3 For these reasons, the prostate biopsy, a direct assay of the prostate tissue suspected as a cancer, is an essential procedure to confirm prostate cancer. Nowadays, transrectal ultrasonography (TRUS) guided biopsy is the golden standard for detecting prostate cancer. However, one-quarter of prostate cancers are identified after an initial negative biopsy.4 TRUS guided biopsy method shows a high level of false negative results, which necessitates repetition of the biopsy procedure and is associated with diagnostic error in relation to prostate cancer.5 Furthermore, possibility of complications (febrile urinary tract infection, hematuria, hemospermia, pain, sepsis) after biopsy procedure is an important issue.6 A current technique of the prostate biopsy using magnetic resonance imaging (MRI) fused with ultrasound has been shown to be superior to the TRUS guided biopsy.7 But general ability of MRI/ultrasound fusion is limited and should be reserved for specific patients.8
Diagnostic methods using the electrical characteristics of cells have proven to be cost effective, much faster, and less invasive than mechanical measurement techniques.9 Approaches based on electrical impedance can also replace general biochemistry-based diagnostics. Electrical impedance spectroscopy (EIS) is an analytic tool that is widely known as a detection method for electrical properties of tissues or cells in the frequency domain.10, 11 This method provides quantitative information of the tissues or cells, such as resistance, conductance, and dielectric constant because the electrical properties of tissues or cells are strongly related with their physiological states.
Recently, studies using EIS have been reported to measure the electrical signal response of a single cell or cell cluster in a microfluidic channel. When two electrodes are located at the inlet and outlet positions of the constricting channel, electrical signal might contain the unnecessary information of the medium, not that of the cell.12 The device still allows only a single cell for one assay though the device and can additionally characterize the mechanical properties by micropipette aspiration.13 A numerical protocol was also developed using appropriate mathematical models to derive dielectric properties of subcellular structures.14 These models measured the average dielectric response for 5000 cells at a time, not for the single cell level.
Another EIS device was introduced to measure the dielectric properties of microtumors (100–200 μm in diameter) trapped between opposing electrodes.15 In the case of the planar electrodes, the target cell should be confined on the electrodes with the support of chemical interaction.16 Otherwise, the electrical response of the cell might contain a large amount of the medium, which would be trivial information. Even when a cell is bound to the planar electrodes, the electrical field tends to be confined to a smaller volume of the cell so that only the local properties of the cell will be provided.
The purpose of this study was to experimentally investigate the capability of μEIS to discriminate between normal human prostate cells and cancer cells. Since this method features high-speed, real-time measurement, we can expect to considerably reduce the repetition of the biopsy procedure when EIS is implemented on the tip of the prostate biopsy needle.17 Eventually, this will enhance the prostate cancer detection rate in long-term clinical testing at the tissue level.
The μEIS is equipped with a flexible membrane, which is deflected downward by pneumatic pressure for capturing a single cell. The capturing operation could reduce the gap between the cell and electrodes, enhancing the cell's intrinsic electrical impedance, which will be experimentally proved in Sec. 3A. The cell-clogging problem could be resolved by releasing the flexible membrane as well. This implies that μEIS continuously ascertains the intrinsic signal of the cell and identifies the best frequency to discriminate between normal cells and cancer cells during frequency sweeping. The electrical impedance of a normal human prostate cell (RWPE-1) and a cancer cell (PC-3) were measured by the μEIS without any additional chemical processes, such as the use of biomarkers. A simple cleaning method using deionized water (DI water) allows and confirms the μEIS to operate with high repeatability, which was verified by comparing the electrical impedances before and after each cell assay. For steady and precise results, every assay was conducted using an automated real-time measurement system under identical conditions. To the best of our knowledge, no studies using the flexible membrane have yet been carried out to enhance the sensitivity of electrical impedance measurements, and differentiation between normal prostate cells and cancer cells has not been attempted for cancer detection.
MATERIALS AND METHODS
Human prostate cell
This study is the preliminary test for a clinical test of human prostate. Before conducting the clinical test, we should submit the basic data of the human prostate to the institutional review board (IRB) of any hospitals or medical institutes. Then, we can get an approval of biomedical and behavioral research of humans. For that reason, we chose those cell lines (RWPE-1 and PC-3) to discriminate human prostate normal cell and cancer cell prior to conduct the experiment using patient samples. The diameter of the target cells, the deflection of polydimethylsiloxane (PDMS) membrane, and fabrication possibility were considered in the design of the microfluidic tunnel. Among them, the dominant factor in the μEIS design was the size of the target cells. Living cells are nonuniform in diameter because their biological factors depend on various culturing conditions, such as medium, temperature, differentiation, and so on.18, 19 As target cells in this research, the average diameters of the RWPE-1 and PC-3 cells were 29.48 μm and 32.39 μm, respectively, which were estimated from microscopic images (standard deviation of the RWPE-1 and PC-3 were 6.94 μm and 7.00 μm, respectively).
RWPE-1 and PC-3 cells were cultured according to the general guidelines of the American Type Culture Collection (ATCC). Before the cell assays were conducted, the target cells were maintained under identical conditions: differentiations (a process of subculturing cells), cell density of 3×10⁶/ml and Dulbecco's modified phosphate buffered saline (PBS) (Invitrogen Co. Ltd) as common medium for both target cells. During the target cell assays, the cells were consistently stirred at 3 min intervals to ensure that they were uniformly distributed in the syringe.
General consideration of the device design
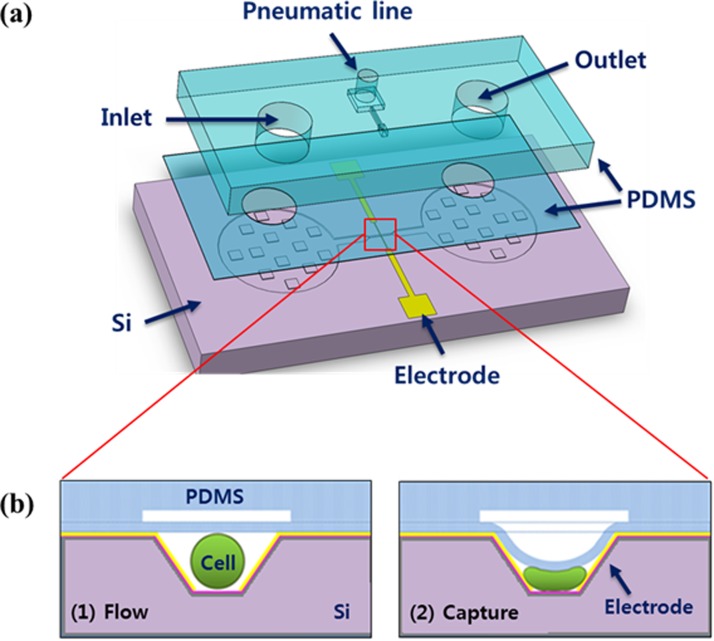
Fig. 1 shows the overall design of the proposed μEIS and the cell capturing operation. The device fabricated by microelectromechanical systems (MEMS) technology consists of three main parts: microfluidic channel, sensing electrodes, and flexible membrane. At the center of the microfluidic channel, a microfluidic tunnel structure, whose width is slightly smaller than the diameter of a single prostate cell (around 30 μm), is placed to enhance the electrical sensitivity by confining the electrical fields into the cell.
Figure 1.
Schematic of the proposed μEIS: (a) three layers of components of the μEIS and (b) cross-sectional view of the microfluidic tunnel at the center of the μEIS, which is capable of capturing a single cell.
A living cell in a suspension medium can be modeled as an electrical equivalent circuit.20 The electrical equivalent circuit model for cell-on-electrodes was also derived by Giaever and Keese.21 From these models, a smaller gap between the cells and electrodes can be verified to give rise to a higher sensitivity in the electrical impedance measurement of the cells, compared with floating cells in a medium. Living cells have been known to easily pass through a microfluidic channel whose cross-sectional dimension is smaller than half their diameter.22
The flexible membrane made of PDMS was fabricated as a ceiling of the tunnel as shown in Fig. 1. PDMS is suitable as a material for medical devices due to its good biocompatibility, transparency, and durability.23 The PDMS membrane, when pneumatic pressure is applied externally, reduces the height of the tunnel, capturing a single cell on the surface of the sensing electrodes. This also enhances the electrical sensitivity because the cell is squeezed to minimize the gap between the cell and electrodes as illustrated in Fig. 1b. Then, real-time electrical impedance measurement of the single cell is conducted by a pair of sensing electrodes.
The electrodes are made of Cr/Au that is deposited on the slanted sidewalls fabricated by anisotropic wet etching of (100) silicon. The slant angle of the sidewalls from the bottom of the tunnel is 54.74° because the etch rate of silicon depends on the crystallographic directions of silicon atoms (orientation-dependent).24 The slanted sidewalls of the tunnel allow relatively easy fabrication of the electrodes, compared with vertical sidewalls whose 90° corners at the top and bottom of the microfluidic tunnel are not readily patterned and metalized.
Design of the microfluidic tunnel and PDMS membrane
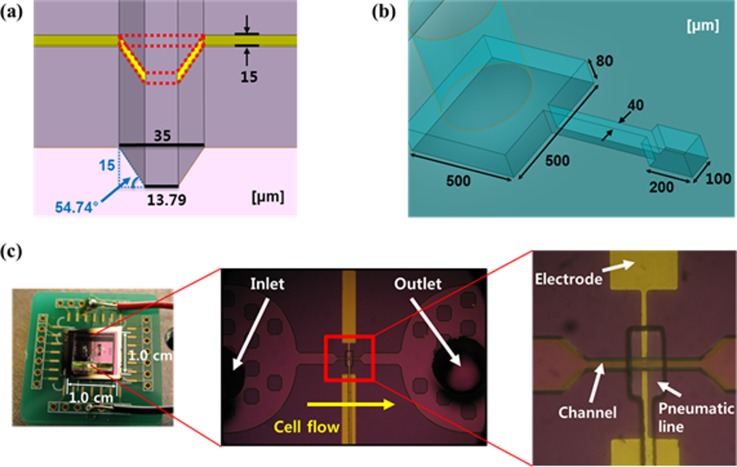
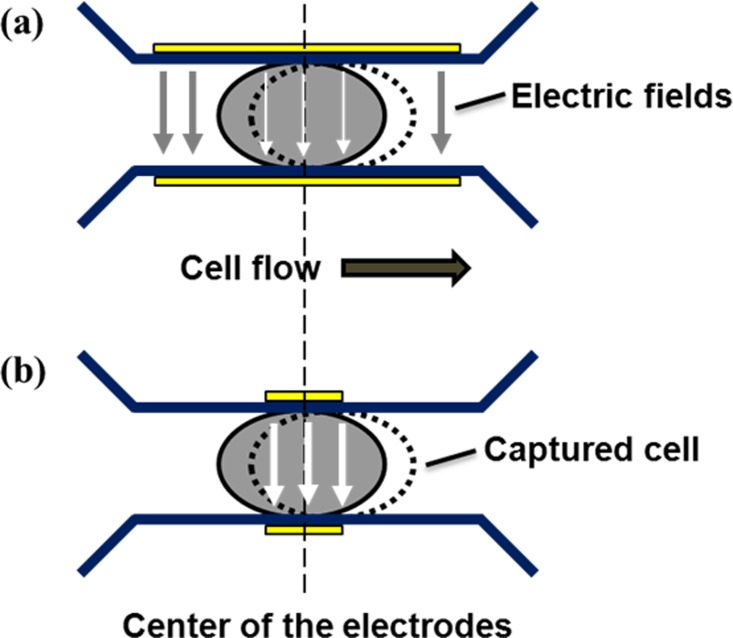
Design schematics and images of the fabricated μEIS are shown in Fig. 2, where the dimensions of the tunnel and electrodes are given in detail. Let us consider the capturing of a cell, as illustrated in Fig. 3, to determine the dimension of the sensing electrodes. If the electrode length is longer than the single cell length, most of the electric fields between the sensing electrodes will flow into the medium, a liquid containing the cells. This is because the electrical conductivity of the medium is higher than that of the cell.25 In other words, the measured electrical signals will contain a large amount of unnecessary information, electrical signals of the medium. Therefore, the electrode length is determined to be around 1/3 the length of a squeezed single cell considering the margin of capturing error.
Figure 2.
Designed schematics and fabricated images of the μEIS: (a) dimensions of the tunnel, (b) dimensions of the pneumatic line, and (c) fabricated entire μEIS on a printed circuit board (PCB) and microscopic images.
Figure 3.
Schematics of the electric fields between the sensing electrodes at a captured single cell: (a) the length of the sensing electrodes is longer than that of the squeezed single cell and (b) the length of the sensing electrodes is shorter than that of the squeezed single cell; the electric field is effectively confined in the cell, resulting in a higher sensitivity, and mainly contains a large amount of necessary information, electrical signals of the cell. The arrows represent the electric fields, and the larger width of the arrow means the higher intensity of the electric field under the identical external voltage. The dotted circle represents the deviation of the captured single cell from the center of the sensing electrodes.
The tunnel width at the top is designed as 35 μm, and the tunnel height is designed as 15 μm. The width of the sensing electrodes on the slanted sidewalls of the tunnel is 15 μm as shown in Fig. 2a. Although the height of tunnel is smaller than the cell diameter, the squeezed cell-clogging problem does not happen because cells show a high deformability so that they can pass through a narrow tunnel that is less than half their diameter.
The deflection of the PDMS membrane was simulated using ANSYS 11.0 (ANSYS Inc.). The maximum displacement of the membrane at the center is 10.076 μm at a pneumatic pressure of 350 kPa under the allowable stress. The simulated displacement is satisfactory to capture a single cell, which will be experimentally verified in Sec. 3A.
Experimental setup
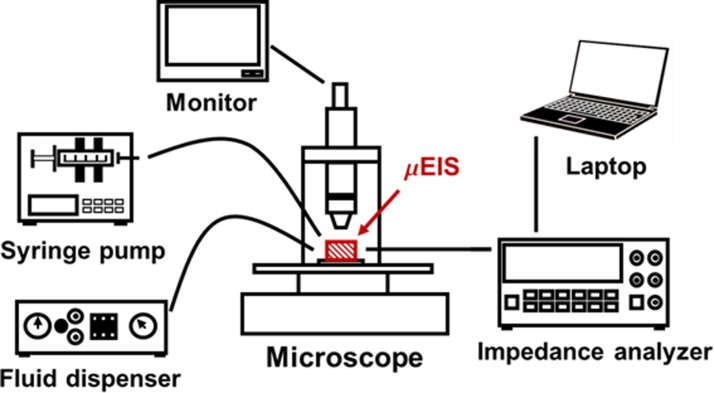
Fig. 4 shows the schematic of the experimental setup to build automated measurement. An impedance analyzer (HP 4294A), a syringe pump (KDScientific KDS-230), a fluid dispenser (EFD 1500-XL), and a laptop were connected to the μEIS to measure the electrical impedances of target cells. A microscope (Leetech LTVIM-35B) was used to observe the cells passing through the tunnel regions. For precise and steady experimental results, all the conditions were controlled and maintained under identical states during every assay: a room temperature of 25 °C, applied voltage (0.5 Vp-p), the sweep frequency range (100 Hz ∼1 MHz) and sampling interval (4.5 ms) of the impedance analyzer, and the flow rate of the syringe pump (0.5 μl/min). All the assays were conducted at the laboratory of the Department of Pathology of Eulji Hospital (Seoul, Republic of Korea) within 30 min after cells were detached from their cell culturing flask to minimize damage to the cells. The detailed durations for 1st DI water, normal cell, 2nd DI water, cancer cell, and 3rd DI water were 3 min, 10 min, 3 min, 10 min, and 3 min, respectively.
Figure 4.
Schematic of the experimental setup for the μEIS (hatched lines in red color). The μEIS is connected with an impedance analyzer, a syringe pump, and a fluid dispenser.
RESULTS AND DISCUSSION
Electrical impedances of the cells
The cells in the syringe are injected into the microfluidic channel of the μEIS. When a single normal prostate cell or cancer cell arrives near the microelectrodes in the microfluidic tunnel, the thin flexible membrane is deflected downward by pneumatic pressure (350 kPa), capturing the cell on the surface of the electrodes. The deflections of the PDMS membrane were calculated using ANSYS simulation; the deflections at 0 kPa, 150 kPa, and 350 kPa were estimated to be about 0 μm, 5 μm, and 10 μm, respectively. Under the pressure of 0 kPa and 150 kPa, the cells freely passed through the microfluidic tunnel at the velocity of around 2 μm/ms, which was estimated from the video images. Under the pressure of 350 kPa, the PDMS membrane could capture a single cell, allowing the electrical impedances of the cell to be measured with a higher sensitivity. The numbers of captured normal cell and cancer cells with respect to PDMS membrane pressures are presented in Table TABLE I.. To ensure consistent and precise results, every assay was conducted under identical conditions as mentioned in Sec. 2D. The viability (specifically the PC-3) of cells after they were exposed to pneumatic pressure was estimated to be in the range of 20%–50% based on a ratio of compressed gap size to cell diameter before deformation.26
TABLE I.
Discrimination index for electrical impedance and admittance at 8.7 kHz with respect to the PDMS membrane pressure. “–” means that the RWPE-1 and PC-3 cells are not discriminated; (%) indicates the average difference rate between the normal cell and cancer cell.
| Electrical impedance and admittance | PDMS membrane pressure [kPa] | |||
|---|---|---|---|---|
| 0 | 150 | 350 | ||
| Number of cell | Normal | 56 | 32 | 50 |
| Cancer | 37 | 40 | 40 | |
| Impedance | Z (Magnitude) | 1.005 (0.38%) | 1.002 (0.18%) | 1.448 (29.51%) |
| Z = R+iX | ϕ (Phase) | – | 1.014 (1.07%) | – |
| R (Resistance) | – | 1.109 (8.28%) | – | |
| X (Reactance) | 1.006 (0.50%) | 1.002 (0.10%) | 1.447 (29.59%) | |
| Admittance | Y (Magnitude) | 1.005 (0.38%) | 1.002 (0.18%) | 1.578 (54.55%) |
| Y = G+iB | ϕ (Phase) | – | 1.014 (1.07%) | – |
| G (Conductance) | – | 1.101 (7.88%) | – | |
| B (Susceptance) | – | 1.006 (0.46%) | 1.582 (54.59%) | |
The frequency range of the measurement was divided into 100 intervals from 100 Hz to 1 MHz. The differences, a distinct gap of the average values between the RWPE-1 and PC-3, could be detected at dozens of particular frequencies. The clearest difference, the largest gap, was observed at 8.7 kHz. Once the best frequency of the highest differentiation was known, it became possible to conduct real-time measurement without frequency sweeping. It took around 5 s to measure the electrical properties of a single cell (frequency sweeping: 1 s, and manual operation of cell capturing/releasing: 4 s). The measurement time will be considerably reduced in case of automatic operation and electrical measurement at a single frequency of best discrimination.
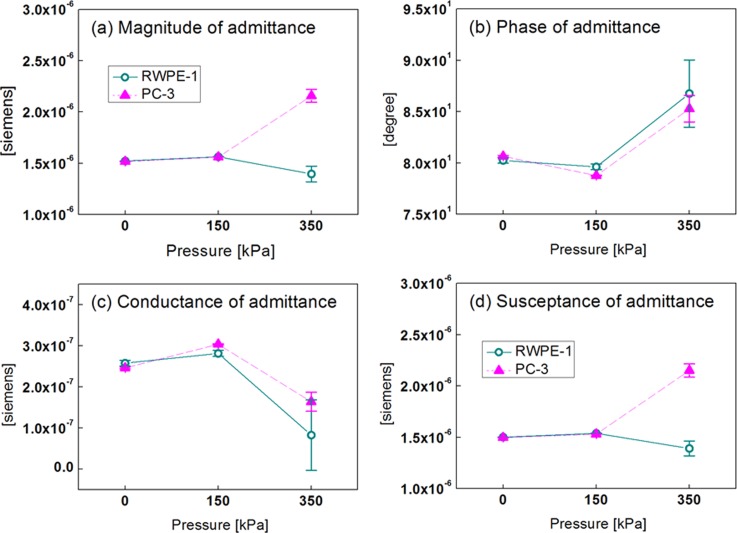
Fig. 5 shows the electrical impedance responses of RWPE-1 and PC-3 cells at 8.7 kHz as a function of PDMS membrane pressure. The measured electrical responses of the cell were analyzed in terms of both impedance and admittance. We found that the admittance result was better in terms of discrimination index (D), which is expounded in Table TABLE I..
Figure 5.
Electrical responses, admittance, of RWPE-1 and PC-3 cells at 8.7 kHz as a function of PDMS membrane pressure: (a) magnitude, (b) phase, (c) conductance, and (d) susceptance. The vertical bars represent a standard deviation.
The admittance values of RWPE-1 and PC-3 cells were almost the same at 0 kPa and 150 kPa, respectively. This is because the cells in both cases freely passed through the microfluidic tunnel with no physical contact to the electrodes. However, the magnitude and susceptance of normal and cancerous cells can be definitely discriminated at 350 kPa because the cells can keep physical contact with the electrodes. The discrimination between the cells may come from the effect of cell captured by PDMS membrane deflection. Capturing a single cell minimizes the gap between the cell and electrodes, and focuses the electrical fields into the cell, thereby enhancing the sensitivity in the measurement of the cell's intrinsic electrical impedance. The electrical properties of cells are strongly related with their physiological states, and the reactance value of cancer cell lines are lower for more pathologically progressed cells.27 Prostate cells undergo similar electrical changes as they transform to a malignant state, which is supported by the result of our experiments. The proposed method of capturing a single cell is more effective than our previous work28 in that the most discriminating frequency can be exploited for real-time measurement, and any target cell whose diameter is similar to the width of the tunnel can be examined by the proposed μEIS as well.
Electrical impedance analysis
Two-sample T-test, one of the statistical significance tests, is usually used to statistically compare two independent sample means by calculating the p-value.29 Even though the two means are significantly distinct in the T-test, their error bars (standard deviation or others) can overlap their ranges. Therefore, the discrimination index (D) was defined to more strictly find the conditions for the best discrimination between normal cells and cancer cells.
To quantitatively evaluate the effectiveness of the discrimination, discrimination index was defined as
| (1) |
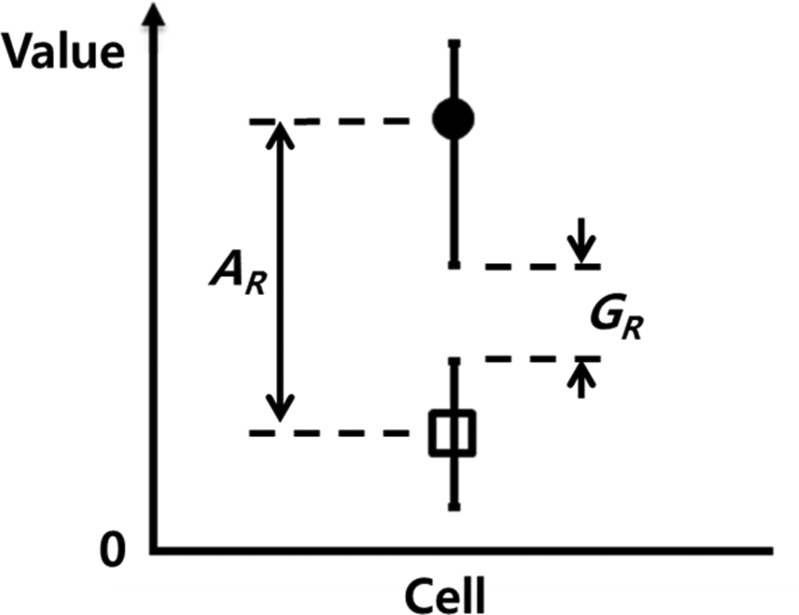
where AR and GR are the average ratio and gap ratio, respectively. As depicted in Fig. 6, the average ratio is the ratio of the upper-level average to the lower-level average, and the gap ratio is the ratio of the upper-level minimum to lower-level maximum. When the value of D is greater than 1.0, the data points are well discriminated with a low variance. The discrimination index for electrical impedance and admittance at 8.7 kHz with respect to the PDMS membrane pressure is summarized in Table TABLE I.. The differentiation indices, based on the electrical signal responses, were confirmed to have efficiently distinguished normal human prostate cells from cancer cells.
Figure 6.
Definition of the discrimination index, D = AR · GR, which is nondimensionalized. AR and GR are the average ratio and gap ratio, respectively.
The highest D value was 1.582 for the susceptance, which is almost the same as 1.578 for the magnitude of admittance. Thus, the susceptance and magnitude of admittance at the frequency of 8.7 kHz at the pressure 350 kPa can be selected to discriminate target cells as preferable measurement conditions. Average differences in the magnitude of admittance and susceptance were 54.55% and 54.59%, respectively, which can be estimated from Fig. 5. Also the differences in the admittance values at the 0 kPa and 150 kPa are described in Table TABLE I.; the maximum difference among the values is less than 8%. The results were confirmed to be statistically significant by a two-sample T-test at a 1% significance level (p < 0.01) using Minitab 14.2 (Minitab Inc.). In this methodology, it is assumed that the relative difference in electrical response can exist between normal cells and cancer cells for each patient, though their absolute signal level might differ from each other. This assumption will be verified through extensive clinical experiments as a further research.
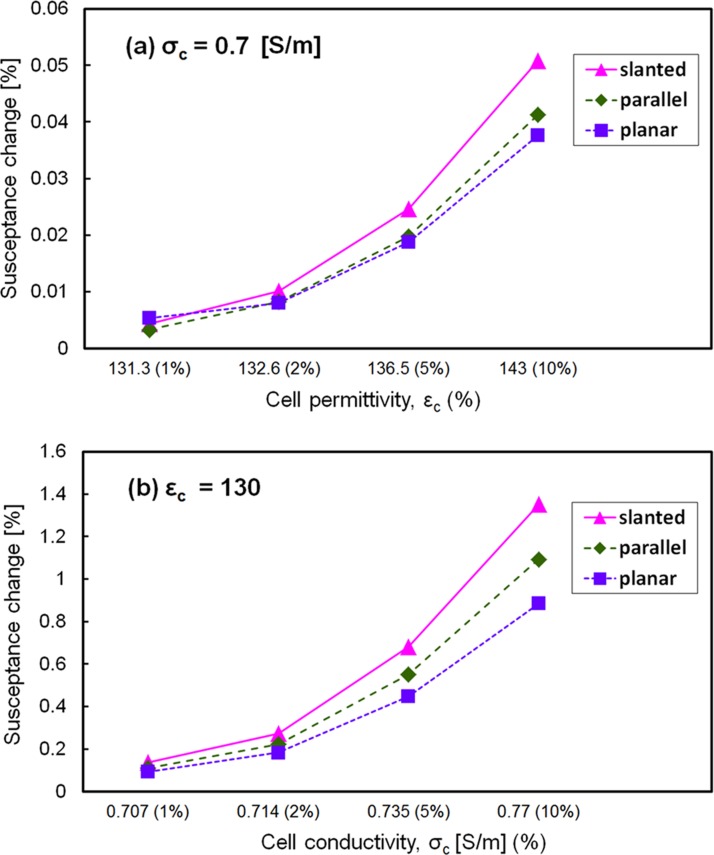
To theoretically support the higher electrical sensitivity in the present design, susceptance was simulated (COMSOL Multiphysics 4.2) for three types of electrodes: slanted, vertical, and planar electrodes with the same dimensions of the microfluidic channel (15 μm in height, 22.4 μm in average width, and 45 μm in length). A single cell located in the center between two electrodes was considered in the simulation, where the conductivity (σc) and the permittivity (εc) of the cell were varied by 1%, 2%, 5%, and 10% from the reference value (σc = 0.7 [S/m] and εc = 130).25, 30 The simulation results revealed that the susceptance value of the slanted type was 20%–30% higher than those of the other two types at 8.7 kHz (the best discrimination frequency in the experiment), as shown in Fig. 7.
Figure 7.
Simulated susceptance at 8.7 kHz for three types of electrode configurations (slanted, parallel, and planar electrode): (a) susceptance with respect to cell permittivity and (b) susceptance with respect to cell conductivity. Relative permittivity and conductivity of the medium were 78 and 1.5 S/m, respectively.
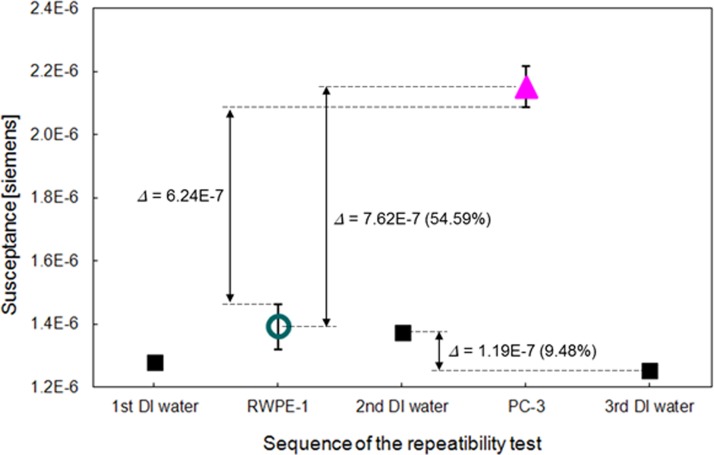
To validate the repeatability of the measurements, the electrical impedances of DI water were measured before and after each cell assay in the same way as in the cell assay. The sequence of the repeatability tests is as follows: DI water, RWPE-1, DI water, PC-3, and DI water. The maximum difference of the susceptance in the DI water tests is 1.19 × 10⁻⁷. This difference value is sufficiently smaller than the average difference (7.62 × 10⁻⁷) and gap difference (6.24 × 10⁻⁷) between the target cells as shown in Fig. 8. The DI water allows the μEIS to operate with high repeatability, which was supported by comparison of the electrical impedances before and after each cell assay. This implies that the developed μEIS can discriminate normal human prostate cells from cancer cells with high repeatability. The μEIS also features a simple test without any chemical procedure, such as biomarkers tagging, which supports that μEIS is applicable as a useful physical marker.
Figure 8.
Repeatability tests for the susceptance of admittance by using deionized water before and after each cell assay (RWPE-1 and PC-3). The values of the graph represent the maximum difference of the cell assays and the DI water assays at pressures of 0 kPa, 150 kPa, and 350 kPa. All experiments were conducted at 8.7 kHz.
CONCLUSIONS
The developed μEIS can measure the electrical signal responses of a single prostate cell for high electrical sensitivity. The experimental results suggest that discrimination between normal prostate cells and cancer cells based on electrical impedances is realized by the μEIS, which can control the cross-sectional area of a microfluidic channel by pneumatic pressure. Normal human prostate cells (RWPE-1) and cancer cells (PC-3) are well discriminated (max. difference 54.59% in susceptance at 8.7 kHz and 350 kPa). The proposed measurement was confirmed to be reliable by statistical calculation using a T-test, and DI water flowing into the microfluidic channel was confirmed to be a simple cleaning method. To the best of our knowledge, no studies have yet been carried out on electrical impedance measurement of normal prostate cells and cancer cells for cancer detection. As future research to advance the development of the μEIS, a prostate biopsy probe combined with the μEIS will enhance the prostate cancer detection rate. Consequently, the proposed μEIS, which uses electrical impedance as one of the physical markers rather than biomarkers, can provide an effective method to discriminate a single RWPE-1 and PC-3 cells.
ACKNOWLEDGMENTS
This research was supported by a grant from the Institute of Medical System Engineering (iMSE) in the GIST, Korea.
References
- Baade P. D., Youlden D. R., and Krnjacki L. J., Mol. Nutr. Food Res. 53, 171 (2009). 10.1002/mnfr.200700511 [DOI] [PubMed] [Google Scholar]
- Brawer M. K. and Kirby R., Fast Facts: Prostate Specific Antigen (Health Press, Oxford, 1999), p. 4. [Google Scholar]
- Catalona W. J., Richie J. P., Ahmann F. R., Hudson M. A., Scardino P. T., Flanigan R. C., de Kernion J. B., Ratliff T. L., Kavoussi L. R., Dalkin B. L. et al. , J. Urol. 151, 1283 (1994); available at http://www.ncbi.nlm.nih.gov/pubmed/7512659. [DOI] [PubMed] [Google Scholar]
- Roehl K. A., Antenor J. A., and Catalona W. J., J. Urol. 167, 2435 (2002). 10.1016/S0022-5347(05)64999-3 [DOI] [PubMed] [Google Scholar]
- Graif T., Loeb S., Roehl K. A., Gashti S. N., Griffin C., Yu X., and Catalona W. J., J. Urol. 178, 88 (2007). 10.1016/j.juro.2007.03.017 [DOI] [PubMed] [Google Scholar]
- Ukimura O., Coleman J. A., de la Taille A., Emberton M., Epstein J. I., Freedland S. J., Giannarini G., Kibel A. S., Montironi R., Ploussard G., Roobol M. J., Scattoni V., and Jones J. S., Eur. Urol. 63, 214 (2013). 10.1016/j.eururo.2012.09.033 [DOI] [PubMed] [Google Scholar]
- Pinto P. A., Chung P. H., Rastinehad A. R., Baccala A. A., Kruecker J., Benjamin C. J., Xu S., Yan P., Kadoury S., Chua C., Locklin J. K., Turkbey B., Shih J. H., Gates S. P., Buckner C., Bratslavsky G., Linehan W. M., Glossop N. D., Choyke P. L., and Wood B. J., J. Urol. 186, 1281 (2011). 10.1016/j.juro.2011.05.078 [DOI] [PMC free article] [PubMed] [Google Scholar]
- Overduin C. G., Futterer J. J., and Barentsz J. O., Curr. Urol. Rep. 14, 209 (2013). 10.1007/s11934-013-0323-z [DOI] [PubMed] [Google Scholar]
- Shim S., Kim M. G., Jo K., Kang Y. S., Lee B., Yang S., Shin S., and Lee J., J. Biomech. Eng. 132, 104501 (2010). 10.1115/1.4002180 [DOI] [PubMed] [Google Scholar]
- Poenar D. P., Iliescu C., Carp M., Pang A. J., and Leck K. J., Sens. Actuators, A 139, 162 (2007). 10.1016/j.sna.2006.10.009 [DOI] [Google Scholar]
- Prakash S. B. and Abshire P., IEEE Sens. J. 7, 440 (2007). 10.1109/JSEN.2006.889213 [DOI] [Google Scholar]
- Tan Q., Ferrier G. A., Chen B. K., Wang C., and Sun Y., Biomicrofluidics 6, 034112 (2012). 10.1063/1.4746249 [DOI] [PMC free article] [PubMed] [Google Scholar]
- Chen J., Zheng Y., Tan Q., Zhang Y. L., Li J., Geddie W. R., Jewett M. A. S., and Sun Y., Biomicrofluidics 5, 014113 (2011). 10.1063/1.3571530 [DOI] [PMC free article] [PubMed] [Google Scholar]
- Sabuncu A. C., Zhuang J., Kolb J. F., and Beskok A., Biomicrofluidics 6, 034103 (2012). 10.1063/1.4737121 [DOI] [PMC free article] [PubMed] [Google Scholar]
- Luongo K., Holton A., Kaushik A., Spence P., Ng B., Deschenes R., Sundaram S., and Bhansali S., Biomicrofluidics 7, 034108 (2013). 10.1063/1.4809590 [DOI] [PMC free article] [PubMed] [Google Scholar]
- Javanmard M., Talasaz A. H., Nemat-Gorgani M., Pease F., Ronaghi M., and Davis R. W., Biomicrofluidics 1, 044103 (2007). 10.1063/1.2815760 [DOI] [PMC free article] [PubMed] [Google Scholar]
- Kang G., Kim J. C., Kim S., and Lee J. H., in Proceedings of the 6th International Conference on Biomedical Electronics and Devices, Barcelona, Spain, 11–14 February (SciTePress, 2013), pp. 47–50.
- An J., Lee J., Kim Y., Kim B., and Lee S., “Analysis of cell separation efficiency in dielectrophoresis-activated cell sorter,” in Proceedings of the 3rd IEEE International Conference on Nano/Micro Engineered and Molecular Systems, Sanya, China, 6–9 January 2008 (IEEE, 2008), pp. 965–969.
- Kim Y. C., Park S., and Park J., Analyst 133, 1432 (2008). 10.1039/B805355C [DOI] [PubMed] [Google Scholar]
- Morgan H., Sun T., Holmes D., Gawad S., and Green N. G., J. Phys. D 40, 61 (2007). 10.1088/0022-3727/40/1/S10 [DOI] [Google Scholar]
- Giaever I. and Keese C. R., Proc. Natl. Acad. Sci. U.S.A. 88, 7896 (1991). 10.1073/pnas.88.17.7896 [DOI] [PMC free article] [PubMed] [Google Scholar]
- Suresh S., Acta Mater. 55, 3989 (2007). 10.1016/j.actamat.2007.04.022 [DOI] [Google Scholar]
- Lotters J. C., Olthuis W., Veltink P. H., and Bergveld P., J. Micromech. Microeng. 7, 145 (1997). 10.1088/0960-1317/7/3/017 [DOI] [Google Scholar]
- Bassous E., IEEE Trans. Electron Devices 25, 1178 (1978). 10.1109/T-ED.1978.19249 [DOI] [Google Scholar]
- Carminati M., Vahey M. D., Rottigni A., Ferrari G., Voldman J., and Sampietro M., in Proceedings of the 14th International Conference on Miniaturized Systems for Chemistry and Life Sciences, Groningen, The Netherlands, 3–7 October 2010 (Chemical and Biological Microsystems Society, 2010), pp. 1394–1396.
- Takamatsu H., Takeya R., Naito S., and Sumimoto H., J. Biomech. 38, 117 (2005). 10.1016/j.jbiomech.2004.03.011 [DOI] [PubMed] [Google Scholar]
- Han A., Yang L., and Frazier A. B., Clin. Cancer Res. 13, 139 (2007). 10.1158/1078-0432.CCR-06-1346 [DOI] [PubMed] [Google Scholar]
- Kang G., Yoo S. K., Kim H., and Lee J., IEEE Sens. J. 12, 1084 (2012). 10.1109/JSEN.2011.2167227 [DOI] [Google Scholar]
- Goodman S. N., Ann. Intern Med. 130, 995 (1999). 10.7326/0003-4819-130-12-199906150-00008 [DOI] [PubMed] [Google Scholar]
- Yang J., Huang Y., Wang X., Wang X. B., Becker F. F., and Gascoyne P. R. C., Biophys. J. 76, 3307 (1999). 10.1016/S0006-3495(99)77483-7 [DOI] [PMC free article] [PubMed] [Google Scholar]


