Abstract
Purpose: In contrast to the dominant medical liquid crystal display (LCD) technology, organic light-emitting diode (OLED) monitors control the display luminance via separate light-emitting diodes for each pixel and are therefore supposed to overcome many previously documented temporal artifacts of medical LCDs. We assessed the temporal and luminance characteristics of the only currently available OLED monitor designed for use in the medical treatment field (SONY PVM2551MD) and checked the authors’ main findings with another SONY OLED device (PVM2541).
Methods: Temporal properties of the photometric output were measured with an optical transient recorder. Luminances of the three color primaries and white for all 256 digital driving levels (DDLs) were measured with a spectroradiometer. Between the luminances of neighboring DDLs, just noticeable differences were calculated according to a perceptual model developed for medical displays. Luminances of full screen (FS) stimuli were compared to luminances of smaller stimuli with identical DDLs.
Results: All measured luminance transition times were below 300 μs. Luminances were independent of the luminance in the preceding frame. However, for the single color primaries, up to 50.5% of the luminances of neighboring DDLs were not perceptually distinguishable. If two color primaries were active simultaneously, between 36.7% and 55.1% of neighboring luminances for increasing DDLs of the third primary were even decreasing. Moreover, luminance saturation effects were observed when too many pixels were active simultaneously. This effect was strongest for white; a small white patch was close to 400 cd/m2, but in FS the luminance of white saturated at 162 cd/m2. Due to different saturation levels, the luminance of FS green and FS yellow could exceed the luminance of FS white for identical DDLs.
Conclusions: The OLED temporal characteristics are excellent and superior to those of LCDs. However, the OLEDs revealed severe perceptually relevant artifacts with implications for applicability to medical imaging.
Keywords: organic light emitting diode monitors
INTRODUCTION
The dominant medical display technology, liquid crystal displays (LCDs), have been assessed for medical applications1, 2, 3 and medical research,4, 5, 6, 7 and their temporal properties have been criticized. In particular, the duration and variability of luminance transition times (response times) of LCD monitors might impair stack-mode reading of computed tomography image datasets, i.e., the rapid serial presentations of medical images used by radiologists to detect subtle visual differences.1, 2 Moreover, long response times in combination with the sample and hold nature of LCDs causes visible motion blur.7, 8, 9, 10
Organic light-emitting diode (OLED) monitors are currently niche products on the medical display market, but are expected to become more popular due to their promising temporal properties. While dynamical presentations on LCD devices are realized by the time-consuming reorientation of liquid crystal molecules in response to changing an electrical voltage (LC reorientation), OLED monitors control luminance changes by separately controllable light-emitting diodes for each pixel and are therefore supposed to be substantially faster than even the fastest LCDs. In addition, while luminance transition times on LCD monitors from frame i with luminace li to frame i + 1 with luminace li+1 may considerably vary depending on the specific choices for li and li+1 due to LC reorientation,1, 7 on OLED devices, transition times are supposed to be independent of the luminance in the previous frame.
In this technical note, we mainly assess the SONY PVM 2551MD OLED monitor, which is, according to its manual, specially designed for use in the medical treatment field. We check if this display meets the high expectations with respect to fast luminance transitions and give a concise summary of the temporal signal. The focus of this work is the report on artifacts in the transfer function from digital driving levels (DDLs) to luminances for the single color primaries and on luminance saturations for large displayed objects, where DDLs are the 8-bit values by which application software controls the digital output of the graphics adapter.
METHODS
OLED devices
A SONY PVM 2551MD medical OLED monitor (SONY Inc., Minato, Tokyo, Japan) was tested. The contrast setting was kept at its default level of 90%. In order to prevent warm-up effects, the monitor had been switched on at least 1 h before the measurements. The gamma correction setting was either 2.2 or digital imaging and communications in medicine (DICOM). If not otherwise specified, the brightness setting was kept at its default level of 50%.
The “Color Space” setting of the monitor was “off,” by which the original color reproduction of the panel was used. We used the “Color Temp” setting of D65.
In order to check if the artifacts we found are specific to this monitor, we additionally performed selected measurements on another SONY OLED monitor (PVM 2541). Its display settings were identical to those above, apart from the fact the PVM 2541 device did not have a DICOM mode.
Temporal properties
The photometric output was measured with an optical transient recorder OTR–3 (Display Metrology & Systems GmbH & Co. KG, Karlsruhe, Germany). We measured 1000 frames per condition and determined transition times on the median. Rising and falling transition times were determined between 10% and 90% of the transition. The OTR sensor was placed at the center of the monitor. The measured stimulus was a square covering 10% of the width of the monitor.
Luminance
Luminances and colors were measured with a PR–655 Spectroradiometer (Photo Research, Inc., Chatsworth, CA). We performed five independent measurements per condition. All 256 digital driving levels of the 8-bit graphics adapter were measured for each of the three color primaries and white.
To characterize the discretization effect (see Sec. 3), we calculated the number of just noticeable differences (JNDs) for the intervals between luminances li and li+1 for each digital driving level i = 54, …, 255, i.e., the 200 highest luminance levels for each color primary and white. A JND of 1 is the luminance difference just above the detection threshold for humans.
The JNDs were calculated according to the formula given in the DICOM standard, Sec. 7.1 of Ref. 11. As a rough measure of the discretization effects, we defined intervals with li+1 − li less than 0.95 JNDs to be not perceptually distinguishable (in the following “invisible intervals”). If the DICOM mode of the monitor follows the DICOM standard, it should have 0% invisible intervals, that is, all neighboring luminance levels should be perceptually distinguishable.
RESULTS
Characteristics of the temporal signal
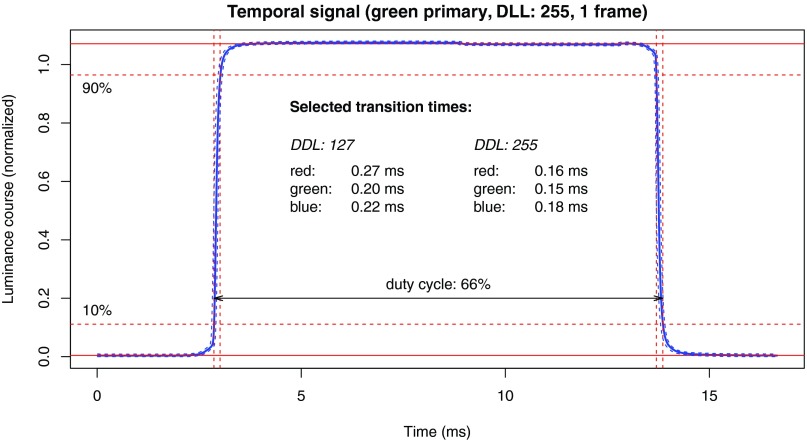
The monitor supported two different temporal modes (“normal” vs “flicker free”). The photometric output of the normal mode is shown in Fig. 1: Within every frame, the luminance is switched on and off with a duty cycle (ratio of on vs off period) of around 2/3. In flicker free mode (not shown), the signal is switched on and off twice within each frame, so that the dominant modulation increased from 60 to 120 Hz and therefore above the critical flicker frequency of humans.
Figure 1.
Photometric output of a static green (DDL: 0, 0, 255) stimulus. Thick solid line: median over 1000 frames; dashed lines surrounding the solid line: 2nd and 98th percentile. Rise/fall times were measured between 10% and 90% level, illustrated by horizontal dashed lines. The respective transition periods are marked by vertical dashed lines. Duty cycle was measured between the 10% levels. Further annotations show selected transition times for the color primaries at two different DDLs. Rise and fall times were identical.
The sharp signal onsets and offsets within each frame illustrated in the figure were independent on the luminance levels of preceding or subsequent frames, so that rise and fall times could be fully characterized by measuring static stimuli. We systematically measured DDLs 63, 127, 191, 255 for the three color primaries. The annotation of Fig. 1 shows transition times for two DDLs in DICOM mode. The respective rise and fall times were identical, and we did not observe transitions longer than 0.3 ms for both gamma 2.2 and DICOM. We measured transitions under different contrast and brightness settings of the monitor. Transition times varied and tended to increase for decreasing DDLs, but none of our measurements exceeded 0.3 ms.
Luminance artifacts
Discretization
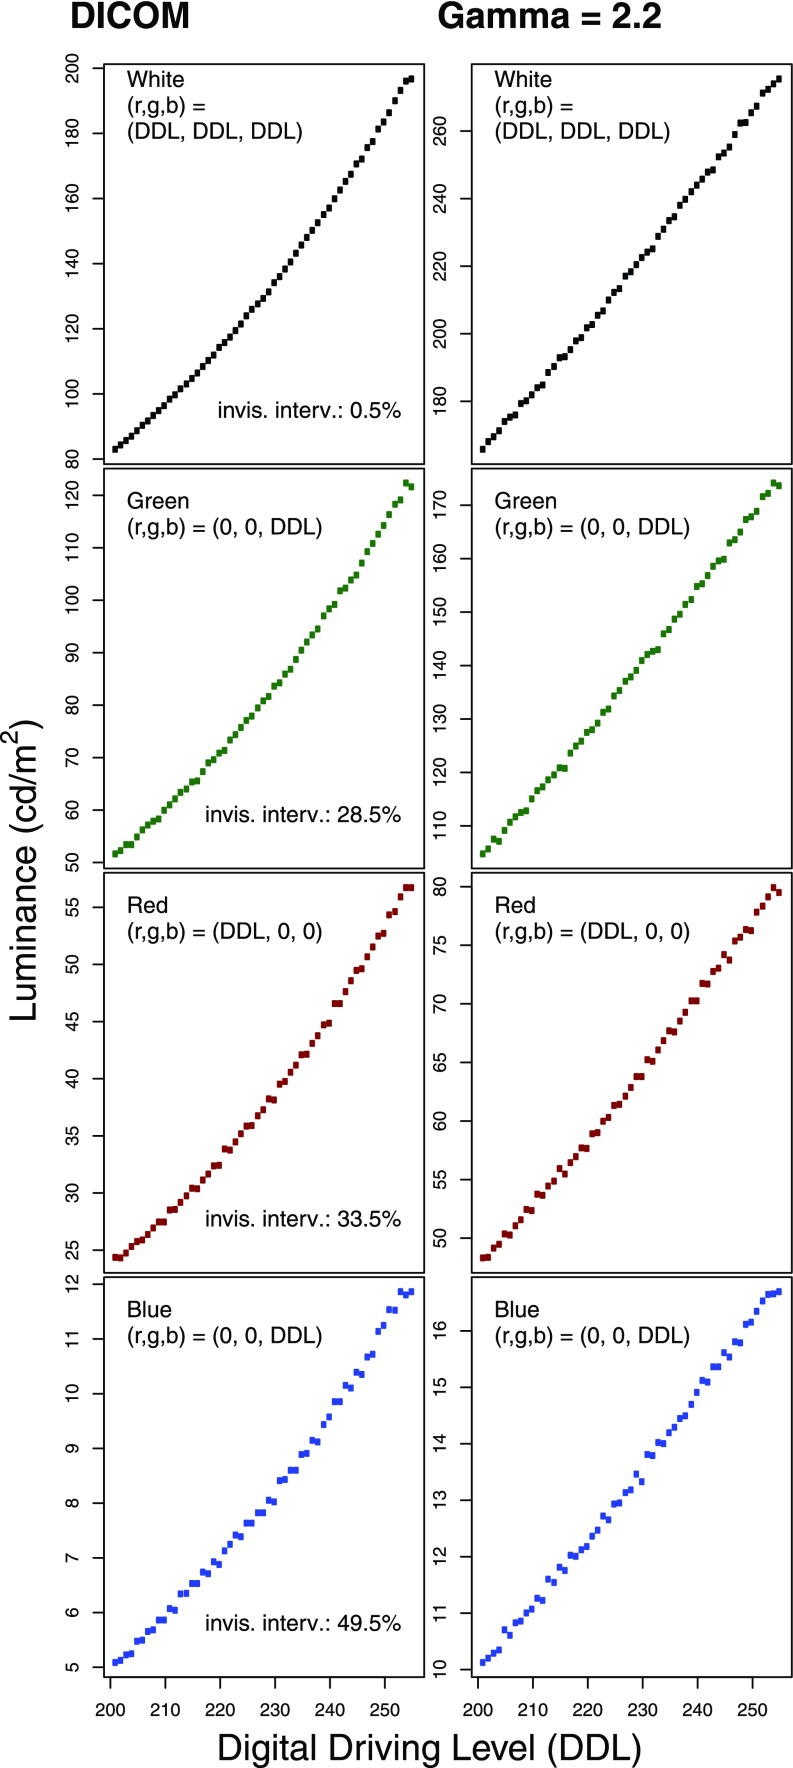
Figure 2 illustrates the transfer functions from DDLs to luminances. Many of the functions are not strictly monotonic increasing and show discretization. The ratio of invisible to visible intervals is negligible for white (0.5%) and highest for blue, where nearly half (49.5%) of the neighboring luminances are not distinguishable.
Figure 2.
Transfer function from DDLs to luminances, shown for DDL ⩾ 200, for all color primaries and white in gamma = 2.2 and DICOM mode, together with the ratio of invisible intervals for DICOM (see Sec. 2). Note the numerous discretization steps. A value of 50% invisible intervals means that half of the neighboring luminances are perceptually indistinguishable for humans.
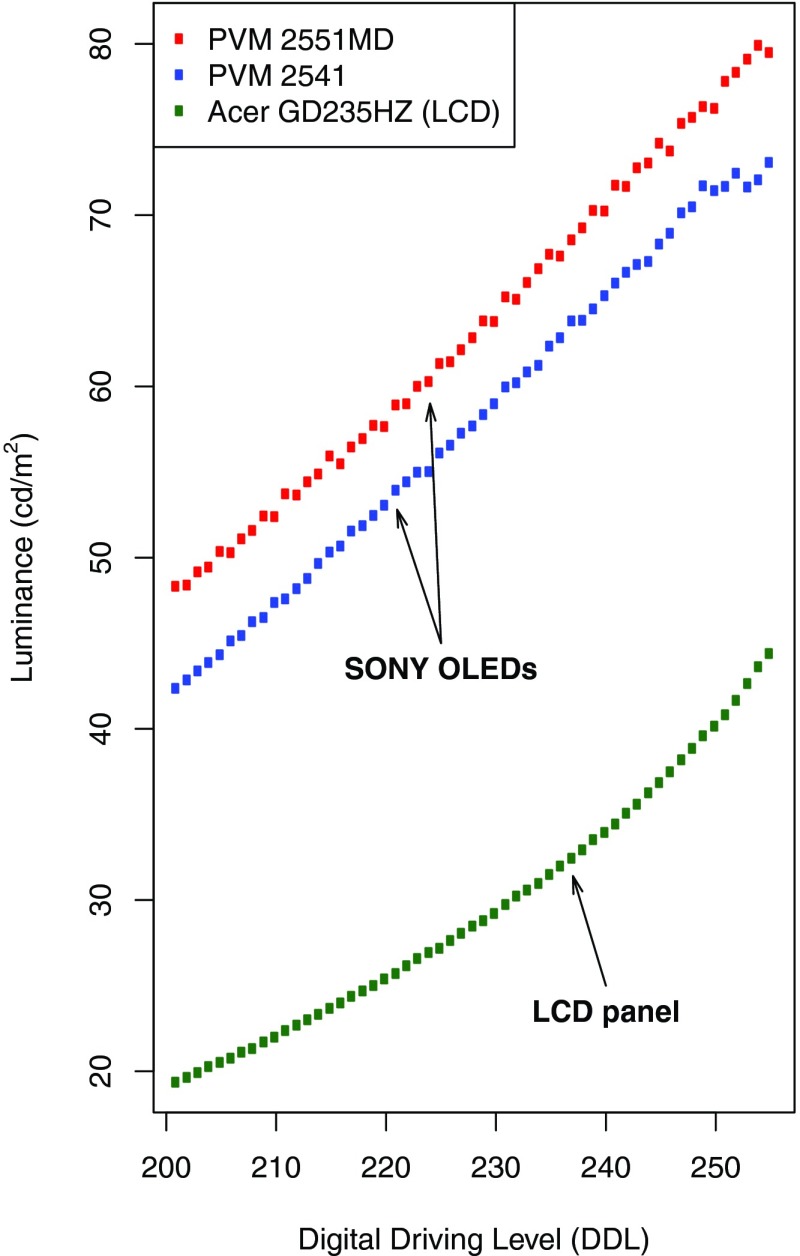
In order to check if these discretization issues are specific to the PVM 2551MD, we compared the gamma 2.2 results of the red primary to the corresponding measurements of the PVM 2541 OLED monitor. Figure 3 shows that the PVM 2541 has less severe and less regular, but nevertheless noticeable discretization issues, particularly for the highest DDLs. As a cross-check of our measurement setup, we additionally measured the red primary of an arbitrarily chosen LCD monitor (Acer GD235HZ, luminance and contrast in default mode). As shown in the figure, the respective luminance curve is as smooth as expected, so that the irregularities of the OLED curves cannot be attributed to measurement artifacts.
Figure 3.
Comparison of the PVM 2551MD results (red primary, gamma 2.2) from Fig. 2 with the respective results for the PVM 2541 OLED monitor and an arbitrarily chosen LCD monitor (Acer GD235HZ).
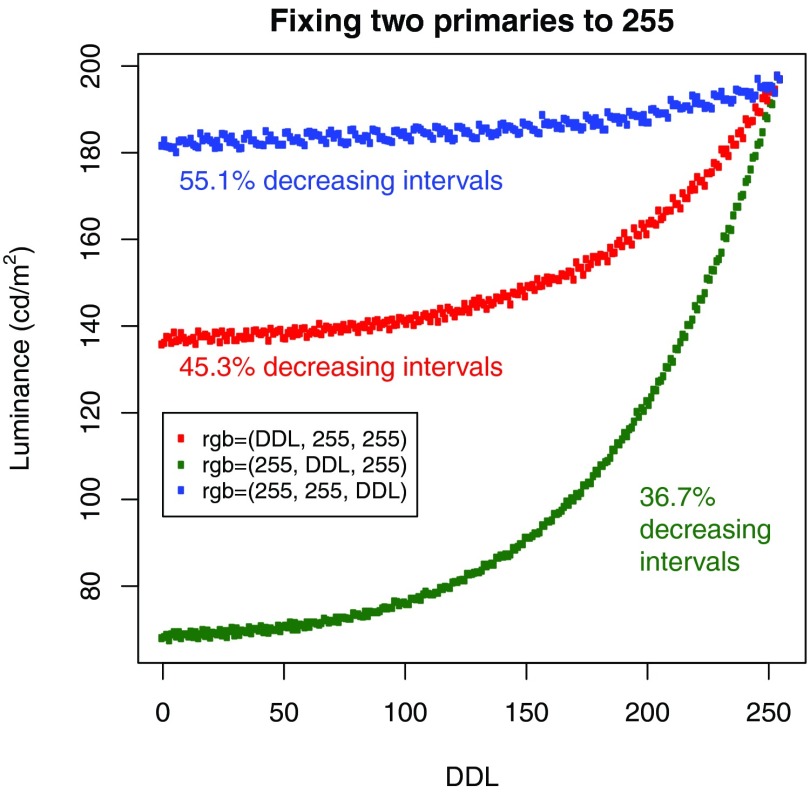
There are interaction effects when more than one color primary is active; when we fixed two of the primaries to DDL 255 and varied the third one from 0 to 255, luminances for neighboring increasing DDLs often decreased, as illustrated in Fig. 4. If we varied the blue primary only (topmost line of dots), this was observed for more than half of the intervals.
Figure 4.
Interaction effects of the color primaries. When two of the three primaries were fixed to DDL 255, numerous luminance intervals for neighboring DDLs decreased instead of increasing.
Saturation
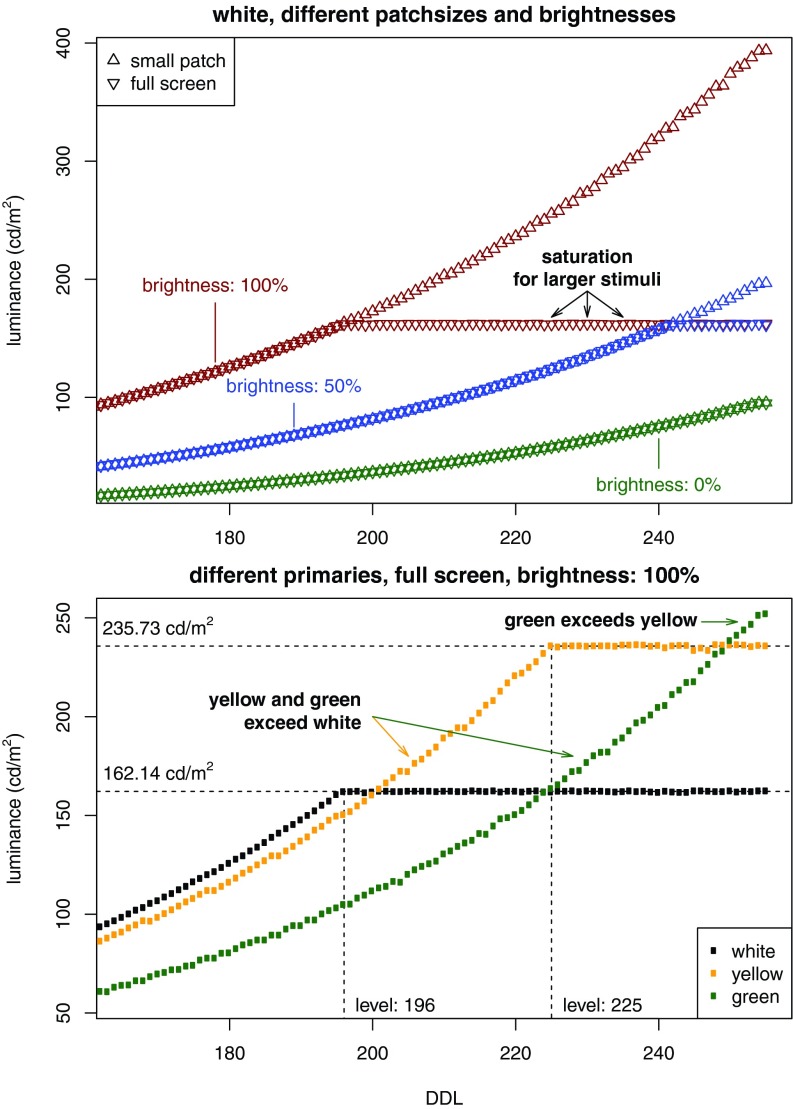
We observed saturation effects when many LEDs were active at high brightness settings. For white stimuli covering the whole screen, the measured luminance always saturated at 162.14 cd/m2, independently of the brightness setting, as illustrated in Fig. 5, top. While the luminance of a white circular patch with diameter of 256 pixels monotonically increases with increasing DDL for all brightness settings, the luminance of a stimulus that covers the full screen increases to DDL 196 and then stays constant, if the brightness is set to its maximum of 100.
Figure 5.
Luminance saturation. If many LEDs, i.e., many pixels, are activated for higher brightness settings, the luminance saturates (top). This effect depends on the number of LEDs per pixel, i.e., the number of simultaneously activated color primaries (bottom).
As shown in Fig. 5, bottom, this saturation does not depend on the number of active pixels on the screen but rather on the number of active LEDs. If all three LEDs per pixel are active (white pixel), the saturation of a full screen stimulus occurs earlier than if only two (here: red and green, yielding a yellow pixel) or one (here: green) LED is active. Although green and yellow are intended to be darker over all DDLs, their luminance exceeds that of white for high DDLs.
Very similar saturation effects were observed for the PVM 2541 (not shown), with slightly later onsets. While, for example, the saturation for white occurred at DDL 196 for the PVM 2551MD (see Fig. 5), it occurred at DDL 210 for the PVM 2541.
Luminance artifacts: Perceptual confirmation
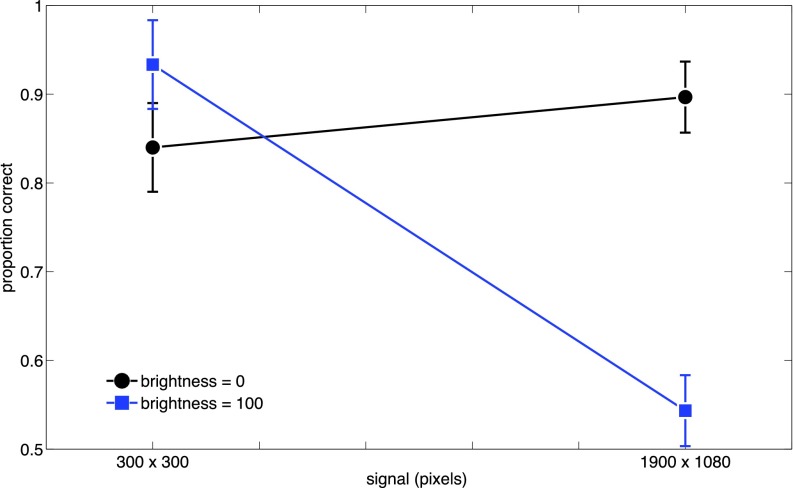
To confirm that the artifacts that we found for luminance lead to measurable perceptual effects, we used a two-interval forced choice luminance increment detection task. The luminance pedestal was set to a DDL of 160, the luminance increment set to 5 DDL, and when no stimuli were displayed the DDL was 128. Each interval lasted 1 s, and contained either the pedestal or the pedestal plus an increment. An interstimulus blank interval appeared for 1 s to distinguish the two intervals. After the second interval was shown, observers had an unlimited time to report which of the two intervals contained the increment.
The monitor was viewed through a square aperture aligned with the center of the screen. Behind the aperture, not visible to the observer, either a large (1900 × 1080 pixels) or small patch (300 × 300 pixels) was drawn. For both size conditions, the monitor was set at one of two brightness levels (0 or 100). The four conditions were run in random order. Figure 6 shows three observers’ proportion correct (250 trials per observer) for the four size/brightness conditions. Given the measurements shown in Fig. 5, we expected that luminance increments would be difficult to detect when the stimuli were large and the monitor set at 100% brightness. As Fig. 6 shows, observers’ proportion correct was at, or near, chance for luminance increments for large stimuli for high brightness settings. These data provide both a confirmation of our photometric measurements and show that the luminance artifacts that we have measured lead to direct perceptual consequences.
Figure 6.
Luminance discrimination data for three observers. The errorbars are 95% confidence intervals.
DISCUSSION
Our temporal measurements show that luminance transition times for the OLED device are substantially shorter than those of typical LCDs.1, 7 In addition, these luminance transitions are independent of the luminance in the previous frame, and although they vary over different target levels, their small values below one third of a millisecond are unlikely to cause any impairments for medical applications such as stack mode reading. Previously discussed7 temporal artifacts that can occur in LCD monitors, such as backlight modulations, dynamic capacitance compensation induced signal overshoots or undershoots, the start of the luminance transition one frame too early, or color drifts during the transition, cannot occur in OLED monitors due to their lack of backlight and liquid crystals.
Unfortunately, however, our measurements also reveal artifacts of the PVM 2551MD. The function which maps DDLs to luminance was monotonic increasing for white but not for any of the three color primaries separately (see Fig. 2). The ratio of invisible intervals for the three color primaries ranged from 28.5% for green to 49.5% for the blue primary. That is, the “perceptual luminance resolution” of the monitor is considerably below 8 bit per color primary. Moreover, we observed interaction effects of the color primaries (Fig. 4) such that the simultaneous activity of more than one color primary caused up to 55.1% decreasing luminance intervals for increasing DDLs.
Medical LCD monitors which support DICOM modes are typically neither subject to invisible intervals nor to discretization steps visible in the luminance curve. Geijer and co-workers12 show in their Fig. 1 the DICOM mode measurements of a Barco MFGD 2320 medical display. The respective curve looks smooth, and all their JNDs are above one. Wu and co-workers13 measured a Barco E-3620 medical LCD in DICOM mode. Although they do not show the respective luminance curve, they do not report on discretization effects nor on invisible intervals but state that the maximal difference between the measured curve and the ideal DICOM curve was below 10%.
In medical imaging, a high “perceptual resolution” of luminance levels can be critical to detect abnormalities. The deficiencies we describe here can therefore be relevant for areas such as radiology, particularly if color images are to be displayed.
The saturation effects we observed (Fig. 5) might also impair applications in medical imaging, for instance if small entities on a homogeneous background are to be visually detected. While a small object on a localized background that covers only a part of the screen might be easily detectable, the same object surrounded by the same background that extends over the whole screen might be even photometrically indistinguishable. The data in Fig. 6 represent an extreme case, but as a consequence, the detection of a tumor, for example, may depend on the size, color, and intensity of the background in which it is embedded.
As our specific control measurements of the second OLED device (SONY PVM 2541) confirm the artifacts of the PVM 2551MD, we can rule out that these deficiencies are unique to only one monitor from the SONY OLED product line. The origin of these artifacts is unclear. The saturation effects, due to which the output luminance is a function of stimulus area, might be caused by a power driver design flaw (we thank the anonymous reviewer for this hint).
CONCLUSION
Our measurements of OLED temporal characteristics confirm the high expectations of OLED technology regarding transition times. The two SONY OLED devices demonstrate that this technology solves a large number of temporal problems for medical and vision science applications related to the LCD technology.
However, the luminance related artifacts we reveal in this work might impair various fields of medical imaging. Practitioners who apply these monitors in clinical practice need to be aware that the luminance resolution is not on a par with that of contemporary medical LCD panels, and that the saturation effects make the detectability of details depend on the size of their background.
Considering the extraordinary favorable OLED temporal characteristics compared to previously measured medical LCD monitors,1 we hope that future medical OLED devices overcome these artifacts.
ACKNOWLEDGMENTS
This work was supported by National Institutes of Health Grant No. R01 EY018664. The authors thank SONY for lending us the two OLED monitors.
References
- Liang H. and Badano A., “Temporal response of medical liquid crystal displays,” Med. Phys. 34(2), 639–646 (2007). 10.1118/1.2428403 [DOI] [PubMed] [Google Scholar]
- Elze T. and Tanner T. G., “Liquid crystal display response time estimation for medical applications,” Med. Phys. 36(11), 4984–4990 (2009). 10.1118/1.3238154 [DOI] [PubMed] [Google Scholar]
- Akamine H., Morishita J., Matsuyama M., Nakamura Y., Hashimoto N., and Toyofuku F., “Chromaticity and correlated color temperature of the white point in medical liquid-crystal display,” Med. Phys. 39(8), 5127–5135 (2012). 10.1118/1.4737869 [DOI] [PubMed] [Google Scholar]
- Elze T., “Achieving precise display timing in visual neuroscience experiments,” J. Neurosci. Methods 191(2), 171–179 (2010). 10.1016/j.jneumeth.2010.06.018 [DOI] [PubMed] [Google Scholar]
- Elze T., “Misspecifications of stimulus presentation durations in experimental psychology: A systematic review of the psychophysics literature,” PLoS ONE 5(9), e12792 (2010). 10.1371/journal.pone.0012792 [DOI] [PMC free article] [PubMed] [Google Scholar]
- Lagroix H. E. P., Yanko M. R., and Spalek T. M., “LCDs are better: Psychophysical and photometric estimates of the temporal characteristics of CRT and LCD monitors,” Attention, Percept. Psychophys. 74(5), 1033–1041 (2012). 10.3758/s13414-012-0281-4 [DOI] [PubMed] [Google Scholar]
- Elze T. and Tanner T. G., “Temporal properties of liquid crystal displays: Implications for vision science experiments,” PLoS ONE 7(9), e44048 (2012). 10.1371/journal.pone.0044048 [DOI] [PMC free article] [PubMed] [Google Scholar]
- Someya J. and Sugiura H., “Evaluation of liquid-crystal-display motion blur with moving-picture response time and human perception,” J. Soc. Inf. Disp. 15(1), 79–86 (2007). 10.1889/1.2451570 [DOI] [Google Scholar]
- Becker M. E., “Motion-blur evaluation: A comparison of approaches,” J. Soc. Inf. Disp. 16(10), 989–1000 (2008). 10.1889/JSID16.10.989 [DOI] [Google Scholar]
- Watson A. B., “Display motion blur: Comparison of measurement methods,” J. Soc. Inf. Disp. 18(2), 179–190 (2010). 10.1889/JSID18.2.179 [DOI] [Google Scholar]
- Digital Imaging and Communications in Medicine (DICOM), Part 14: Grayscale Standard Display Function (National Electrical Manufacturers Association, Rosslyn, VI, 2004). [Google Scholar]
- Geijer H., Geijer M., Forsberg L., Kheddache S., and Sund P., “Comparison of color LCD and medical-grade monochrome LCD displays in diagnostic radiology,” J. Digit Imaging 20(2), 114–121 (2007). 10.1007/s10278-007-9028-5 [DOI] [PMC free article] [PubMed] [Google Scholar]
- Wu J., Wu T. H., Han R. P., Chang S. J., Shih C. T., Sun J. Y., and Hsu S. M., “Comparison of the commercial color LCD and the medical monochrome LCD using randomized object test patterns,” PLoS ONE 7(5), e37769 (2012). 10.1371/journal.pone.0037769 [DOI] [PMC free article] [PubMed] [Google Scholar]


